Bitcoin: Mayer MultipleMayer Multiple Indicator
The Mayer Multiple is a powerful tool designed to help traders assess market conditions and identify optimal buying or selling opportunities. It calculates the ratio between the current price and its 200-day simple moving average (SMA), visualizing key thresholds that indicate value zones, caution areas, and overheated markets.
Key Features:
Dynamic Market Zones: Clearly marked levels like "Smash Buy," "Boost DCA," and "Extreme Euphoria" to guide your trading decisions.
Customizable Input: Adjust the SMA length to fit your strategy.
Color-Coded Signals: Intuitive visualization of market sentiment for quick analysis.
Comprehensive Thresholds: Historical insights into price behavior with plotted reference levels based on probabilities.
This indicator is ideal for traders aiming to enhance their long-term strategies and improve decision-making in volatile markets. Use it to gain an edge in identifying potential turning points and managing risk effectively.
MAYERMULTIPLE
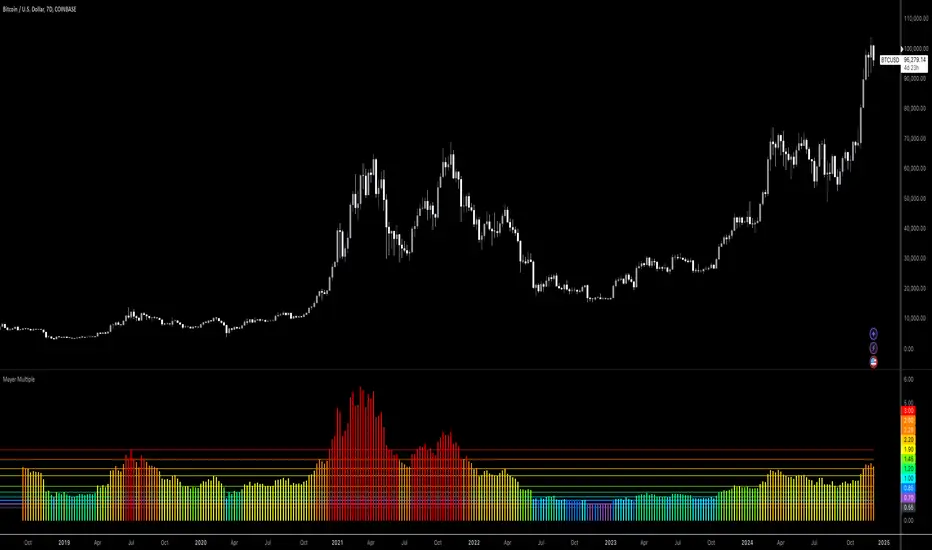
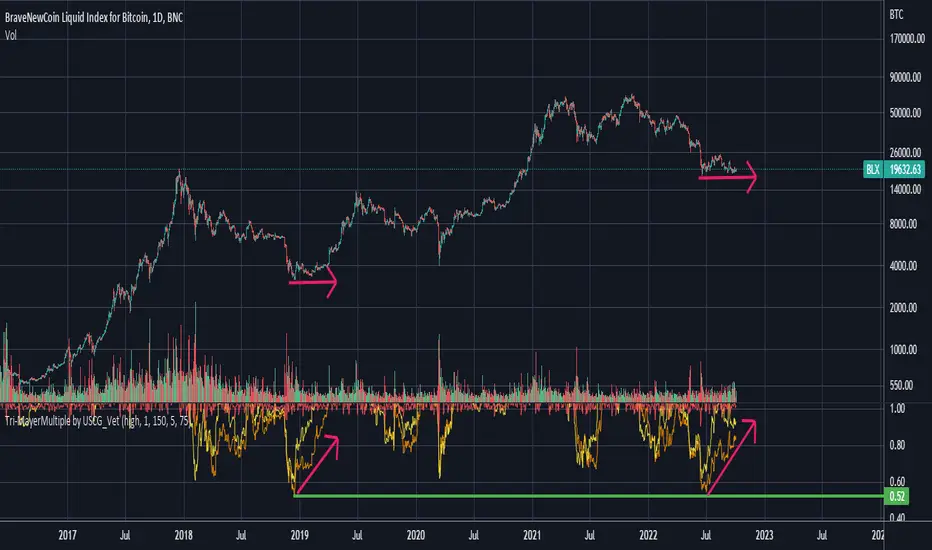
Tri-MayerMultiple by USCG_VetThe Mayer Multiple was created by Trace Mayer as a way to analyze the price of an asset in a historical context.
The Mayer Multiple is the multiple of the current price over some x-day moving average.
I preferred to display multiple average lines as they can help with identifying divergences.
Mayer Multiple StrategyCreated by Trace Mayer, the Mayer Multiple is calculated dividing the current price of Bitcoin by its 200-day moving average. This simple script allows to backtest strategies based on Mayer Multiple levels, which can be easily adjusted. It can be tested on any chart and any timeframe.

Mayer Multiple RainbowUses a more recent sampling (since 2013) to generated Mayer Multiple distribution.

Mayer Multiple Dynamic Histogram [arviman]Plots dynamic levels of the standard mayer multiple based on percentile of recent history. This allows you to view color coded information in a more dynamic fashion.
Hope this helps give you an overview of the current market.
This can be used for crypto but also for quick analysis of the current trend for any other instruments like stocks.
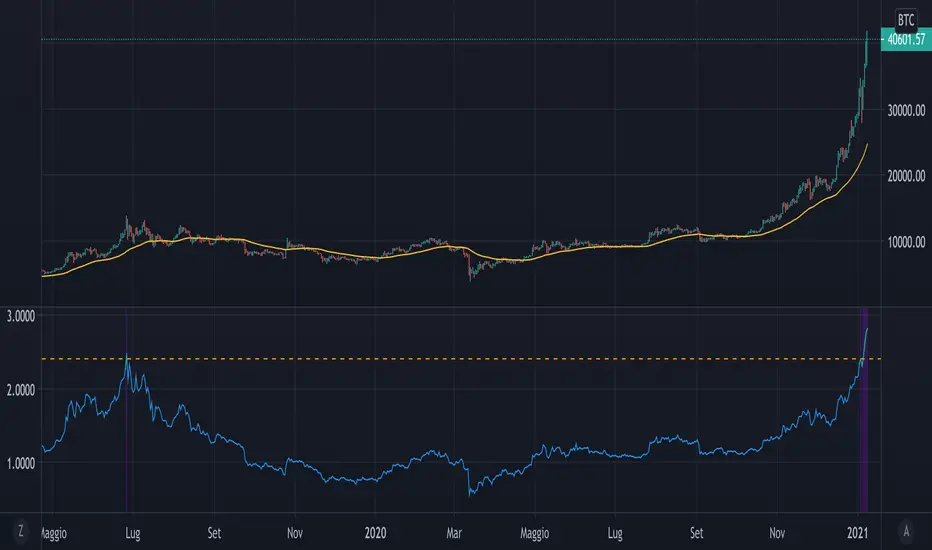
Mayer MultipleThe script implements a custom version of the Mayer multiple and it may be useful for analyzing the price of Bitcoin in a historical context.
Note n.1: Mayer multiple does not tell whether to buy, sell or hold, but highlights the best long-term area when the bitcoin price is below a threshold value (2.4).
Note n.2: the threshold value (2.4) has been determined in the past by simulations performed.
The script user may decide whether to use the shown graph or another graph for the calculation of the Mayer multiple.
The script is very easy to use and it is possible to change the following parameters:
the period of SMA (default value is 200)
the threshold (default value 2.4)
Show or not the sell area
Use or not the shown graph to calculate the Mayer multiple (default value is true)
name of exchange to use for calculation of the Mayer multiple (default value is BNC)
name of chart to use for calculation of the Mayer multiple (default value is BLX)
Indicator: Weight Of Middle [xQT5]This is my original indicator that was inspired by "Mayer Multiple" and "Chande Forecast Oscillator" (CFO).
I decided to search truth of trend power with SMA and LinReg and found it in a somewhere of the middle. Also, I added a limit area, where you need to keep a more attention, because it can show a potential reversal.
You can change parametrs with a your own look.
One more signal for indicator:
- If "WOM" is above "1" - it's a bullish direction;
- If "WOM" is below "1" - it's a bearish direction.
Enjoy it!

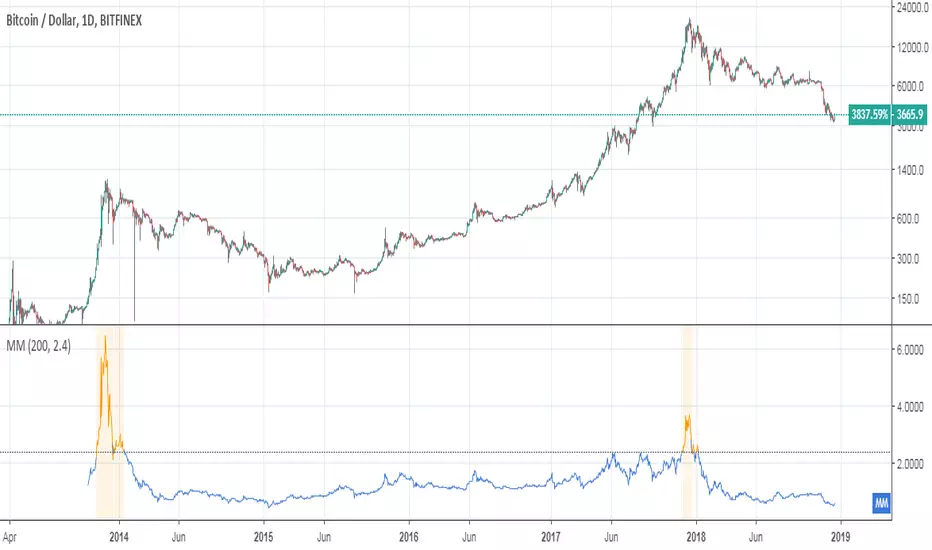
BTC Mayer Multiple BandsIntroduced by Trace Mayer as a way to gauge the current price of Bitcoin against its long range historical price movements (200 day moving average), the Mayer Multiple highlights when Bitcoin is overbought or oversold in the context of longer time frames.
It's worth noting that as the market becomes larger and less volatile, the peaks are becoming less exaggerated. This is because a 200 day moving average baseline is a static yardstick against an ever growing, more stable, Bitcoin market. We should recalibrate what constitutes the overbought/oversold extremes on this chart accordingly.
Idea by CryptoKea. Original author:

BEST Mayer MultipleHello traders
I'm not a HODLer by any means. I know when to sell (or I think I know....) when an asset starts going against me too much.
Even if it's a "long-term" investment.
My mentor used to telling me this: "If a short-term trade becomes a long-term investment, then you're in for a hell of a ride".
I have no clue if Bitcoin/BTC will go back up or not - I don't even care because I'm an intraday trader.
What if BTC was actually a way to accumulate more fiat? Satoshi fooled us
I coded this Mayer Multiple according to the specifications below. By the way, I'm a big fan of Willy Woo. I've been monitoring all his work since I learned about crypto (10 minutes ago.... it's a joke come on)
charts.woobull.com
Scaling
To respect the Mayer's multiple model, I recommend to select the Logarithmic scaling as shown below
imgur.com
What Mayer's model says
Using the reference below, the model says we're in the oversold zone. But, we can be in that zone for months/years...
When a model says an asset could bounce in a 1000-7000 USD range... well... I don't know how I would be able to perform optimally with that insight. This is very subjective and not a recommendation.
Mayer's Multiple model reference
All the BEST
Dave

Mayer Multiple [ChuckBanger]The Mayer Multiple is calculated by dividing the current price by 200-day moving average so you have to use daily charts fort it to work properly. This script is design to be a help for deciding when to buy Bitcoin and when it is time to sell your HODL position. This script uses moving average for optimal sell and buy points. In time of writing the average Mayer Multiple is 1.47 for the history of Bitcoin.

Mayer Multiple Optimal Multi-Color Histogram [aamonkey]Mayer Multiple developed by Trace Mayer gives the ratio of price to 200 daily moving average.
Buy when it's white sell when it's orange.
Is intended for use on day chart only.
This is an extension of the Mayer Multiple developed by Trace Mayer.
Normally you only have 2 thresholds signaling buying or selling (blue and yellow).
However, I added 2 more thresholds signaling optimized buys and sells (white and orange).

Mayer MultiplerThe ‘Mayer Multiple’ is one of the most popular metrics and derives from the current price divided by the 200-day moving average (200-MA). The average value is 1.39, and historically, when it becomes equal to or greater than 2.4 it will retrace to under 1.5.
Simulations performed by Trace Mayer determined that in the past, the best long-term results were achieved by accumulating Bitcoin whenever the Mayer Multiple was below 2.4.
Since the simulations were based on historical data, they are purely educational and should not be the basis of any financial decision.
Credit:
bitcoinist.com
mayermultiple.info

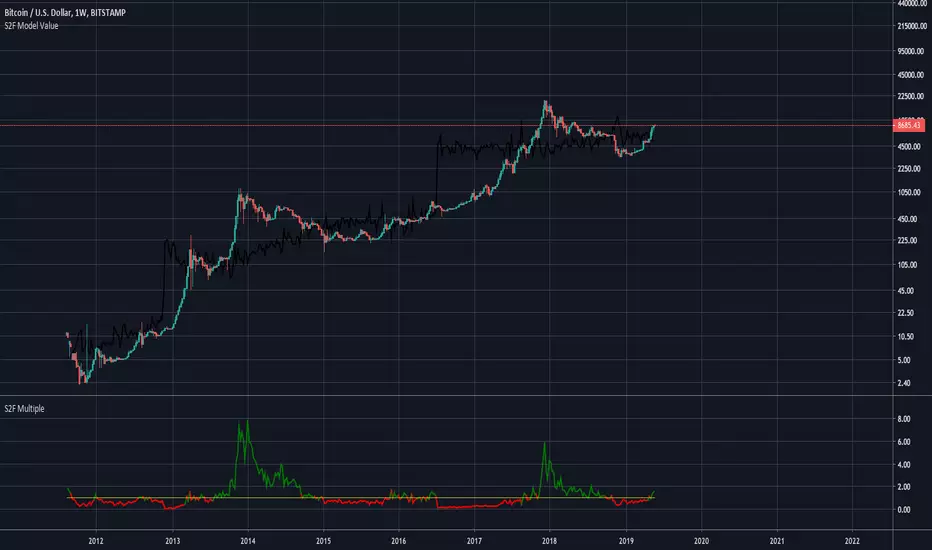
Bitcoin Stock To Flow Model Value (fixed)This indicator shows the Bitcoin value based on the Stock To Flow Model by planB
Fixed version of the original script by yomofoV:
Split up into 2 seperate indicators so you can put it into two seperate panes. This is the S2F Model Value.
You can find the S2F Multiple indicator here:
Bitcoin Stock to Flow Multiple (fixed)This is a fixed version of the original script by yomofoV:
I fixed the variable assignments and added switching of timeframes over indicator inputs.
To switch timeframes click on the indicator, open its settings and switch the timeframe to either monthly, weekly or daily.

Bitcoin Stock to Flow Multiplethis study plots the price of btc over the Stock to Flow Model value
idea credited to: 100trillionUSD
my data is a bit off compared to the original source but overall it seems correct

Major Mayer MultipleAdjusted version of the BTC Mayer Multiple developed by Trace Mayer www.theinvestorspodcast.com
This version includes two novelties. The first one replaces BTC with Total Market Cap from 2016/2017 (depending on your moving averages) to present and the second is that we consider two Moving Averages to produce more detailed lows.

Mayer MultipleThis indicator was created by Trace Mayer as a way to analyze the price of Bitcoin in a historical context. Consider it as a kind of Volatility Ratio that was created by Jack Schwager for the securities.
To learn more about Mayer Multiple see:
charts.woobull.com
mayermultiple.info
www.theinvestorspodcast.com
Good luck!
Mayer Multiple @ Current PriceThough this script is by me, the original idea comes from a podcast I heard where Trace Mayer talks about how he does crypto valuation. It is based on current price against the 200 day moving average. This indicator script will simply plot that value as a label overlayed on your trading view chart. Best long term results occur when acquiring BTC when the multiple is 2.4 or less. For more info, google "mayer multiple" This script/indicator is strictly for educational purposes. It is not exclusive to bitcoin.
To get the best look out of your charts I make the following changes.
1.Apply the indicator to your chart.
2. In the tools palette of trading view, when looking at a chart, click "Show Objects Tree" the icon displayed above the trash can.
In the objects tree panel, click the preferences icon for "Mayer Multiple @ Current Price"
Switch "scale" to "scale Left"
3. Then for your chart preferences (right click on chart background and select "Properties", and be sure the following are checked on the "Scales" tab
Left Axis
Right Axis
Indicator Last Value
Indicator Labels
Screenshots are not allowed in this view, so I can't post screenshots, but the view above is what it should look like when you are done.
For anyone who wants to see the code, here is the code of the script:
Use at will, and at your own risk.
//@version=3
// Created By Timothy Luce, inspired by Trace Mayer's 200 Day SMA cryptocurrency valuation method
study("Mayer Multiple @ Current Price", overlay=true)
currentPrice = close
currentDay = security(tickerid, "D", sma(close, 200))
mayerMultiple = currentPrice/currentDay
plot(mayerMultiple, color=#00ffaa, transp=100)
If you want to change the color, change this line: #00ffaa


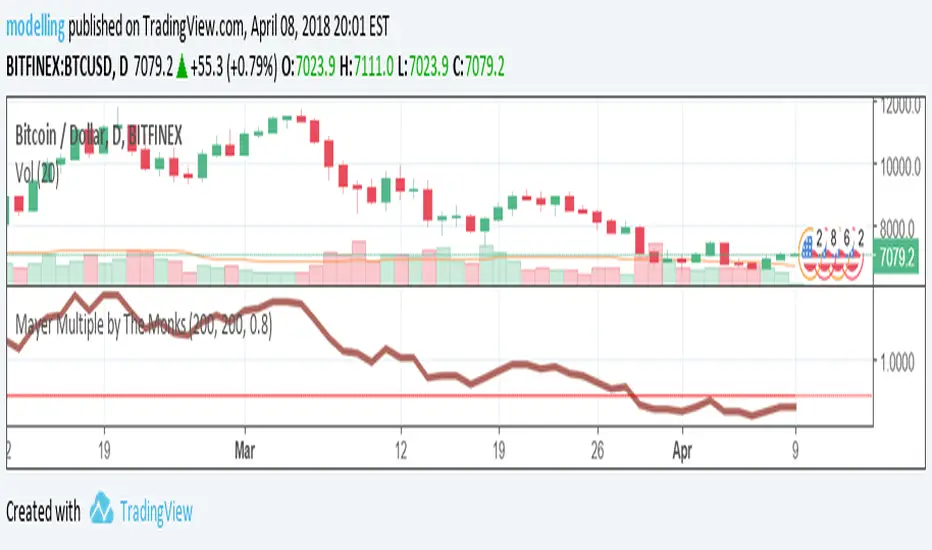
Conservative Mayer Multiple Indicator by The MonksConservative Mayer Multiple with less noise.
Sets the threshold at 0.80.
Mayer Multiple BandsSince there are not many scripts based on the Mayer Multiple, I figured I could add one to the collection. First I would like to give a shout out to Trace Mayer, Preston Pysh, and our fellow Tradingview user unbound, for their inspirational work.
The numbers used to make this script can be found in a number of locations, or you can just make them for yourself in Excel, which will give you a more current mean Mayer Multiple etcetera; however, the numbers I used for this particular script were found here: www.theinvestorspodcast.com
This script should only be used with daily candles.

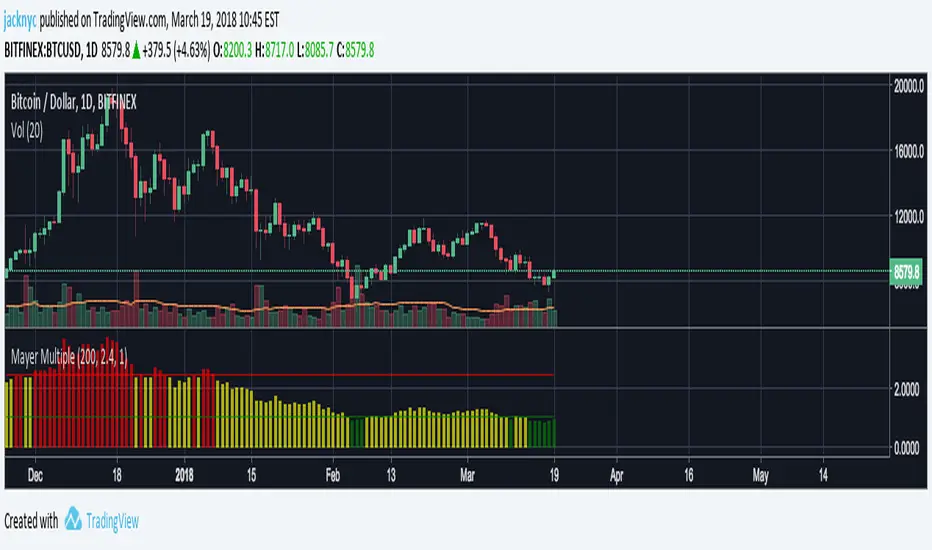
Mayer Multiple (with muti-color histogram)This is inspired by unbound's work on the Mayer Multiple script.
This script is designed to work with the daily chart.
I created this script so you can see the daily Mayer Multiple by just hovering over the bar in the histogram. I modified the color of the histogram bar to indicate the following:
Red = Over 2.4x Mayer Multiple, overvalued
Yellow = Between 1x to 2.4x Mayer Mutiple, fairly valued
Green = Under 1x Mayer Multiple, undervalued
This is my first script so let me know if there are any issues or suggestions on how to change it.
Quadruple Moving Averages Plus Smoothed Moving AveragePrincipal moving averages and an approximation the institutional (smoothed) moving average.