PROTECTED SOURCE SCRIPT
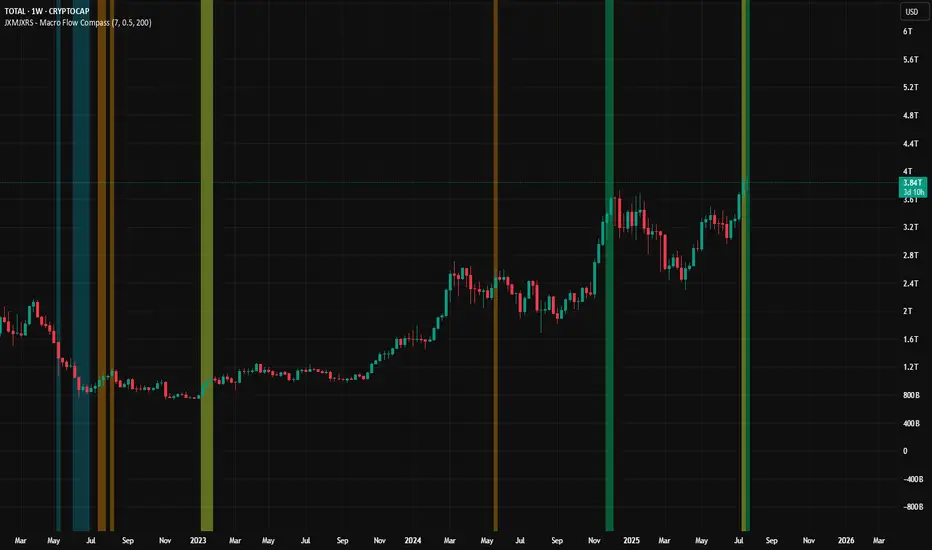
JXMJXRS - Macro Flow Compass

The Macro Flow Compass is designed to give a high-level view of market behaviour by tracking how capital is moving across the crypto ecosystem. It’s not an entry or exit tool. Instead, it helps identify when the overall environment is shifting, whether capital is favouring majors like BTC and ETH, rotating into altcoins, or moving into stables.
The goal is to keep you aligned with broader market cycles, so trades are taken with macro context in mind.
The script works by analyzing four key metrics:
Total crypto market cap (CRYPTOCAP:TOTAL)
Bitcoin dominance (CRYPTOCAP:BTC.D)
Ethereum dominance (CRYPTOCAP:ETH.D)
Combined stable coin dominance from USDT and USDC (CRYPTOCAP:USDT.D + USDC.D)
These are smoothed using a basic EMA (Exponential Moving Average) to reduce noise. The script then checks for changes in dominance and market cap slope to detect when capital is likely flowing into or out of specific sectors.
When certain conditions align, the script will shade the background with one of the following colours:
Green Panel – Risk-on behaviour in majors. Usually appears when total market cap is trending up and BTC dominance is dropping, or stable coin dominance is falling. It suggests BTC and ETH are likely receiving capital inflow, not necessarily pumping but positioned better for upside.
Orange Panel – Altcoin rotation. Happens when ETH dominance is rising or stables are pulling back, while the market cap is also rising. These tend to precede altcoin outperformance phases.
Blue Panel – Stable coin build-up. Signals increasing stable coin dominance. Often a defensive move, either after a drop or in anticipation of volatility. This can mean risk-off conditions.
The indicator uses three main settings:
Smoothing Length – Controls how reactive the EMAs are. Lower values react quicker to short-term changes; higher values will slow things down and highlight more persistent trends.
Dominance Flip Threshold (%) – Sets how much a dominance value must change in one bar to trigger a condition. It’s there to avoid reacting to tiny shifts that don’t really matter.
Macro Cap Slope Length – Determines how the macro market cap trend is calculated. It looks at the slope of a long-term regression to decide if we’re in an uptrend or downtrend.
This tool works on higher timeframes like the weekly or monthly, and it’s especially useful when combined with your own technical analysis.
Korumalı komut dosyası
Bu komut dosyası kapalı kaynak olarak yayınlanmaktadır. Ancak, ücretsiz ve herhangi bir sınırlama olmaksızın kullanabilirsiniz – daha fazla bilgiyi buradan edinebilirsiniz.
Feragatname
Bilgiler ve yayınlar, TradingView tarafından sağlanan veya onaylanan finansal, yatırım, alım satım veya diğer türden tavsiye veya öneriler anlamına gelmez ve teşkil etmez. Kullanım Koşulları bölümünde daha fazlasını okuyun.