OPEN-SOURCE SCRIPT
Indicator: Volatility Quality Index [VQI]
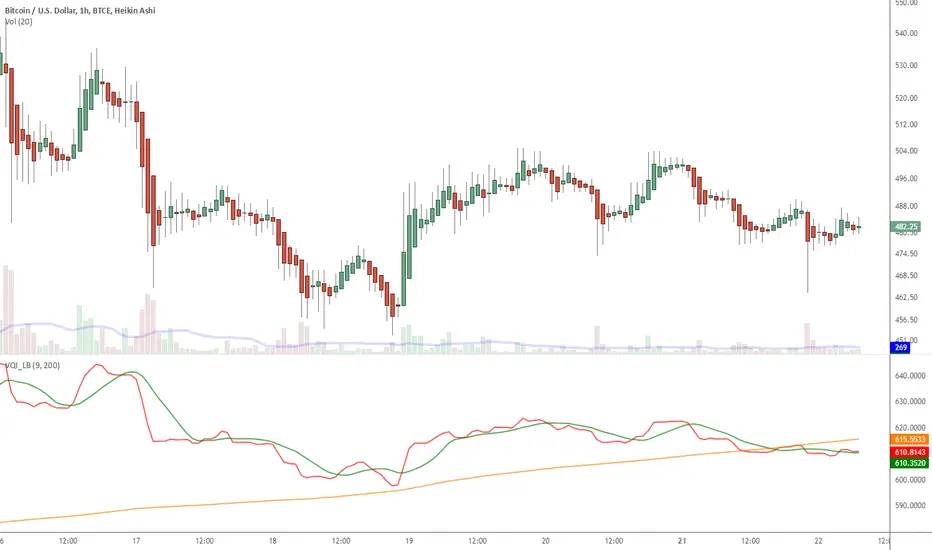
Volatility Quality Index (VQI), by Thomas Stridsman, points out the difference between bad and good volatility in order to identify better trade opportunities in the market.
This plots 3 lines:
- Red line is the VQI (actually, sum of VQI).
- Green line is the 9-period SMA of sum_of_VQI.
- Orange line is the 200-period SMA of sum_of_VQI.
Stridsman suggested to buy when VQI has increased in the previous 10 bars (use the SMAs) and sell when it has decreased in the previous 10 bars. IMO, use this with your other indicators as a confirmation signal.
More info: 3pips.com/volatility-quality-index-vq/
To use this indicator in your charts, click on "Share" button (top right on the chart). Click on "Make it mine" button on the dialog that pops up. Now, you will have a copy of this chart with the indicator's source code in it. Click on "{}" to open the source code of VQI_LB and save it to your custom scripts section.
Açık kaynak kodlu komut dosyası
Gerçek TradingView ruhuna uygun olarak, bu komut dosyasının oluşturucusu bunu açık kaynaklı hale getirmiştir, böylece yatırımcılar betiğin işlevselliğini inceleyip doğrulayabilir. Yazara saygı! Ücretsiz olarak kullanabilirsiniz, ancak kodu yeniden yayınlamanın Site Kurallarımıza tabi olduğunu unutmayın.
List of my free indicators: bit.ly/1LQaPK8
List of my indicators at Appstore: blog.tradingview.com/?p=970
List of my indicators at Appstore: blog.tradingview.com/?p=970
Feragatname
Bilgiler ve yayınlar, TradingView tarafından sağlanan veya onaylanan finansal, yatırım, işlem veya diğer türden tavsiye veya tavsiyeler anlamına gelmez ve teşkil etmez. Kullanım Şartları'nda daha fazlasını okuyun.