PROTECTED SOURCE SCRIPT
Volatility Barometer (VB)
Volatility Barometer (VB)
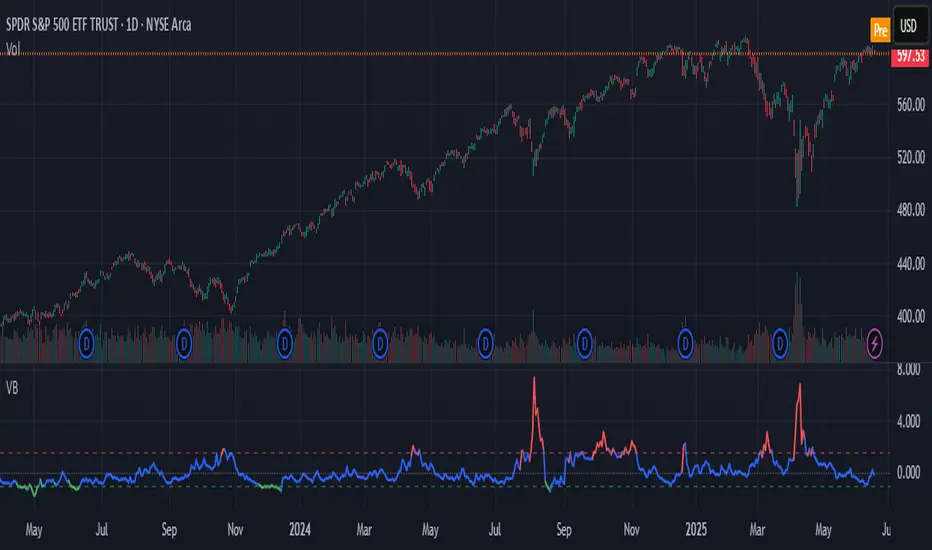
The Volatility Barometer (VB) is a comprehensive market sentiment indicator designed to measure aggregate stress and fear in the equity market. It consolidates three critical volatility metrics into a single, easy-to-interpret score, providing a broader view of market conditions than any single metric alone.
Core Components
The barometer synthesizes information from:
VIX Index (VIX): The standard measure of implied 30-day stock market volatility.
VVIX Index (VVIX): The volatility of the VIX itself, often seen as the "volatility of volatility." High VVIX readings can signal uncertainty about the VIX's future path.
VIX Futures Term Structure (VX1!−VX2!): The spread between the front-month and second-month VIX futures. A positive spread (contango) is typical, while a negative spread (backwardation) often signals imminent market stress.
How It Works
To create a unified view, the indicator normalizes each of these three components using a Z-score. The Z-score measures how many standard deviations a value is from its historical mean over a user-defined period (defaulting to 252 days, or one trading year).
These three standardized Z-scores are then combined into a final VB Score using a weighted average. Users can customize these weights in the indicator's settings to emphasize the components they find most important.
How to Interpret
The VB Score is plotted as a single line that oscillates around a zero level, with its color changing to reflect the prevailing market regime:
High Stress (Red Line): When the score rises above the "High stress threshold" (default: 1.5), it indicates heightened market fear and risk-off sentiment. This is a period of significant stress, often associated with market downturns.
Low Stress (Green Line): When the score falls below the "Low stress threshold" (default: -1.0), it signals complacency and low perceived risk in the market. Extreme low readings can sometimes precede volatility spikes.
Neutral (Blue Line): Scores between the high and low thresholds represent normal market conditions.
By providing a weighted, multi-faceted view of volatility, the Volatility Barometer helps traders and investors identify market regimes, confirm trading biases, and anticipate potential shifts in market sentiment.
Korumalı komut dosyası
Bu komut dosyası kapalı kaynak olarak yayınlanmaktadır. Ancak, ücretsiz ve herhangi bir sınırlama olmaksızın kullanabilirsiniz – daha fazla bilgiyi buradan edinebilirsiniz.
Feragatname
Bilgiler ve yayınlar, TradingView tarafından sağlanan veya onaylanan finansal, yatırım, alım satım veya diğer türden tavsiye veya öneriler anlamına gelmez ve teşkil etmez. Kullanım Koşulları bölümünde daha fazlasını okuyun.