OPEN-SOURCE SCRIPT
Güncellendi Strategy: Combo Z Score

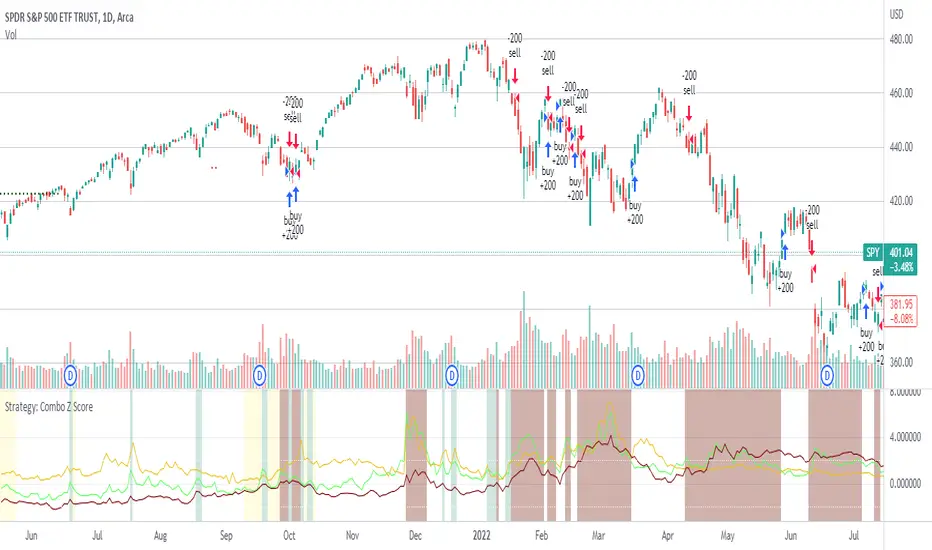
Strategy version of Combo Z Score
Objective:
Can we use both VIX and MOVE relationships to indicate movement in the SPY? VIX (forward contract on SPY options) correlations are quite common as forward indicators however MOVE (forward contract on bonds) also provides a slightly different level of insight
Using the Z-Score of VIX vs VVIX and MOVE vs inverted VIX (there is no M of Move so we use inverted Vix as a proxy) we get some helpful indications of potential future moves. Added %B to give us some exposure to momentum. Toggle VIX or MOVE.
If anyone has a better idea of inverted Vix to proxy forward interest in MOVE let me know.
Noticeable delta is that Vix only approach over the back test period is slightly better. Questions would be, what is the structure and nature of the market over the test period and in a bear market would MOVE or combined perform better.
Sürüm Notları
Added closing of trades ie when selling (shorting) close all long positions and vice versaSürüm Notları
Add capability to set your own start period. This will help if you want to test say a bullish market (2010 -> now) or expand to longer timeframes. Would it help to add an end date for those that want to choose specific date range?Sürüm Notları
Added option to apply an EMA on shorts ie only short if close is below ema. Ran this through Python with some different EMA values and 100 appears most reliable. CAUTION: Use normal candles not hiken ashi as you will get different results. Also, I ran this through a Python Backtester (Backtesting.py) and got woeful results so be cautious. Having said that I also ran it in 'dumb' mode essentially mimicing buy sell on long and short which was profitable with 100 lots (allowing for time to see event trigger and placing position the following day). Slippage and broker fees need to be considered as well. I also ran a model with OBV + OBV MA in Python and it under performed simple EMASürüm Notları
Added Oil over Oil Volatility as a selectable option. Oil by itself out performs as an indicator over long timeframes. I also ran this in a Python script I built to validate the return profile using CL=F (due to yfinance not having USOIL as a ticker). Excluding the EMA (which matters for this script) you get a return of 72.8 however note the volatility on the combined scenario. Essentially it validates the script will be profitable. Better than buy and hold? Not sure.Long Results for SPY going back to 0, Sample size: 24 trades
Batting Avg: 0.625
Gain/loss ratio: 2.8692089166896686
Average Gain: 4.184139196337219
Average Loss: -1.4582901830531891
Max Return: 11.456469648562306
Max Loss: -6.071636796151914
Total return over 24 trades: 60.26%
Short Results for SPY going back to 0, Sample size: 24 trades
Batting Avg: 0.75
Gain/loss ratio: 0.5881085471783537
Average Gain: 1.7299946052241066
Average Loss: -2.9416246601487614
Max Return: 6.139772751730832
Max Loss: -14.700454102882887
Total return over 24 trades: 12.54%
Combined L + S Results for SPY going back to 0, Sample size: 48 trades
Batting Avg: 1.375
Gain/loss ratio: 2.86920891668966860.5881085471783537
Average Gain: 5.914133801561326
Average Loss: -4.399914843201951
Max Return: 17.59624240029314
Max Loss: -20.7720908990348
Total return over 48 trades: 72.8%
Açık kaynak kodlu komut dosyası
Gerçek TradingView ruhuyla, bu komut dosyasının mimarı, yatırımcıların işlevselliğini inceleyip doğrulayabilmesi için onu açık kaynaklı hale getirdi. Yazarı tebrik ederiz! Ücretsiz olarak kullanabilseniz de, kodu yeniden yayınlamanın Topluluk Kurallarımıza tabi olduğunu unutmayın.
Feragatname
Bilgiler ve yayınlar, TradingView tarafından sağlanan veya onaylanan finansal, yatırım, alım satım veya diğer türden tavsiye veya öneriler anlamına gelmez ve teşkil etmez. Kullanım Koşulları bölümünde daha fazlasını okuyun.