Trading strategy Jesse LivermoreLong only trading strategies based on Jesse Livermore's trading philosophy
Forecasting

Nasdaq Market Direction ProbabilitiesA table in the bottom-left corner showing bullish, bearish, and neutral probabilities for Nasdaq market direction, calculated from weighted indicators (moving averages, RSI, volume trend, futures change, and sentiment).
A label on the chart with a recommendation ("Long", "Short", or "Monitor") based on the highest probability.
A histogram of the bullish probability in a separate pane.
The probabilities update on each confirmed bar, using the chart’s timeframe (ideally 60 minutes).

Scalp Trading Setup (EMA9/21 + VWAP + Stoch RSI)
On 1-minute, wait for candle confirmation and volume spikes to avoid false signals.
On 5-minute, this setup is most reliable for clean trend scalping (ideal entry alignment).
Use 15-minute for direction bias only, not for entry.

Checklist Dashboard Table# Checklist Dashboard Table – ICT/SMC Trading Helper
Overview
The “Checklist Dashboard Table” is a TradingView indicator designed to help traders structure, organize, and validate their market analyses following the ICT/SMC (Inner Circle Trader / Smart Money Concepts) methodology. It provides a visual and interactive checklist directly on your chart, ensuring you never miss a crucial step in your decision-making process.
Key Features
- Visual Checklist : All your trading criteria are displayed as color-coded checkboxes (green for validated, red for not validated), making your analysis process both clear and efficient.
- Clear Separation Between Analysis and Confirmations :
- Analysis : Reminders for your routine, such as timeframe selection (M3 to H4), trend analysis via RSI, and identification of key zones (Midnight Open, SSL/BSL, Asian High/Low).
- Confirmations : Six customizable criteria to check off as you validate your setup (clear trend, OB + FVG, OTE zone, Premium/Discount, R/R > 1:2, CBDR/Midnight).
- Personal Notes Section : Keep your trade entries, observations, or comments in a dedicated field in the indicator’s settings. Your notes are displayed right in the checklist for quick reference and journaling.
- Elegant and Compact Display : The table is styled for readability and can be positioned anywhere on your chart.
- Quick Customization : Instantly update any criterion or your personal notes via the script settings.
How to Use
1. Add the indicator to your chart.
2. Review the “Analysis” section as your pre-trade routine reminder.
3. Check off the “Confirmations” criteria as you validate your entry strategy.
4. Write your trade notes or comments in the provided notes section.
5. Use the checklist to reinforce discipline and repeatability in your trading.
Why Use This Checklist?
- Prevents you from skipping important steps in your analysis.
- Reinforces trading discipline and consistency.
- Allows you to document and review your trade decisions for ongoing improvement.
Who Is It For?
Perfect for ICT/SMC traders, but also valuable for anyone looking to organize and systematize their trading process.
Happy trading!

NVDA Put Exit Alerts - Enhanced How to Use on These Timeframes:
5-15 min chart:
Look for price rejections or bounces at the weekly/monthly VWAP.
Confirm with CMF above 0.1 (buy pressure) or below -0.1 (sell pressure).
30-min to 1-hour chart:
Use to identify broader intraday swing moves that align with macro VWAP levels.
CMF will act as a filter for volume divergence setups.

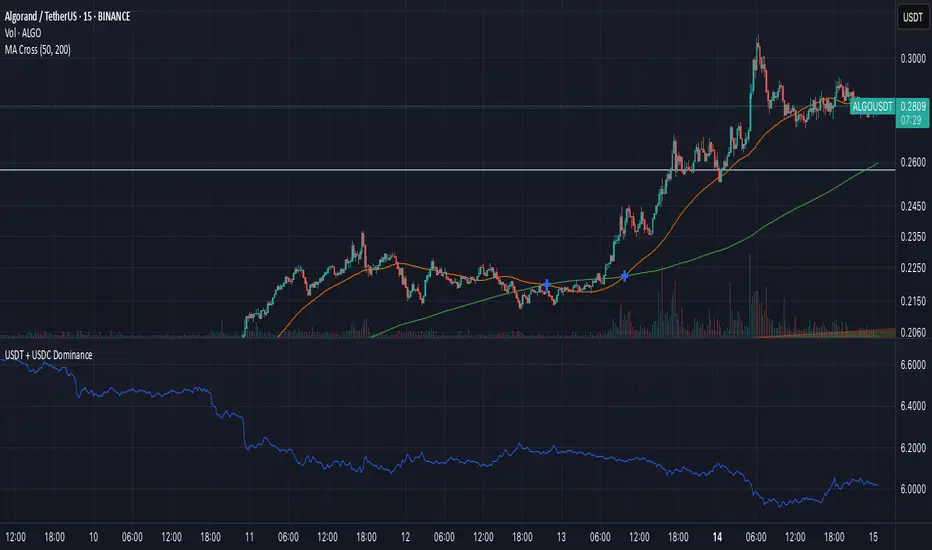
USDT + USDC DominanceUSDT and USDC Dominance: This refers to the combined market capitalization of Tether (USDT) and USD Coin (USDC) as a percentage of the total cryptocurrency market capitalization. It measures the proportion of the crypto market held by these stablecoins, which are pegged to the US dollar. High dominance indicates a "risk-off" sentiment, where investors hold stablecoins for safety during market uncertainty. A drop in dominance suggests capital is flowing into riskier assets like altcoins, often signaling a bullish market or the start of an "alt season."

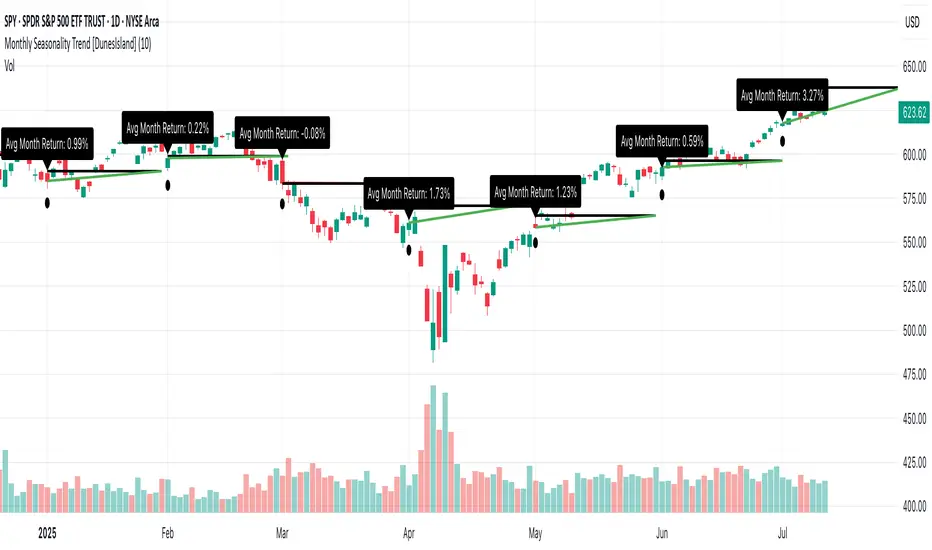
Monthly Seasonality Trend [DunesIsland]The Monthly Seasonality Trend is a indicator designed to analyze and visualize historical monthly seasonality patterns in financial markets. By calculating the average monthly return over a user-configurable lookback period (1 to 10 years), this indicator provides traders and investors with a clear projection of potential price movements for the current month, enabling data-driven decision-making.
How It Works
The indicator operates by retrieving monthly open and close prices for the specified lookback period (up to 10 years) and computing the average percentage return for the current month based on historical data. Key functionalities include:
Dynamic Trend Line: On the first trading day of each month, the indicator plots a line projecting the expected price trajectory, starting from the current close price and extending to the estimated end-of-month price based on the average historical return. The line is colored green for anticipated price increases or red for expected declines, offering an intuitive visual cue.
Average Return Label: A label is displayed at the start of each month, detailing the calculated average historical return for that month, expressed as a percentage, to provide context for the projected trend.
First Trading Day Marker: A small circle is plotted below the bar on the first trading day of each month, clearly marking the start of the projection period.
Adaptive Bar Counting: The indicator dynamically adjusts the length of the trend line based on the actual number of trading days in the previous month, ensuring accurate projections.
How to Interpret
Bullish Projection (Green Line): Indicates that historical data suggests an average price increase for the current month, potentially signaling buying opportunities.
Bearish Projection (Red Line): Suggests an average price decline based on historical trends, which may prompt caution or short-selling strategies.
Historical Context: The average return label provides a quantitative measure of past performance, helping traders assess the reliability of the projected trend.
Trend+Volume Divergence + Order Block Detector
The best in TF 5M
The script combines an order block detector (inspired by LuxAlgo) with a trend and volume divergence entry system.
The first part identifies both bullish and bearish order blocks based on volume pivots. These are typically zones where price has shown a high probability of reversal or strong reaction.
The order block algorithm uses recent volume pivots to detect likely institutional trading zones, marking them with colored boxes (green for bullish, red for bearish).
Bullish order blocks form when the price shows a volume-based pivot to the downside, suggesting possible accumulation at support.
Bearish order blocks appear at volume pivots to the upside, indicating likely distribution or resistance.
The script removes (“mitigates”) these order blocks when price action confirms that the zone is no longer respected.
Average (midpoint) order block levels are drawn as dashed or dotted lines based on your settings for visualization.
Whenever a new order block forms or is mitigated, alert conditions can be triggered.
The trend entry system computes and plots an Exponential Moving Average (EMA, default length 21) on the chart for basic trend detection.
A trend shift is detected when price crosses the EMA (from below is bullish, from above is bearish).
Additional confirmation for trade entries is provided by simple volume divergence logic:
Bullish if price is down but current volume exceeds prior volume.
Bearish if price is up but current volume is lower than the previous bar.
Large BUY (aqua up-triangle) and SELL (fuchsia down-triangle) arrows mark optimal entry points where both trend change and volume divergence are detected together.
Smaller triangles (‘Buy?’ or ‘Sell?’) are plotted where only a trend crossover is detected without supporting volume divergence.
The background color of the chart changes according to trend direction: green when price is above the EMA, red when below.
All major signals (order blocks and entry conditions) can generate alerts for automated or manual trade notifications.
The script is fully configurable via input parameters for block length, visualization style, EMA length, and mitigation settings.
The logic is suitable for scalping and short-term trading, especially on assets like gold (XAUUSD), but can be applied to any instrument or timeframe.
The script relies solely on built-in Pine functions and does not require external libraries or premium data.
The marked order blocks visually help traders identify zones with high probability of rejection or breakout.
By combining institutional-level order flows (via order block logic) with individual supply-demand signals (trend and volume divergence), the script aims to give robust entry ideas with clear visual cues on the chart.

Optimal Trend Change & Volume Divergence Entries
This TradingView Pine Script combines two technical analysis elements: trend change detection via EMA and volume divergence. The core of the script is the Exponential Moving Average (EMA) with a length of 21, which is plotted on the price chart. When the closing price crosses above the EMA21, a possible bullish trend change is identified. Conversely, when the closing price crosses below the EMA21, a bearish trend change is signaled. To avoid false entries, the script introduces a candlestick confirmation, requiring a green candle for bullish signals and a red one for bearish signals.
Volume divergence is integrated to provide additional context to the trend change. Bullish volume divergence occurs when the price registers a lower close than the previous bar, but the volume increases, suggesting waning selling pressure and a potential reversal. Bearish volume divergence is recognized when the price closes higher than the previous bar, but the volume declines, indicating possible exhaustion of buying strength. Only when both a trend change and the appropriate volume divergence signal occur on the same candle is a main entry generated.
The script visualizes these optimal buy entries with a large aqua upward arrow and optimal sell entries with a large fuchsia downward arrow. These arrows make it easy for traders to spot high-probability setups on the chart. When only a trend change is detected without volume divergence, the script plots smaller green or red arrows as additional context but marks them as less optimal entries.
The background color of the chart subtly changes to green for trending up and red for trending down, which helps the user quickly assess the prevailing market bias. Alerts can be set for the optimal entries, so traders do not need to monitor the chart constantly. The volume divergence logic in this version is kept classic and straightforward for reliability and speed. This approach looks for immediate (bar-to-bar) divergences instead of more complex, multi-bar patterns.
By requiring both a trend change and volume divergence, the script aims to reduce false signals and highlight stronger opportunities. The EMA21 offers a dynamic support/resistance level, enhancing decision-making for both scalpers and short-term traders. Volume divergence confirms whether a trend change is likely genuine or just a pullback.
Even in ranging conditions, the extra confirmation of volume trends helps filter out mediocre trades. With easily customizable inputs such as EMA length, traders can adapt the script to different instruments and timeframes. Placing visual markers and background changes directly on the price chart aids fast, intuitive trading decisions.
The script is lightweight and runs smoothly on most TradingView accounts. The customizable alerts give traders flexibility in their strategy execution. Advanced users can extend the script with more complex divergence conditions if needed. Overall, this script helps traders to identify and act on high-probability trend reversal setups, especially valuable for gold (XAUUSD) scalping.

Gold SCALP XAUUSD (SMA200/PSAR/ADX/ATR/Arrows)
This script is a custom scalping indicator designed for XAUUSD (gold) trading, suitable for low timeframes such as 1-minute or 5-minute charts.
It combines several proven technical analysis tools: the 200-period Simple Moving Average (SMA), Parabolic SAR (PSAR), Average Directional Index (ADX), and Average True Range (ATR).
The script first calculates the 200-period SMA to determine the overall market trend – above the SMA is bullish, below is bearish.
The PSAR indicator is included to pinpoint short-term reversal points and precise breakout moments.
ADX is calculated manually within the script to measure the strength of the prevailing trend; only strong trends trigger signals.
ATR is used to dynamically set take-profit and stop-loss levels, adapting to current volatility.
A buy signal is generated when the close price crosses above the PSAR, price is above the 200 SMA (bullish environment), and ADX indicates a strong trend above the threshold.
A sell signal appears when the close crosses below the PSAR, price is below SMA 200, and ADX confirms a strong bearish trend.
Arrows are plotted on the chart for every valid buy or sell signal, making trade entries visually clear.
Take-profit and stop-loss levels are plotted as crosses above or below the entry, calculated as multiples of ATR.
The background color subtly changes to green or red, indicating whether the market is bullish or bearish per trend filter.
Users can quickly evaluate trend conditions and momentum at a glance using these color cues.
Parameters for SMA, PSAR, ADX, ATR, and profit/stop levels can be manually adjusted to fit the user’s risk and trading style.
ADX and DI (Directional Indicators) are calculated from price action, not with a built-in, and the code follows the standard ADX mathematical formula.
Signals appear only when the trend is strong, avoiding sideways or choppy movements and helping filter out false positives.
The script does not open or close trades automatically; it is strictly an informational and visual trading tool.
All the plots, shapes, and backgrounds are intended to increase clarity and make decision-making quick during scalping.
The code is written in Pine Script v5, fully compatible with TradingView charts.
It is especially useful for traders looking to capture quick moves but needing strict technical filtering for their scalping approach.
Combining dynamic and static volatility, directional, and trend-following tools helps maximize probability and reduce whipsaw trades.
The modular design enables further customization, such as adding more timeframes or integrating with alerts, based on user preference.

Point CounterPoint counting based on current or specific bar and designated target. When multiple target are required, this makes everyone's life easier.

2Saucy custom MA'sEMA's 9/21/50/200 - Designated for "scalping" 1m/3m/5m/15/1h/4h. Works best as it EMA's move faster with price.
SMA's 10/20/50/200 - Works more for swing trading and/or finding setups on weekly and daily time frames.
By combining these two simultaneously trading intra-day is made much simpler.
Yours truly,
#2Saucy

Institutional Sweep Zone (Range-Based)Institutional Sweep Zone (Range-Based)
This indicator models potential stop sweep zones based on institutional capital ranges, helping traders visualize where high-probability liquidity grabs are likely to occur.
Unlike traditional volatility bands, this tool estimates price movement by calculating how far a specific amount of capital—entered into the market—can push price. By defining a lower and upper capital range (in millions of USD), the indicator dynamically draws bands representing the distance institutions could realistically move price in either direction.
It supports directional control, allowing you to focus on long sweeps, short sweeps, or both simultaneously. The pip cost is auto-calibrated based on the selected currency pair, making it highly adaptive to major FX pairs.
Key Features:
-Capital input range (in millions of USD)
-Directional sweep targeting: Long, Short, or Both
-Auto-detection of pip value based on FX pair
-Visual sweep zone mapped above and below current price
-Designed to highlight areas of institutional stop hunts
Why use it?
-Helps avoid setting stops inside common sweep zones
-Improves trade survivability when paired with higher timeframe strategies
-Offers a unique way to view price through an institutional lens
Created by: The_Forex_Steward
Explore more advanced tools and concepts on my TradingView profile.


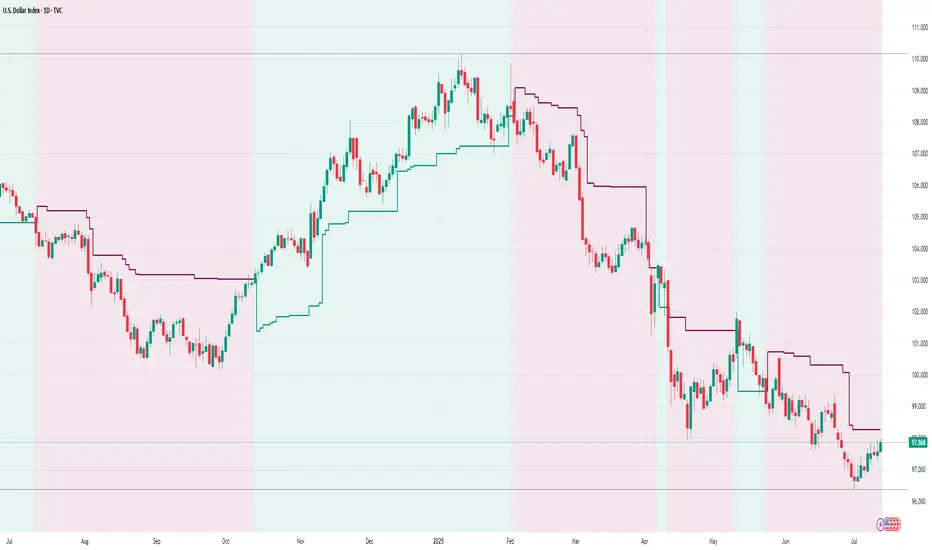
Golden Ratio Trend Persistence [EWT]Golden Ratio Trend Persistence
~~~~~~~~~~~~~~~~~~~~~~~~~~~~~~~~~~~~~~~~~~~~
Overview
The Golden Ratio Trend Persistence is a dynamic tool designed to identify the strength and persistence of market trends. It operates on a simple yet powerful premise: a trend is likely to continue as long as it doesn't retrace beyond the key Fibonacci golden ratio of 61.8%.
This indicator automatically identifies the most significant swing high or low and plots a single, dynamic line representing the 61.8% retracement level of the current move. This line acts as a "line in the sand" for the prevailing trend. The background color also changes to provide an immediate visual cue of the current market direction.
~~~~~~~~~~~~~~~~~~~~~~~~~~~~~~~~~~~~~~~~~~~~
The Power of the Golden Ratio (61.8%)
The golden ratio (ϕ≈1.618) and its inverse (0.618, or 61.8%) are fundamental mathematical constants that appear throughout nature, art, and science, often representing harmony and structure. In financial markets, this ratio is a cornerstone of Fibonacci analysis and is considered one of the most critical levels for price retracements.
Market movements are not linear; they progress in waves of impulse and correction. The 61.8% level often acts as the ultimate point of support or resistance. A trend that can hold this level demonstrates underlying strength and is likely to persist. A breach of this level, however, suggests a fundamental shift in market sentiment and a potential reversal.
~~~~~~~~~~~~~~~~~~~~~~~~~~~~~~~~~~~~~~~~~~~~
How to Use This Indicator
This indicator is designed for clarity and ease of use.
Identifying the Trend : The visual cues make the current trend instantly recognizable.
A teal line with a teal background signifies a bullish trend. The line acts as dynamic support.
A maroon line with a maroon background signifies a bearish trend. The line acts as dynamic resistance.
Confirming Trend Persistence : As long as the price respects the plotted level, the trend is considered intact.
In an uptrend, prices should remain above the teal line. The indicator will automatically adjust its anchor to new, higher lows, causing the support line to trail the price.
In a downtrend, prices should remain below the maroon line.
Spotting Trend Reversals : The primary signal is a trend reversal, which occurs when the price closes decisively beyond the plotted level.
Potential Sell Signal : When the price closes below the teal support line, it indicates that buying pressure has failed, and the uptrend is likely over.
Potential Buy Signal : When the price closes above the maroon resistance line, it indicates that selling pressure has subsided, and a new uptrend may be starting.
Think of this tool as an intelligent, adaptive trailing stop that is based on market structure and the time-tested principles of Fibonacci analysis.
~~~~~~~~~~~~~~~~~~~~~~~~~~~~~~~~~~~~~~~~~~~~
Input Parameters
You can customize the indicator's sensitivity through the following inputs in the settings menu:
Pivot Lookback Left : This number defines how many bars to the left of a candle must be lower (for a pivot high) or higher (for a pivot low) to identify a potential swing point. A higher value will result in fewer, but more significant, pivots being detected.
Pivot Lookback Right : This defines the number of bars that must close to the right before a swing point is confirmed. This parameter prevents the indicator from repainting. A higher value increases confirmation strength but also adds a slight lag.
Fibonacci Ratio : While the default is the golden ratio (0.618), you can adjust this to other key Fibonacci levels, such as 0.5 (50%) or 0.382 (38.2%), to test for different levels of trend persistence.
Adjusting these parameters allows you to fine-tune the indicator for different assets, timeframes, and trading styles, from short-term scalping to long-term trend following.
Quantum Harmonic Oscillator Overlay🧪 Quantum Harmonic Oscillator Overlay
A visual model of price behavior using quantum harmonic oscillation principles
📜 Indicator Overview
The Quantum Harmonic Oscillator Overlay applies concepts from both classical physics (harmonic motion) and quantum mechanics (energy states) to model and visualize how price orbits around a central trend line. It overlays a Linear Regression line (representing the “mean position” or ground state of price) and calculates surrounding energy levels (σ-zones) akin to quantum shells that price can "jump" between.
This indicator is particularly useful for visualizing mean reversion, volatility compression/expansion, and momentum-driven price breakthroughs.
🧠 Core Concepts
Linear Regression Line (LSR): This is the calculated center of gravity or equilibrium path of price over a user-defined period. Think of it like the lowest energy state or central axis around which price vibrates.
Standard Deviation Zones (σ-levels):
1σ: The majority of normal price activity; within this range, price tends to fluctuate if in balance.
2σ: Indicates volatility or possible breakout pressure.
3σ: Represents extreme movement — a phase shift in energy, potentially leading to reversal or continuation with higher momentum.
Quantum Analogy: Just like in a quantum harmonic oscillator, particles (here, prices) move probabilistically between discrete energy states. The further the price moves from the center, the more "energy" (momentum, volume, volatility) is implied.
⚙️ Input Parameters
Setting Description
Linear Regression Length The number of bars used to calculate the regression trend (default 100). Affects the central path and responsiveness.
σ Multipliers (1σ, 2σ, 3σ) Determine how far each band is from the regression line. Adjusting these can highlight different price behaviors.
Show Energy Level Zones Toggle visibility of the colored bands around the regression line.
Show LSR Center Line Toggles visibility of the white Linear Regression line itself.
🎨 Visual Components
Color Zone Interpretation
✅ Green ±1σ Normal oscillation / mean reversion area. Ideal for range-bound strategies.
🟧 Orange ±2σ Warning zone; price may be gaining momentum or volatility.
🔴 Red ±3σ High-momentum state or anomaly. These regions may imply trend exhaustion, reversals, or breakouts.
White Line: The LSR — the average trajectory of the price movement.
Pink Dots: Appear when price exceeds Zone 3 (outside ±3σ) — a signal of extreme behavior or a possible regime shift.
📈 How to Use This Indicator
1. Detect Overextensions
When price touches or breaches the 3σ zone, it is likely overextended. This can be used to anticipate potential snapbacks or strong breakout trends.
2. Identify Mean Reversion Trades
If price exits the 2σ or 3σ zones and returns toward the center line, this signals a likely mean reversion setup.
3. Volatility Compression or Expansion
Flat zones between σ levels suggest calm markets; widening bands suggest expanding volatility.
4. Use with Confirmation Tools
Combine with momentum oscillators (MACD, RSI) or volume-based signals to confirm reversals or continuation outside Zone 3.
🔮 Philosophical Note
This indicator embodies the metaphor that the market behaves like a quantum oscillator — price particles exist in a probabilistic field and jump between discrete zones of volatility and energy. Tracking these transitions allows the trader to see price behavior as rhythmic, wave-like, and multidimensional rather than purely linear.

Tiny Candle + High Volume DetectorTiny Candle + High Volume Detector
This simple indicator highlights candles with:
A very small body (user-defined % of the close)
A significant volume spike (volume > X times average)
📊 Use this to spot:
Compression zones before breakout
Smart money absorption
Hidden accumulation
⚙️ Adjustable Parameters:
Max Body Size (% of close)
Volume Spike Multiplier
Volume SMA Period
🔔 Alerts are included.
Works on all timeframes and instruments. Best used in trending or consolidating environments to detect buildup before expansion.

Futures Support & Resistance LevelsMulti-Timeframe Support & Resistance Levels for Futures Trading
Description:
This indicator automatically identifies and displays key support and resistance levels using multiple technical analysis methods. Designed specifically for futures traders (ES, NQ, etc.), it provides a clean, organized view of important price levels.
Key Features:
Multiple Detection Methods: Combines pivot points, daily ranges, and psychological levels
Smart Ranking System: Levels are numbered by strength (1 = strongest)
Clean Visualization: Extended lines across the chart with clear price labels
Confluence Detection: Highlights areas where multiple levels converge
Customizable Display: Adjust colors, line styles, and label sizes
Level Types Identified:
Daily High/Low (current session)
Previous Daily High/Low
Pivot-based Support/Resistance
Psychological Round Numbers
Confluence Zones (multiple levels clustering)
Technical Approach:
The indicator uses a strength-scoring algorithm to rank levels by importance. Daily levels receive the highest weighting (2.0), followed by previous daily levels (1.5), pivot points (1.0), and psychological levels (0.5). This helps traders focus on the most significant levels.
Visual Elements:
Solid lines = Strong levels
Dashed lines = Medium levels
Dotted lines = Weak levels
Optional technical condition markers for educational analysis
Best Used For:
Identifying key intraday levels for futures trading
Finding high-probability reversal zones
Setting logical stop-loss and take-profit levels
Recognizing confluence areas for stronger setups
Note:
This is a technical analysis tool for educational purposes. No indicator can predict future price movements. Always use proper risk management and combine with other forms of analysis.

EdgeXplorer - Sessions Roulette 🕰️ EdgeXplorer – Sessions Roulette
⸻
🔍 What This Indicator Does
Sessions Roulette is a highly customizable tool that visualizes the four primary global trading sessions — New York, London, Tokyo, and Sydney — directly on your chart.
It not only highlights each session’s time window with color-coded boxes, but also tracks key session-level data like:
• Highs and lows
• Average (mean) price
• (Optional) VWAP line (toggle included for future use)
This tool is purpose-built for traders who rely on time-based volatility patterns, session transitions, and liquidity windows.
⸻
⚙️ How It Works (Technical Breakdown in Plain English)
This indicator checks — for each trading session — whether the current bar falls within the defined session time range. If it does:
1. A colored box is drawn from session open to close
2. High/Low levels for that session are tracked dynamically
3. The session’s mean price is calculated incrementally as new bars come in
4. Session labels are rendered as text (optional)
5. Once the session ends, the data locks and resets on the next session start
The timezone can be defined manually via UTC offset or aligned with the chart’s exchange timezone using a toggle.
⸻
📈 Visual Components Explained
Each session (NY, LDN, TYO, SYD) has its own:
• Colored Box Range: This fills the background of the session with a semi-transparent box.
• Session Label: A tag that names the session.
• Mean Line: Tracks average price during the session (toggle).
• High/Low Plots: Draw horizontal lines showing session high and low prices (toggle).
• VWAP Line: Placeholder toggle exists — functionality is not yet implemented.
• Box Outline: Optional stroke around each session box.
⸻
📊 Input Settings & Customization
🔧 General Settings:
• Timezone Offset (UTC ±): Manually adjust sessions to your preferred UTC offset.
• Use Chart Exchange Timezone: Toggle to override the offset and align sessions to the chart’s market timezone.
🎯 Per-Session Settings:
For each of the four sessions, you can configure:
Option Description
Enable Session Toggles the session on or off
Session Label Custom text for labeling
Time Window Start and end time for session
Color Box and line color
Highlight Range Whether to draw the background box
Trend Line (Reserved for future)
Average Line Shows running mean of price during session
VWAP Line (Toggle available; VWAP logic not yet implemented)
High/Low Lines Horizontal lines at the session high/low
🧪 Display Options:
• Range Fill Opacity: Controls transparency of the session box.
• Draw Range Outline: Adds a border to the session box.
• Session Label: Toggles visibility of the session name label.
⸻
🧠 How Traders Can Interpret It
Session tools are most powerful when:
• You trade session-to-session behaviors (e.g., NY open reaction to LDN range)
• You study liquidity zones or order flow around session highs/lows
• You want to anchor technical setups to session timing
• You analyze volatility compression/expansion across global markets
Each session often brings different behaviors:
Session Use Insight
Tokyo Often range-bound, ideal for pre-positioning
London Brings first significant volatility
New York Tends to expand volatility or reverse trends
Sydney Quietest — good for range analysis or preparing for Asia open
⸻
🧪 Use Cases & Strategy Integration
• Breakout Traders: Set alerts when price breaks previous session highs/lows.
• Scalpers: Time entries based on opening ranges.
• Algo Developers: Use plotted session bounds as logic for entry/exit filters.
• Liquidity Tracking: Identify common sweep behavior before/after session shifts.

Mongoose Capital: BTC ETF DriftScope ProMongoose Capital: BTC ETF DriftScope Pro
A proprietary indicator for monitoring drift between Bitcoin Spot (BTCUSD) and Bitcoin Spot ETFs (such as IBIT). Designed to detect ETF premium/discount zones and generate actionable Fade or Long bias signals.
What it Does
Tracks IBIT and BTCUSD spread to highlight ETF price deviations.
Calculates correlation Z-Score for ETF/Spot alignment.
Outputs numeric bias signals: Fade (1), Long (1), Neutral (1).
How to Use
Apply to a BTCUSD chart (4H, 1D, or higher recommended).
Open the Data Window to view:
IBIT Spread %
Correlation Z-Score
Correlation %
Bias Flags (Fade, Long, Neutral)
Configure alerts for Fade and Long Bias conditions.
Confirm all signals with your trade plan and risk management.
Methodology
This tool calculates the percentage spread between IBIT and BTC Spot. A rolling Z-Score of the correlation is used to detect periods of significant divergence.
Fade Bias suggests potential short setups in premium zones with high Z-Scores.
Long Bias suggests potential long setups in discount zones with low Z-Scores.
Disclaimer
This indicator is for educational purposes only. It is not financial advice. Use at your own risk and verify signals independently.

Universal Trade Levels & Signal Classifierscript has been enhanced and generalized for all instruments — not just ES or SPX.
You now get the following classifications:
💎 Perfect Trade – trend confirmed, strong signal, ATR + VWAP + volume aligned
🚀 Sure Shot Trade – very high volume + ATR breakout + directional bias
⚡ Quick Call/Put – fast actionable setups
❌ No Trade – avoid/no confirmation
The logic works across any timeframe and any ticker.
You can now test this live on any instrument in TradingView. Let me know if you’d like to add things like:
Multi-timeframe confirmation
Re-entry logic
Heatmap table of confidence levels
Signal filtering based on RSI, OBV, etc.

Profit Sniper RSI Based Buy/Sell📌 Profit Sniper RSI – Intelligent Buy/Sell Signals Based on Adaptive RSI Zones
Profit Sniper RSI is a precision-engineered indicator that generates high-confidence Buy and Sell signals by dynamically interpreting the Relative Strength Index (RSI) across five market zones. It is designed to reduce signal noise and avoid false breakouts using a combination of crossover logic, zone validation, and trend sentiment detection.
🔍 Underlying Concept:
This script divides the RSI into five structured zones:
- **0–24**: Power Sell (Extreme bearish momentum)
- **24–40**: Sell (Weak price action with downward pressure)
- **40–60**: Neutral/Consolidation (No clear trend)
- **60–76**: Buy (Bullish initiation zone)
- **76–100**: Power Buy (Strong bullish momentum)
Signals are generated **only after the RSI crosses a zone boundary** (e.g., from below 60 to above 60), and only **after the candle closes**, which helps filter out noise from intra-bar RSI fluctuations.
📈 Signal Logic:
- **Buy signals** are triggered when RSI crosses key thresholds (24, 40, or 60) upward, indicating rising strength.
- **Sell signals** are triggered when RSI crosses downward below 76, 60, or 40, suggesting trend weakness or reversal.
- **Power Buy and Power Sell signals** are reserved for extreme crossovers beyond 76 and below 24, respectively.
- The script avoids repeated signals (e.g., Buy after Buy) by tracking the last confirmed signal state.
🔧 Customization:
- Users can toggle visibility of Buy, Sell, Power Buy, and Power Sell signals independently.
- Adjustable RSI length input to fit different market conditions or timeframes.
- Displays a real-time info panel showing the current RSI, last signal type, the RSI level at the time of the last signal, and the price when the signal was triggered.
🧠 How It Helps Traders:
- Reduces false entries by only generating signals **after candle closure**.
- Designed to work across **any timeframe** and **any market** (Crypto, Forex, Stocks).
- Ideal for traders who rely on **RSI-based confirmation** before entry and prefer minimal visual clutter.
- Acts as a sniper tool — waiting for clear RSI structure and crossover before acting.
⚠️ Note:
This script does **not repaint**. All signals are based on closed-bar RSI logic. While no indicator guarantees profitability, this tool is built for serious traders who value disciplined entries backed by momentum structure.
💡 Tip: Combine Profit Sniper RSI with key support/resistance or trendline zones for added confluence and trade precision.
