OPEN-SOURCE SCRIPT
Volume (D)EMA
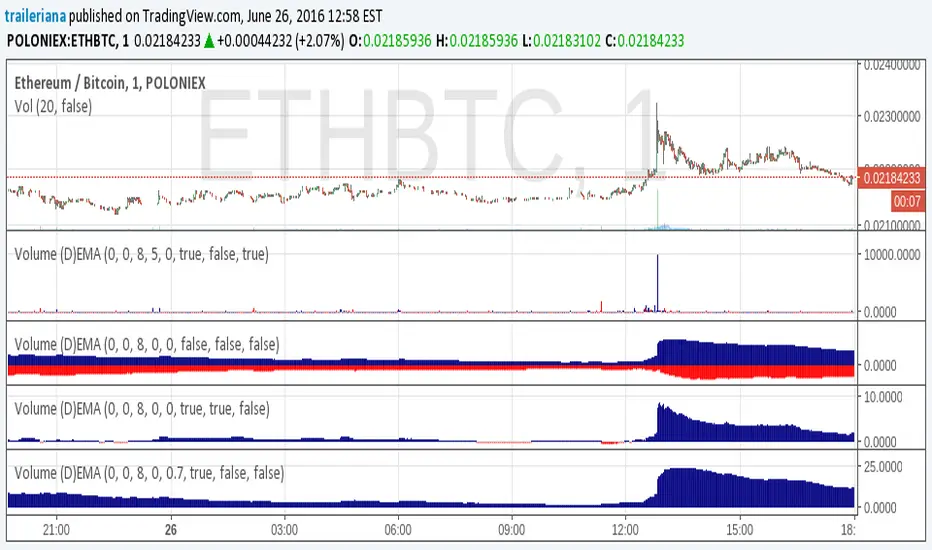
A simple yet configurable indicator that shows recent traffic volumes.
The time period is specified as weeks/days/hours/minutes, not as bars.
Set the volume period to non-zero if you want to use a generalized double EMA instead of plain.
The "ratio" option will show the size of the current volume compared to the average volume as computed for the specified time period; say hello to fat tails and goodby to "standard" and "normal" and "average". With the "together" option, it compares the current volume to the both sides together (buy+sell), otherwise it compares it to just its respective side.
Açık kaynak kodlu komut dosyası
Gerçek TradingView ruhuna uygun olarak, bu komut dosyasının oluşturucusu bunu açık kaynaklı hale getirmiştir, böylece yatırımcılar betiğin işlevselliğini inceleyip doğrulayabilir. Yazara saygı! Ücretsiz olarak kullanabilirsiniz, ancak kodu yeniden yayınlamanın Site Kurallarımıza tabi olduğunu unutmayın.
Feragatname
Bilgiler ve yayınlar, TradingView tarafından sağlanan veya onaylanan finansal, yatırım, işlem veya diğer türden tavsiye veya tavsiyeler anlamına gelmez ve teşkil etmez. Kullanım Şartları'nda daha fazlasını okuyun.