HG StdDevThe HG StdDev indicator provides a dynamic view of market volatility by calculating the standard deviation of a selected price source over a customizable period. Additionally, it plots a threshold line representing the highest standard deviation over a secondary lookback window.
Red Line: Current standard deviation (volatility) of the price.
Gray Line: Highest standard deviation value within the lookback range, serving as a reference for recent peak volatility.
Use this tool to identify periods of increasing or extreme volatility, potential breakout zones, or to filter signals based on volatility thresholds.
Stddev

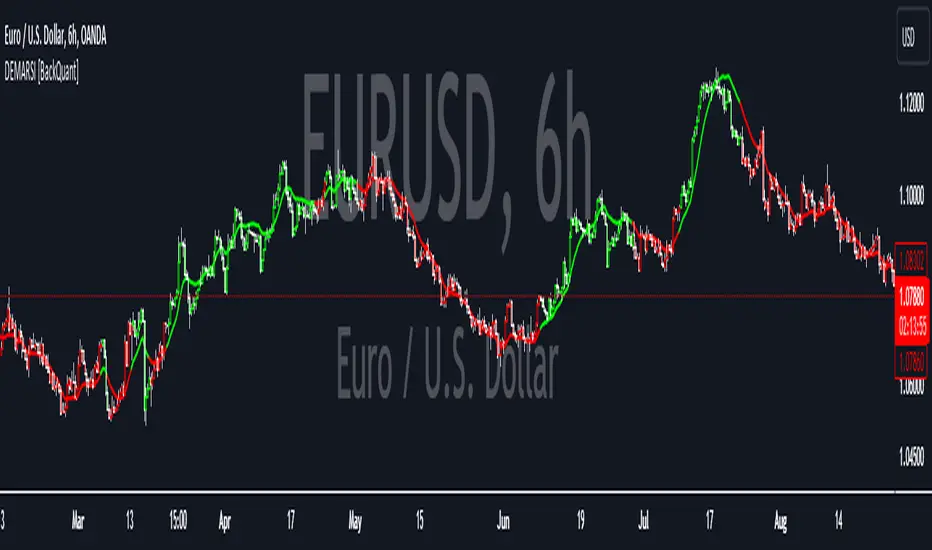
DEMA RSI Overlay [BackQuant]DEMA RSI Overlay
PLEASE Read the following, knowing what an indicator does at its core before adding it into a system is pivotal. The core concepts can allow you to include it in a logical and sound manner.
Anyways,
BackQuant's new trading indicator that blends the Double Exponential Moving Average (DEMA) with the Relative Strength Index (RSI) to create a unique overlay on the trading chart. This combination is not arbitrary; both the DEMA and RSI are revered for their distinct advantages in trading strategy development. Let's delve into the core components of this script, the rationale behind choosing DEMA and RSI, the logic of long and short signals, and its practical trading applications.
Understanding DEMA
DEMA is an enhanced version of the conventional exponential moving average that aims to reduce the lag inherent in traditional averages. It does this by applying more weight to recent prices. The reduction in lag makes DEMA an excellent tool for tracking price trends more closely. In the context of this script, DEMA serves as the foundation for the RSI calculation, offering a smoother and more responsive signal line that can provide clearer trend indications.
Why DEMA?
DEMA is chosen for its responsiveness to price changes. This characteristic is particularly beneficial in fast-moving markets where entering and exiting positions quickly is crucial. By using DEMA as the price source, the script ensures that the signals generated are timely and reflective of the current market conditions, reducing the risk of entering or exiting a trade based on outdated information.
Integrating RSI
The RSI, a momentum oscillator, measures the speed and change of price movements. It oscillates between zero and 100 and is typically used to identify overbought or oversold conditions. In this script, the RSI is calculated based on DEMA, which means it inherits the responsiveness of DEMA, allowing traders to spot potential reversals or continuation signals sooner.
Why RSI?
Incorporating RSI offers a measure of price momentum and market conditions relative to past performance. By setting thresholds for long (buy) and short (sell) signals, the script uses RSI to identify potential turning points in the market, providing traders with strategic entry and exit points.
Calculating Long and Short Signals
Long Signals : These are generated when the RSI of the DEMA crosses above the longThreshold (set at 70 by default) and the closing price is not above the upper volatility band. This suggests that the asset is gaining upward momentum while not being excessively overbought, presenting a potentially favorable buying opportunity.
Short Signals : Generated when the RSI of the DEMA falls below the shortThreshold (set at 55 by default). This indicates that the asset may be losing momentum or entering a downtrend, signaling a possible selling or shorting opportunity.
Logical Soundness
The logic of combining DEMA with RSI for generating trade signals is sound for several reasons:
Timeliness : The use of DEMA ensures that the price source for RSI calculation is up-to-date, making the momentum signals more relevant.
Balance : By setting distinct thresholds for long and short signals, the script balances sensitivity and specificity, aiming to minimize false signals while capturing genuine market movements.
Adaptability : The inclusion of user inputs for periods and thresholds allows traders to customize the indicator to fit various trading styles and timeframes.
Trading Use-Cases
This DEMA RSI Overlay indicator is versatile and can be applied across different markets and timeframes. Its primary use-cases include:
Trend Following: Traders can use it to identify the start of a new trend or the continuation of an existing trend.
Swing Trading: The indicator's sensitivity to price changes makes it ideal for swing traders looking to capitalize on short to medium-term price movements.
Risk Management: By providing clear long and short signals, it helps traders manage their positions more effectively, potentially reducing the risk of significant losses.
Final Note
We have also decided to add in the option of standard deviation bands, calculated on the DEMA, this can be used as a point of confluence rendering trading ranges. Expanding when volatility is high and compressing when it is low.
For example:
This provides the user with a 1, 2, 3 standard deviation band of the DEMA.
Thus following all of the key points here are some sample backtests on the 1D Chart
Disclaimer: Backtests are based off past results, and are not indicative of the future.
INDEX:BTCUSD
INDEX:ETHUSD
BINANCE:SOLUSD
dharmatech : Standard Deviation ChannelDESCRIPTION
Based on version by leojez.
Adds a 3rd standard deviation level.
Twice as fast as original version.
Refactored and simplified source code.
HOW TO USE
Load your chart
Adjust the timeframe and zoom of the chart so that the trend you're interested in is in view.
Add the indicator
Use the measuring tool to measure the number of bars from the start of the trend to the latest candle.
Open settings for the indicator.
Set the length value to the number of bars that you noted.

Opening Range Gap + Std Dev [starclique]The ICT Opening Range Gap is a concept taught by Inner Circle Trader and is discussed in the videos: 'One Trading Setup For Life' and 2023 ICT Mentorship - Opening Range Gap Repricing Macro
ORGs, or Opening Range Gaps, are gaps that form only on the Regular Trading Hours chart.
The Regular Trading Hours gap occurs between 16:15 PM - 9:29 AM EST (UTC-4)
These times are considered overnight trading, so it is useful to filter the PA (price action) formed there.
The RTH option is only available for futures contracts and continuous futures from CME Group.
To change your chart to RTH, first things first, make sure you’re looking at a futures contract for an asset class, then on the bottom right of your chart, you’ll see ETH (by default) - Click on that, and change it to RTH.
Now your charts are filtering the price action that happened overnight.
To draw out your gap, use the Close of the 4:14 PM candle and the open of the 9:30 AM candle.
How is this concept useful?
Well, It can be used in many ways.
---
How To Use The ORG
One of the ways you can use the opening range gap is simply as support and resistance
If we extend out the ORG from the example above, we can see that there is a clean retest of the opening range gap high after breaking structure to the upside and showing acceptance outside of the gap after consolidating within it.
The ORG High (4:14 Candle Close in this case) was used as support.
We then see an expansion to the upside.
Another way to implement the ORG is by using it as a draw on liquidity (magnet for price)
In this example, if we looked to the left, there was a huge ORG to the downside, leaving a massive gap.
The market will want to rebalance that gap during the regular trading hours.
The market rallies higher, rejects, comes down to clear the current days ORG low, then closes.
That is one example of how you can combine liquidity & ICT market structure concepts with Opening Range Gaps to create a story in the charts.
Now let’s discuss standard deviations.
---
Standard Deviations
Standard Deviations are essentially projection levels for ranges / POIs (Point of Interests)
By this I mean, if you have a range, and you would like to see where it could potentially expand to, you’d place your fibonacci retracement tool on and high and low of the range, then use extension levels to find specific price points where price might reject from.
Since 0 and 1 are your Range High and Low respectively, your projection levels would be something like 1.5, 2, 2.5, and 3, for the extension from your 1 Fib Level, and -0.5, -1, -1.5, and -2 for your 0 Fib level.
The -1 and 2 level produce a 1:1 projection of your range low and high, meaning, if you expect price to expand as much as it did from the range low to range high, then you can project a -1 and 2 on your Fib, and it would show you what ICT calls “symmetrical price”
Now, how are standard deviations relevant here?
Well, if you’ve been paying attention to ICT’s recent videos, you would’ve caught that he’s recently started using Standard Deviation levels on breakers.
So my brain got going while watching his video on ORGs, and I decided to place the fib on the ORG high and low and see what it’d produce.
The results were very interesting.
Using this same example, if we place our fib on the ORG High and Low, and add some projection levels, we can see that we rejected right at the -2 Standard Deviation Level.
---
You can see that I also marked out the EQ (Equilibrium, 50%, 0.5 of Fib) of the ORG. This is because we can use this level as a take profit level if we’re using an old ORG as our draw.
In days like these, where the gap formed was within a consolidation, and it continued to consolidate within the ORG zone that we extended, we can use the EQ in the same way we’d use an EQ for a range.
If it’s showing acceptance above the EQ, we are bullish, and expect the high of the ORG to be tapped, and vice versa.
---
Using The Indicator
Here’s where our indicator comes in play.
To avoid having to do all this work of zooming in and marking out the close and open of the respective ORG candles, we created the Opening Range Gap + Standard Deviations Indicator, with the help of our dedicated Star Clique coder, a1tmaniac.
With the ORG + STD DEV indicator, you will be able to view ORG’s and their projections on the ETH (Electronic Trading Hours) chart.
---
Features
Range Box
- Change the color of your Opening Range Gap to your liking
- Enable or disable the box from appearing using the checkbox
Range Midline
- Change the color of your Opening Range Gap Equilibrium
- Enable or disable the midline from appearing using the checkbox
Std. Dev
- Add whichever standard deviation levels you’d like.
- By default, the indicator comes with 0.5, 1, 1.5, and 2 standard deviation levels.
- Ensure that you add a comma ( , ) in between each standard deviation level
- Enable or disable the standard deviations from appearing using the opacity of the color (change to 0%)
Labels / Offset
- Adjust the offset of the label for the Standard Deviations
- Enable or disable the Labels from appearing using the checkbox
Time
- Adjust the time used for the indicators range
- If you’d like to use this for a Session or ICT Killzone instead, adjust the time
- Adjust the timezone used for the time referenced
- Options are UTC, US (UTC-4, New York Local Time) or UK (UTC+1, London Time)
- By default, the indicator is set to US

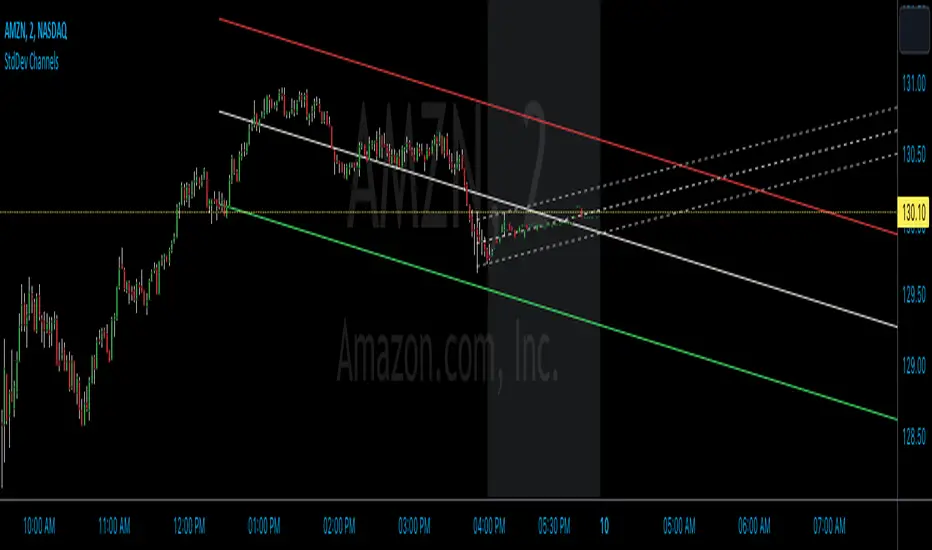
StdDev ChannelsThis script draws two sets of standard deviation channels on the price chart, providing a nuanced view of price volatility over different lengths.
The script starts by declaring a set of user-defined inputs allowing traders to customize the tool according to their individual requirements. The price input sets the source of the price data, defaulting to the closing price but customizable to use open, high, or low prices. The deviations parameter defines the width of the channels, with larger numbers resulting in wider channels. The length and length2 inputs represent the number of periods (in bars) that the script considers when calculating the regression line and standard deviation. Traders can also personalize the visual aspects of the indicator on the chart using the color, linewidth, and linestyle parameters.
Calculation of Standard Deviation:
The core of this script lies in calculating the regression line and standard deviation. This is where the InertiaAll function comes into play. This function calculates the linear regression line, which serves as the middle line of each channel. The function takes in two parameters: y (price data) and n (length for calculation). It returns an array containing the values for the regression line (InertiaTS), counter variable (x), slope of the line (a), and y-intercept (b). The standard deviation is then calculated using the built-in function ta.stdev, which measures the amount of variation or dispersion from the average.
After the calculation, the script proceeds to draw the channels. It creates two sets of lines (upper, middle, and lower) for each channel. These lines are initialized at the lowest price point on the chart (low). The coordinates for these lines get updated in the last section of the script, which runs only on the last bar on the chart (if barstate.islast). The functions line.set_xy1 and line.set_xy2 are used to adjust the starting and ending points for each line, forming the channels.
If the "full range" toggle is enabled, the script uses the maximum number of bars available on the chart to calculate the regression and standard deviation. This can give a broader perspective of the price's volatility over the entire available data range.
A Basic Strategy
The channels generated by this script may inform your trading decisions. If the price hits the upper line of a channel, it could suggest an 'overbought' condition indicating a potential selling opportunity. Conversely, if the price hits the lower line, it might signal an 'oversold' condition, suggesting a buying opportunity. The second channel, calculated over a different length, may serve to confirm these signals or identify longer-term trends.
Monthly ReturnsDisplays monthly and yearly returns in tabular format along with maximum, minimum, average returns and standard deviations.
This uses boxes to build the table and as maximum boxes that could be used is 500, it displays up to 32 years of returns. However, for maximum, minimum, average and standard deviation calculations, it uses data from all months since inception.
This requires timeframe to be set to one month (1M). Cell widths correspond to years. For the first year, cell widths may be shorter and there could be overlap of numbers as nothing could be drawn before the first bar.
Provide sufficient space for the table to render properly. Zooming out or less space may lead to overlapping of numbers.

Probability Cloud BASIC [@AndorraInvestor]🔮☁️
This is the BASIC version of the PROBABILITY CLOUD indicator.
It is an evolution beyond traditional standard deviation probabilistic indicators only using bands or channels.
The new PROBABILITY CLOUD graphic representation with customizable transparent layers is based on -2 / +2 standard deviation calculated using 20 fixed predetermined time periods, and is available in several calculation MODES:
SMA , EMA , WMA , VWMA , VWMA & VAWMA
The indicator is designed to let the trader visually understand the probabilistic depth of past, present and future price action, and its evolution over time.
Looking forward to your comments and feedback to guide me on future updates!
🙏 Big THANKS @Electrified for letting me use his work on Deviation Bands/ as a starting point for my first script.

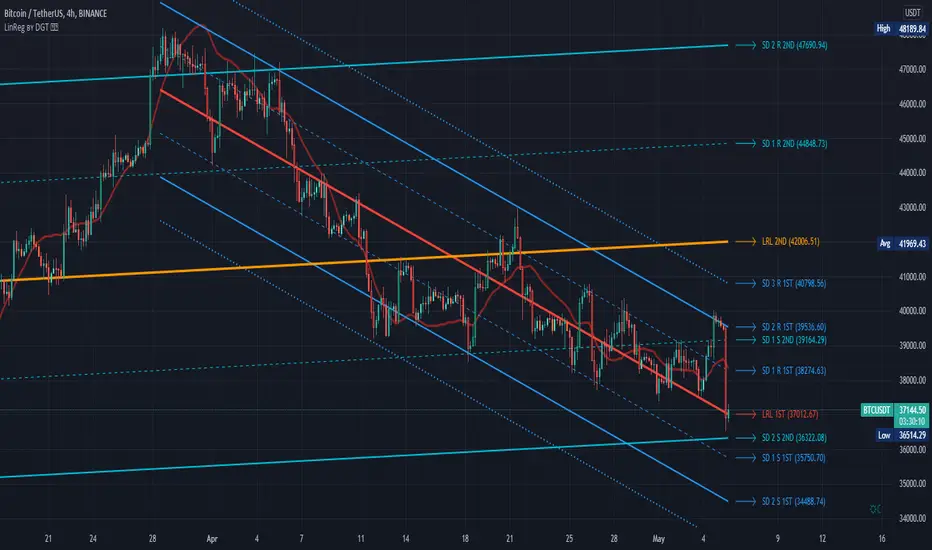
Linear Regression Channel / Curve / Slope by DGTTʜᴇ Lɪɴᴇᴀʀ Rᴇɢʀᴇꜱꜱɪᴏɴ Cʜᴀɴɴᴇʟꜱ
Linear Regression Channels are useful measure for technical and quantitative analysis in financial markets that help identifying trends and trend direction. The use of standard deviation gives traders ideas as to when prices are becoming overbought or oversold relative to the long term trend
The basis of a linear regression channel
Linear Regression Line – is a line drawn according to the least-squares statistical technique which produces a best-fit line that cuts through the middle of price action, a line that best fits all the data points of interest. The resulting fitted model can be used to summarize the data, to predict unobserved values from the same system. Linear Regression Line then present basis for the channel calculations
The linear regression channel
2. Upper Channel Line – A line that runs parallel to the Linear Regression Line and is usually one to two standard deviations above the Linear Regression Line.
3. Lower Channel Line – This line runs parallel to the Linear Regression Line and is usually one to two standard deviations below the Linear Regression Line.
Unlike Fibonacci Channels and Andrew’s Pitchfork, Linear Regression Channels are calculated using statistical methods, both for the regression line (as expressed above) and deviation channels. Upper and Lower channel lines are presenting the idea of bell curve method, also known as a normal distribution and are calculated using standard deviation function.
A standard deviation include 68% of the data points, two standard deviations include approximately 95% of the data points and any data point that appears outside two standard deviations is very rare.
It is often assumed that the data points will move back toward the average, or regress and channels would allow us to see when a security is overbought or oversold and ready to revert to the mean
please note : Over time, the price will move up and down, and the linear regression channel will experience changes as old prices fall off and new prices appear
█ Linear Regression Study Features
Linear Regression Channel
- Linear regression line as basis
- Customizable multiple channels based on Standard Deviation
- ALERTs for the channel levels
Linear Regression Curve
- Linear regression curve as basis
- Optional : Bands based on Standard Deviation or Volatility (ATR). Bands are applied with fixed levels 1, 2 and 3 times StdDev or ATR away from the curve
Linear Regression Slope
- Optional : Up/Down slope arrows for a used defined period
█ Volume / Volatility Add-Ons
High Volatile Bar Indication
Volume Spike Bar Indication
Volume Weighted Colored Bars
Trend Analysis IndicatorThe Trend Analysis Indicator was created by Adam White (Stocks & Commodities V. 10:8 (358-360)) and this is not to be confused with the Trend Analysis Index which was also created by Adam White. The stock is trending when it is above the signal and loses steam when it falls below the signal. Generally you should buy when it is above it's signal and sell when it goes below the signal.
Let me know if you would like me to write more scripts!

Variable Length Moving AverageThe Variable Length Moving Average was created by George R. Arrington Ph.D. (Stocks & Commodities V. 9:6 (219-223)) and I'm really loving this indicator. It is a great moving average that hugs the price very closely and it is fully adjustable to your needs. It detects signals extremely well and I have color coded the moving average line to make it very easy to interpret.
This is not to be confused with the Variable Moving Average created by Tushar S. Chande and as of now I haven't seen any other script for this moving average out there yet.
Please let me know if you would like me to write any other scripts for indicators you would like to see!

Volume Volatility SpectrumThis indicator estimates price volatility and it is based on Volume only (presumably Tick Volume in Forex).
Tick volume is supposed to be a good proxy to actual volume in spot forex (study of Caspar Marney, 2011)
The advantage of this indicator is that it can be used with any pair, any timeframe.
The only parameters are the periods of the reference Volume Moving Average and the fast Volume MA.
The fluctuations of a short period Volume MA with respect to a gently MA with high period
are calculated.
RED areas depict low volatility
GREEN areas depict high volatility.
When the clouds are outside the region delimited by the aqua lines we have extreme conditions:
Extremely low volatility = red cloud outside the aqua bands
Extremely high volatility = green cloud outside the aqua bands
Vitelot/yanez/Vts September 2019.
Compare this indicator with the ATR Volatility Spectrum of myself

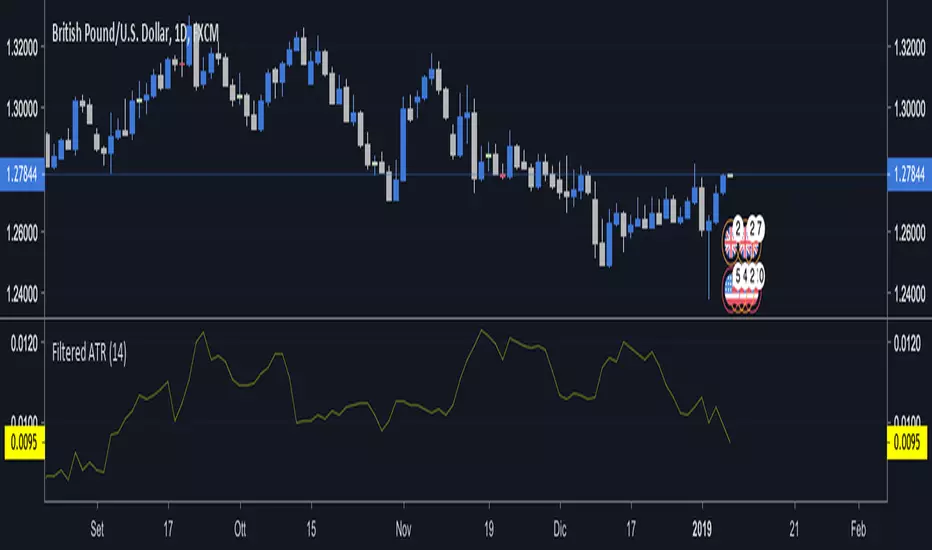
Filtered ATRThis script defines an average true range where extreme events are filtered out.
Extreme events are those bars with a true range larger than 3*sigma+average,
where average and standard deviation are estimated from the last 200 bars.
In this way the ATR is not altered by exceptional events (e.g. the flash crash of Jan 3rd 2019)
and can still be used safely for Stop Losses and Take Profits.
Hitting the like button is a free sign of gratitude, thanks.
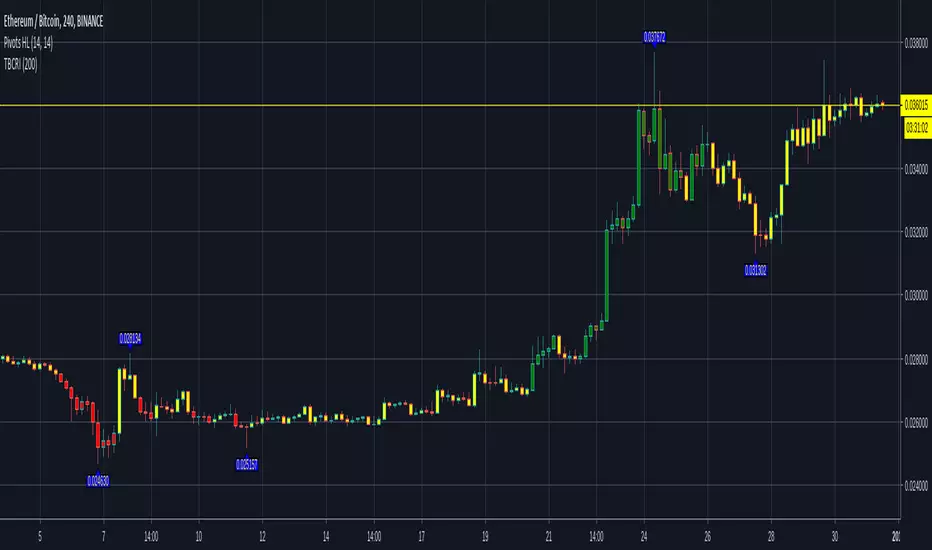
TBCRI - Trend Bar Color Reversal IndicatorAn idea I had today morning so I had to write. It seems to detect trends well. It has three phases like a semaphor, painting the chart bars of green, yellow or red.
=== Bar Color Meaning ===
Green: uptrend
Yellow: don't care
Red: downtrend
I think it can be useful!
Thanks!
Relative Volatility IndexCorrected Relative Volatility Index. This indicator was originally developed by Donald Dorsey (Stocks & Commodities V.11:6 (253-256): The Relative Volatility Index).
The indicator was revised by Dorsey in 1995 (Stocks & Commodities V.13:09 (388-391): Refining the Relative Volatility Index).
I suggest the refined RVI with optional settings. If you disabled Wilder's Smoothing and Refined RVI you will get the original version of RVI (1993, as built-in).
Also, you can choose an algorithm for calculating Standard Deviation.

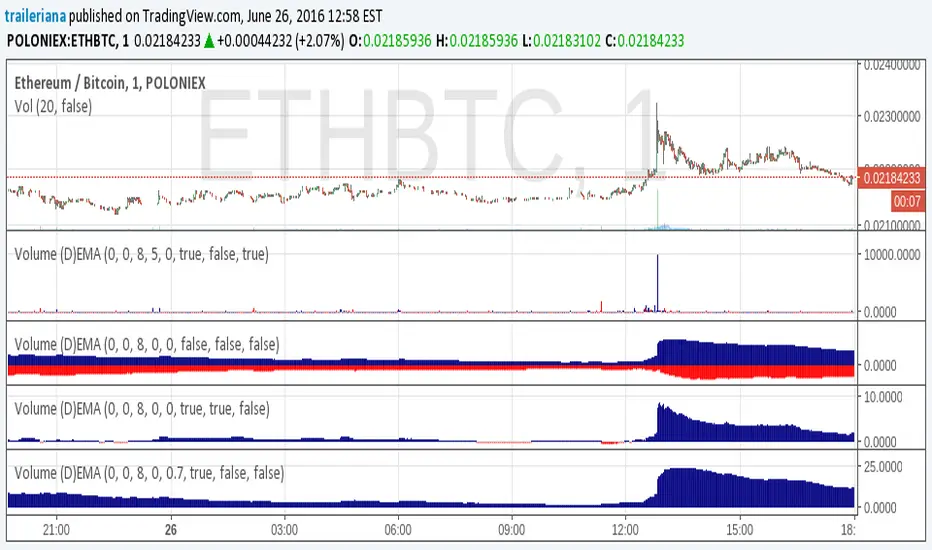
Volume (D)EMAA simple yet configurable indicator that shows recent traffic volumes.
The time period is specified as weeks/days/hours/minutes, not as bars.
Set the volume period to non-zero if you want to use a generalized double EMA instead of plain.
The "ratio" option will show the size of the current volume compared to the average volume as computed for the specified time period; say hello to fat tails and goodby to "standard" and "normal" and "average". With the "together" option, it compares the current volume to the both sides together (buy+sell), otherwise it compares it to just its respective side.
Volume (D)EMAA simple yet configurable indicator that shows recent traffic volumes.
The time period is specified as weeks/days/hours/minutes, not as bars.
Set the volume period to non-zero if you want to use a generalized double EMA instead of plain.
The ratio option will show the size of the current volume compared to the volume in the specified time period (expect to see something very non-Gaussian, say goodby to trusting your ATR and stddev, and say hello to fat tails.) With the "together" option, it compares the current volume to the both sides together (buy+sell), otherwise it compares it to just its own.
