En iyi işlemler önce araştırma, sonra kararlılık gerektirir.
Ücretsiz olarak başlayınSonsuza kadar 0$, kredi kartı gerekmez

Scott "Kidd" PoteetPolaris Dawn astronotu

Dünya piyasaları nerede
Geleceği kendi ellerine alan 100 milyon yatırımcıya katılın.
Sıkışan Kararsız FiyatMerhaba arkadaşlar, hissede fiyat sıkışmaya başlamış. Ve son mum kararsız. Buralarda bir karar verecek gibi duruyor. Bakalım yükseliş yönlü olacak mı ?
Stop ve Hedef çizgileri görselde gösterilmiştir. Hissede 3 fiyatı önemli ve üzerinde kalıcı olması lazım.
Ağırlıklı hacim araçları eklediğimde bu
XAUUSD — Yapı Tutuluyor, Genişleme BekleniyorXAUUSD — Yapı Tutma, Genişleme Bekleniyor
Altın, son toparlanmanın ardından yükselen talebin üzerinde stabil kalıyor ve ana orta seviye direncini test ediyor. Piyasa, keskin bir satıştan bir reaksiyon ve yeniden dengeleme aşamasına geçiyor, likidite ana itici güç haline geliyor.
Makro perspektifte
TÜRK HAVA YOLLARI THYOYatırım Tavsiyesi olmamakla birlikte diğer analizlerden de aldığım kısa notlar ile THYO detayları aşağıdadır.
Kısa Vadeli
Dalgalanma riski yüksek: Küresel petrol fiyatları ve döviz kurları, kısa vadede hisse üzerinde baskı oluşturabilir.
Talep güçlü: Yolcu sayısında artış ve kargo gelirlerinin de
Destek korunuyor, premium direnç bölgesine doğru yükseliş devamı
Grafik Analizi
1 saatlik zaman diliminde (H1) altın, düzeltme sonrası yükseliş devamı senaryosu sergiliyor.
Piyasa Yapısı
Güçlü bir düşüş impulsundan sonra fiyat, FVG (Fair Value Gap) bölgesini (4.65x–4.75x) doldurdu.
Ardından daha yüksek dipler (Higher Lows) oluştu; bu da ayıdan boğaya yapı de
#XRP Boğa Flaması mı, Devam Eden Baskı mı ? Sence ?Piyasaya genel açıdan baktığımızda XRP tarafında klasik anlamda temiz bir düşüş trendinden ziyade, haber akışı ve piyasa manipülasyonlarıyla desteklenen yapısal fakat sağlıksız bir geri çekilme görüyoruz. Çünkü güçlü düşüş trendlerinde beklediğimiz net şekilde daha düşük tepe – daha düşük dip dizili
Tüm editörlerin seçtiği fikirleri görün
Peak Trading Activity Graphs [LuxAlgo]The Peak Trading Activity Graphs displays four graphs that allow traders to see at a glance the times of the highest and lowest volume and volatility for any month, day of the month, day of the week, or hour of the day. By default, it plots the median values of the selected data for each period. T
Smart Trader, Episode 03, by Ata Sabanci, Candles and TradelinesA volume-based multi-block analysis system designed for educational purposes. This indicator helps traders understand their current market situation through aggregated block analysis, volumetric calculations, trend detection, and an AI-style narrative engine.
━━━━━━━━━━━━━━━━━━━━━━━━━━━━━━━━━━━━━━━
Asset Drift ModelThis Asset Drift Model is a statistical tool designed to detect whether an asset exhibits a systematic directional tendency in its historical returns. Unlike traditional momentum indicators that react to price movements, this indicator performs a formal hypothesis test to determine if the observed d
Hyperfork Matrix🔱 Hyperfork Matrix 🔱 A manual Andrews Pitchfork tool with action/reaction propagation lines and lattice matrix functionality. This indicator extends Dr. Alan Andrews' and Patrick Mikula's median line methodology by automating the projection of reaction and action lines at equidistant intervals, cr
Arbitrage Matrix [LuxAlgo]The Arbitrage Matrix is a follow-up to our Arbitrage Detector that compares the spreads in price and volume between all the major crypto exchanges and forex brokers for any given asset.
It provides traders with a comprehensive view of the entire marketplace, revealing hidden relationships among d
Wyckoff Schematic by Kingshuk GhoshThe "Wyckoff Schematic" is a Pine Script indicator that automatically detects and visualizes Wyckoff Method accumulation and distribution patterns in real-time. This professional tool helps traders identify smart money movements, phase transitions, and critical market structure points.
Key Features
Volume Cluster Profile [VCP] (Zeiierman)█ Overview
Volume Cluster Profile (Zeiierman) is a volume profile tool that builds cluster-enhanced volume-by-price maps for both the current market window and prior swing segments.
Instead of treating the profile as a raw histogram only, VCP detects the dominant volume peaks (clusters) insid
DeeptestDeeptest: Quantitative Backtesting Library for Pine Script
━━━━━━━━━━━━━━━━━━━━━━━━━━━━━━━━━━
█ OVERVIEW
Deeptest is a Pine Script library that provides quantitative analysis tools for strategy backtesting. It calculates over 100 statistical metrics including risk-adjusted return ratios (Sharpe
Arbitrage Detector [LuxAlgo]The Arbitrage Detector unveils hidden spreads in the crypto and forex markets. It compares the same asset on the main crypto exchanges and forex brokers and displays both prices and volumes on a dashboard, as well as the maximum spread detected on a histogram divided by four user-selected percenti
Multi-Distribution Volume Profile (Zeiierman)█ Overview
Multi-Distribution Volume Profile (Zeiierman) is a flexible, structure-first volume profile tool that lets you reshape how volume is distributed across price, from classic uniform profiles to advanced statistical curves like Gaussian, Lognormal, Student-t, and more.
Instead of forcin
Tüm göstergeleri ve stratejileri görün
Topluluk trendleri
Sıkışan Kararsız FiyatMerhaba arkadaşlar, hissede fiyat sıkışmaya başlamış. Ve son mum kararsız. Buralarda bir karar verecek gibi duruyor. Bakalım yükseliş yönlü olacak mı ?
Stop ve Hedef çizgileri görselde gösterilmiştir. Hissede 3 fiyatı önemli ve üzerinde kalıcı olması lazım.
Ağırlıklı hacim araçları eklediğimde bu
2026 Model Portföy hissesi ESCOM da Üçgenler çalışır mı ???merhaba arkadaşlar, Kasım Ayı ile Bist100 endeksinde 9995 desteği üzerinde cazip fiyatlarda olabilecek hisselerden ESCOM da 3.4 den maliyet yapmıştık. Yaklaşık 3aylık süreçte hissede %10 luk bir artış görülmüştür.
ESCOM da ilk önce Simetrik üçgen beklentimizi oluşturmuştuk. Endeksin olumlu olması i
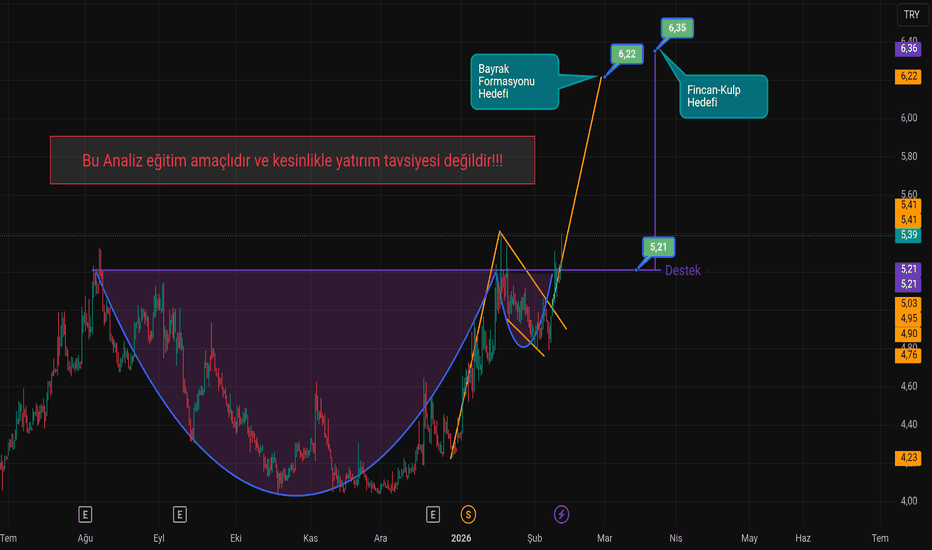
#KAYSE Hissesinde Fincan Kulp ve Bayrak Formasyonu Oluştu.Bu çalışma eğitim amaçlı bir çalışmadır, kesinlikle yatırım tavsiyesi değildir.
KAYSE Hissesinde;
5 ₺ civarında bayrak formasyonu oluşmuştu ve önünde bulunan 5,21 ₺ direncini kırarak, hem 5,21 ₺ seviyesi desteğe dönüştü hem de Fincan Kulp Formasyonu oluştu. Teknik analize göre sırasıyla hedefleri
IZMDC GÜÇLÜ HAZIRLIKIZMDC için klasik bir ikili çanak (double cup / cup continuation) yapısı görülüyor.
2020 den devam eden formasyon kırılım noktasına doğru devam ediyor.
kritik yatay direnç = BOYUN ÇİZGİSİ 8,82 civarı
Bu bölge kırılırsa güçlü momentumlu yükseliş başlar..
8,82 üzeri kapanışta formasyon aktif hale ge
DMRGD Tehlikeli Sularda YüzüyorBugün takip edeceğimiz bir başka hisse 0,10$ fiyat bandından DMRGD teknik olarak incelediğimizde aylık ve haftalık güçlü trendini korumaya devam eden bir hisse olduğunu görüyoruz grafikte sıralı hedefler belirtilmiştir güçlü bir momentum ile yükselen trendin devamının geleceği kanaatindeyim.
Bol ka
Tüm hisse senedi fikirlerini görün
16 Şub
HALKBTÜRKİYE HALK BANKASI A.Ş.
Güncel
—
Tahmin
1,68
TRY
17 Şub
TAVHLTAV HAVALİMANLARI HOLDİNG A.Ş.
Güncel
—
Tahmin
—
18 Şub
TTKOMTÜRK TELEKOMÜNİKASYON A.Ş.
Güncel
—
Tahmin
—
23 Şub
TKNSATEKNOSA İÇ VE DIŞ TİCARET A.Ş.
Güncel
—
Tahmin
—
24 Şub
CIMSAÇİMSA ÇİMENTO SANAYİ VE TİCARET A.Ş.
Güncel
—
Tahmin
—
24 Şub
SELECSELÇUK ECZA DEPOSU TİCARET VE SANAYİ A.Ş.
Güncel
—
Tahmin
—
Daha fazla olay gör
Topluluk trendleri
Bitcoin GLR Analizi: Makro Veriler Neden Önemli?GLR Nedir?
Global Liquidity Regime, küresel likidite ortamını takip eden bir makro indikatördür.
Basitçe söylemek gerekirse: "Şu an piyasalarda para bol mu, kıt mı?" sorusuna cevap arıyor.
İndikatör dört farklı rejim gösteriyor: BUY (likidite bol, risk al), WAIT (nötr ortam, sabırlı ol), REDUCE
ETH - 12.02.2026Merhaba,
ETH'de düşüş baskısı sürmektedir. Bu baskının hafiflemesi için ilk etapta 2330 üzerinde haftalık kapanış görmemiz gerekmektedir. Bu kapanış gerçekleşmediği sürece fiyatın yeşil renk ile görülen yükselen alt trend çizgisine kadar düşmesi söz konusu olabilir. Bu da yuvarlak olarak 1500 civar
ETHUSDT: 1,6 ve 0,8 Strateji Kalıplarının Nadir KesişimiSolda short biaslı 1,6 stratejimi destekleyen ve sonradan oluşan iç yükseliş dalgalarında; önce yeşil pivot işaretli ilk yükseliş dalgasının 1,6, ardından mavi pivotlu dalga yapısının 0,8 katına ulaştığını gözlemledim.
Birbirini takip eden dalgalar bu ivmelere ulaştığında, bu bana dalgayı ilk başla
12 ŞUBAT Bitcoin Bybit Grafik AnaliziMerhaba
Bu bir Bitcoin Rehberi.
"Takip ederseniz"
Önemli bölümlerde gerçek zamanlı hareket yolları ve yorum bildirimleri alabilirsiniz.
Analizim faydalı olduysa,
Lütfen alttaki destek düğmesine tıklayın.
Bu 30 dakikalık bir Bitcoin grafiğidir.
Nasdaq göstergeleri kısa süre sonra saat 10:30 ve
#BİTCOİN BİTTİ Mİ?
Bitcoin son dönemde sert düşüşler yaşadı. Şubat 2026 itibarıyla fiyatı 66.000–76.000 dolar aralığında seyrediyor ve son birkaç ayda %30 civarında değer kaybı var. Bu düşüşün arkasında birkaç faktör öne çıkıyor:
Kısa Vadeli Durum
Likidasyonlar ve balina satışları: Büyük yatırımcıların (balinalar) b
Bitcoin Analizi | 1D | Kritik Destek ve Hedefler | TraderTilkiDostlarım Selamlar,
Sizler için Bitcoin’i 1 günlük zaman diliminde yani swing analiz şeklinde detaylı şekilde inceledim. 📊
Bir önceki Bitcoin analizimi hatırlayanlar bilir, çok başarılı olmuştu çünkü o düşüşü önceden bilmiştim.
Şimdi yine kilit bir noktadan bahsedeceğim: bu kilit seviye 59,000 ile
#IOUSDT Daralan Üçgen Kırılımı Bekleniyor Ama ???Fiyat yapısında daralan üçgen (symmetrical triangle) formasyonu dikkat çekiyor...
Üst banttaki düşüş trendi momentum kaybederken, yapı kararsızlık ve sıkışma evresine girmiş durumda...
Üçgen formasyonlarında yön genellikle kırılımla netleşir bu nedenle kritik seviyeler;
• 0.1054$ üzeri kapanış i
ZIL Kısada Sert Hareketler Beklene BilirZilliqa (ZIL), blokzincir dünyasındaki "yavaşlık" sorununu çözmek amacıyla sharding (parçalama) teknolojisini dünyada ilk kez hayata geçiren, yüksek işlem hızına ve ölçeklenebilirliğe odaklanmış, akıllı sözleşmeler aracılığıyla merkeziyetsiz uygulamalar (dApp) geliştirilmesine olanak tanıyan yüksek
Tüm kripto fikirlerini görün
XAUUSDOns altın grafiği, günlerdir grafikte fuşya renkli direnç bloğu içerisinde hareket ediyor. Fiyat hareketleri oldukça kısıtlı ve sıkışık bir görünüm sergiliyor.
Net ve güçlü bir yükselişten söz edebilmemiz için mumların bu direnç bloğu üzerinde kalıcılık sağlaması gerekiyor.
Bu şartın oluşması hali
Destek korunuyor, premium direnç bölgesine doğru yükseliş devamı
Grafik Analizi
1 saatlik zaman diliminde (H1) altın, düzeltme sonrası yükseliş devamı senaryosu sergiliyor.
Piyasa Yapısı
Güçlü bir düşüş impulsundan sonra fiyat, FVG (Fair Value Gap) bölgesini (4.65x–4.75x) doldurdu.
Ardından daha yüksek dipler (Higher Lows) oluştu; bu da ayıdan boğaya yapı de
XAGUSDGüncel Destek & Direnç S eviyeleri
121$ zirvesi sonrasında 92$ bölgesinin de kırılmasıyla yaklaşık %50 lik bir düzeltme yaşayan ONSGÜMÜŞ te toparlanma ile yeniden dirençte bulunuyor
Negatifte 77$ , 71$ ve 65$ destekleri beklenebilir
Pozitifte ise 86$ , 92$ dirençleri üzerinde kalıcı olması takip
GOLD Uçuşa Geçiyor mu ? 🧈 GRAFİK ANALİZİ | NASDAQ100 🧈
Fiyatın 5.047,429 destek seviyesini test edip 5.163,569 direncine yönelmesi beklenebilir. Bu bölge üzerinde kalıcılık sağlanırsa hedef 5.285,909 direnç noktası olabilir. ⚖️
Aksi senaryoda 5.047,429 altı kapanış, satış baskısını artırarak 4.940,815 → 4.
XAUUSD (H1) – Liam Görüşü | Altın SıkışıyorXAUUSD (H1) – Liam Görüşü | Altın Talepten Aşağıda Sıkışıyor, Patlama Yolda mı?
Altın, 5,050 civarında yükselen trend çizgisinin üzerinde sağlam duruyor ve son impulsif hareketten sonra konsolide oluyor. Fiyat yapısı inşa edici kalmaya devam ediyor; 5,250 – 5,300 civarında görünür bir FVG arz bölge
Ons altında düzeltme süreci devam edecek mi ???merhaba arkadaşlar, Ons altında 5602 zirvesi sonrası düzeltme süreci yaşamıştık. 4670 gün destek üzerinde kalıcılık sağlayan ons altında kanal dibi olan 4402 ile çok kısada en dibi test etmiştik.
Kısa vadede Düzeltme sonrası TUT konumda olan Ons altında İlk kez alımlar için Teknik olarak yeniden A
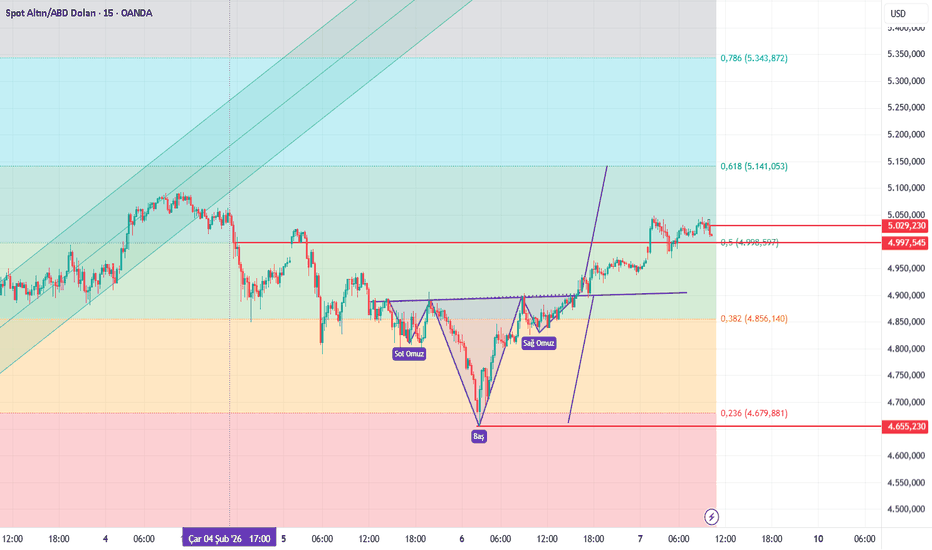
XAUUSD BOS Sonrası Yükseliş Devamı | M15 YapıGrafik Analizi (XAUUSD – 15 dk)
Piyasa Yapısı
Yükseliş (bullish) piyasa yapısı korunuyor.
Konsolidasyon sonrası yukarı yönlü net bir Break of Structure (BOS) oluştu.
Fiyat önceki destek bölgesine saygı gösterdi, bir Point of Interest (POI) oluşturdu ve güçlü bir yükseliş impulsu başlattı.
Temel
XAUUSD | Teknik Görünüm Fiyat sıkışan üçgen formasyonu içinde ilerliyor
Üstte alçalan trend, altta yükselen dipler → karar bölgesi
5.060 – 5.075 bandı kısa vadeli denge alanı
Yukarı kırılımda 5.190 → 5.300 dirençleri gündeme gelir
Aşağıda 4.975 ilk destek, altında 4.775 kritik bölge
Momentum zayıf ama satış baskısı d
Tüm gelecek fikirlerini görün
Epstein'ın GBPUSD üzerindeki etkisiGeçen hafta Epstein dosyalarının daha fazlasının yayınlanması, İngiltere Başbakanı Keir Starmer'ı siyasi hayatı için mücadele etmeye zorladı ve İngiliz sterlini çiftlerine dalgalanma getirebilir.
Tartışma, Peter Mandelson ve Epstein ile olan ilişkisi etrafında odaklanıyor. Starmer, Mandelson'ın hük
Eur/usd – 2 saatlik teknik analizişu an ~1,1900 civarında konsolide oluyor. kısa vadede yatay seyrini koruyor. rsi ~72, aşırı alım bölgesine yakın; bu da kısa vadeli düzeltme ihtimalini artırıyor.
destekler:
• 1,1900 → kısa vadeli destek, kırılırsa küçük geri çekilmeler görülebilir
• 1,1835 → orta vadeli destek, tepki alan güçlü se
NZD/USDAçık bırakılan likitideleri hedeflemek istiyorum.. Siyah kutu (breaker) Alım bölgem.. Kaybedilmesi durumunda (net kapanış+ltf de bırakılacak ob) durumunda kırılımı fake olarak kabul eder Entry'de pozisyondan kaçarım.. Eur/usd paritesinde de benzer durumlar mevcut.. Eş zamanlı olarak takip etmekteyim
EURGBP — Haftalık Akıllı Para Planı (SMC)📈 Piyasa Bağlamı
EURGBP, piyasaların İngiltere Merkez Bankası ve ECB faiz beklentilerini yeniden fiyatlandırdığı güçlü makro etki altında yeni haftaya adım atıyor. İngiltere’deki inatçı enflasyon, karışık veriler ve ECB faiz indirimleri etrafındaki artan spekülasyon, temiz yönlü trendler yerine düz
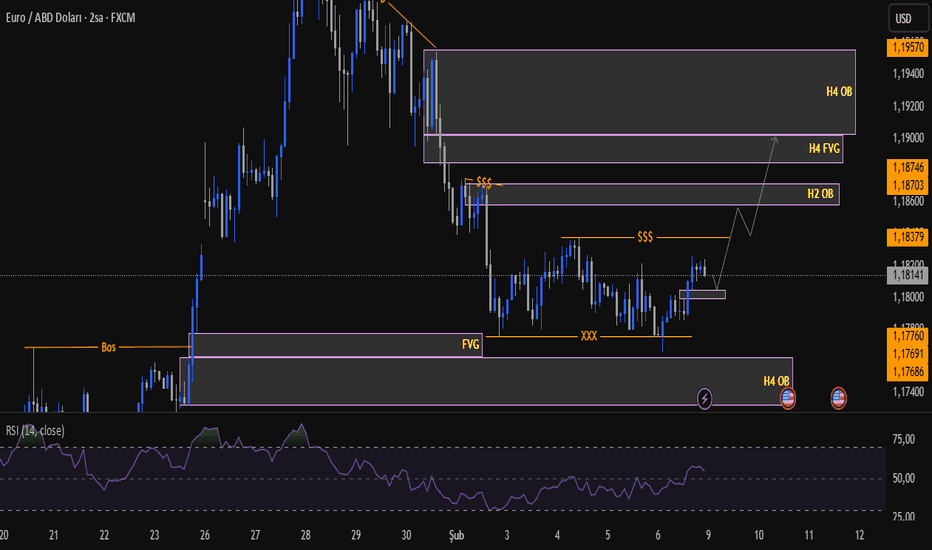
EURUSD İçin Haftalık AnalizGeçtiğimiz hafta düzeltmeye giren paritenin bu düzeltmeyi FVG bölümünü doldurarak tamamladığını düşünüyorum. aşağıda yaptığı consolide hareketi likidite alarak son gün yukarı hareket ile range in üst bölümüne geldi. bu hafta yukarıda belirlediğim FVG ve order bloklara giderek ykseliş trendinin devam
Tüm foreks fikirlerini görün
Desteklenen, tam doğrulanmış ve kullanıcılar tarafından incelenmiş aracı kurumlarımız aracılığıyla doğrudan Süpergrafikler üzerinde işlem yapın.


