Bitcoin tam kapitülasyon aşamasına doğru geriliyorBitcoin tam kapitülasyon aşamasına doğru geriliyor
Bitcoin tam teslimiyet aşamasına doğru bir adım daha aşağıya atacak. 2021'de Bitcoin düşmeye başladı ve düşüşler ayı bayrağı desenini takip etti. Teslimiyet aşamasına gelmiştik. Herkes fiyat boşluğunun çabucak doldurulacağını düşündü ama bir küçük

En iyi işlemler önce araştırma, sonra kararlılık gerektirir.
Ücretsiz olarak başlayınSonsuza kadar 0$, kredi kartı gerekmez

Scott "Kidd" PoteetPolaris Dawn astronotu

Dünya piyasaları nerede
Geleceği kendi ellerine alan 100 milyon yatırımcıya katılın.
Bu Hafta Endeks Beklentileri ve THYAO-ASELS AnaliziYüksek para girişi piyasamızı canlandırırken 2 yıldır en iyi doğrudan yatırımları duymaya da başladık. Kısa süre içinde belirli bir hisse grubuyla gerçekleşen yükseliş piyasaya olan güveni sağlamakta güçlük çekiyor. Bu nedenle kısa sürede fazla fiyatlamaya uğrayan senetler de yatırımcıların dikkatli
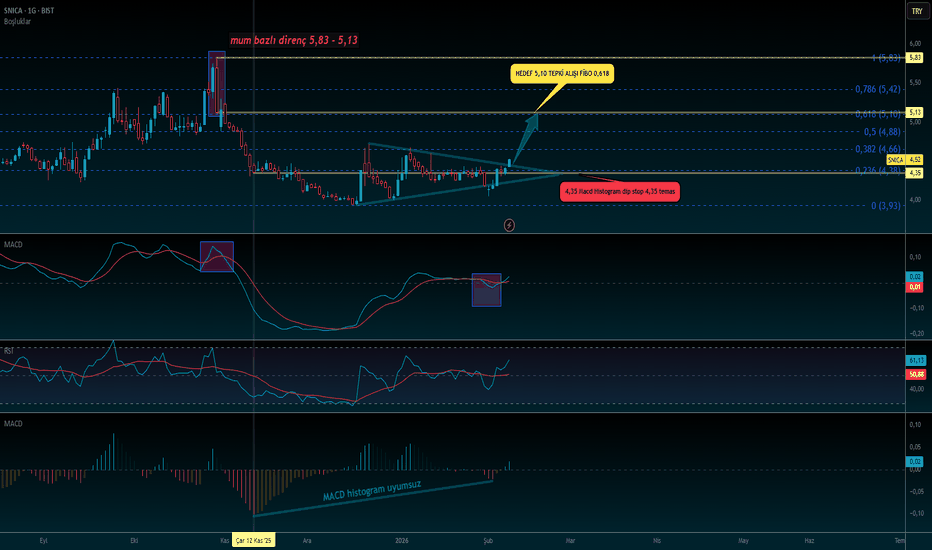
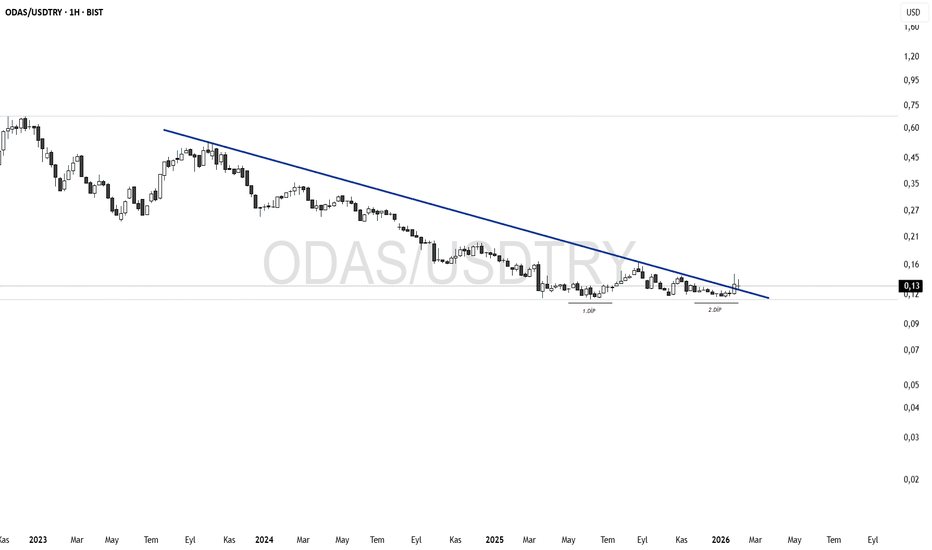
Bullish 3D PatternHisse, iki ayrı düşüş hareketinde de Fibonacci 0,618 düzeltme seviyesinde dip oluşturmuş. Fib 0,618 dönüşü fib 1,272 seviyesinde son bulmuş . Bu kez de aynı fiyat davranışını sergilemesini bekliyorum .
Ayrıca düşen trendi yukarı yönlü kırmış durumda. Bu seviye altına inilmediği sürece hissede gör
XRP/USDT Haftalık Range SIBI FVG OB HİDDEN BASE XRP/USDT Haftalık analizidir
Long düşünmek için sibi noktası ve range low noktamızın üstünde hafta kapanışı görmek gerekli.
ilk hedef range orta bandı range orta bandı üzerin'de hafta kapanısı ile range high noktası hedef olur
Po3 oluşumuda gelebilir o zaman yeni Range low noktasına girmesiy
SILVER 1H Teknik AnaliziGümüş fiyatının kısa vadeli görünümünde aşağı yönlü ana trendin hâlen geçerliliğini koruduğu görülmektedir. Üstten gelen düşen trend çizgisi, fiyatın her yükseliş denemesinde baskılandığını ve piyasanın satış yönlü yapısını sürdürdüğünü açık biçimde ortaya koymaktadır.
Buna karşılık, daha uzun vade
LILAK hısse analızı35,44 seviyesi onemli bir seviye, Grafik haftalık grafik. 35,44 Aşıması durumda sıralı hedefler grafıkte kı gıbı.ORta uzun vade.. 35,44 uzerrı elınde tut kar al bolgelerı eskı ATH ve ılgılı hedefler grafıktedır. YTD.35,44 ne zaman gececek orası bılınemz ancak takıp etmekte fayda var.
Altın + BTC.D + ABD 10Y karşısında Altcoinler nerede duruyor?
#Altın + BTC.D + ABD 10Y karşısında Altcoinler nerede duruyor?
Grafikte özellikle bazı tarihsel seviyeler dikkat çekiyor. Mavi ana direnç, siyah ana seviye ve iki farklı yeşil destek alanını bu yüzden ayırarak işaretledim.
Şu an bulunduğumuz yer kritik. Siyah ana seviye üzerinde tutunmaya çalışıy
BITCOINDE PANIK ICIN ERKENTüm piyasalar için ama özellikle bitcoin altcoinler ve emtialar için kayıtlara geçecek bir 6 şubatı gördük. Bitcoin’de görülen son geri çekilmenin ana nedeni; küresel ölçekteki gelişmelerin tetiklediği riskten kaçış eğilimiyle birlikte, **satış emirlerinin zincirleme şekilde çalışması ve birbirini t
Tüm editörlerin seçtiği fikirleri görün
Smart Trader, Episode 03, by Ata Sabanci, Candles and TradelinesA volume-based multi-block analysis system designed for educational purposes. This indicator helps traders understand their current market situation through aggregated block analysis, volumetric calculations, trend detection, and an AI-style narrative engine.
━━━━━━━━━━━━━━━━━━━━━━━━━━━━━━━━━━━━━━━
Asset Drift ModelThis Asset Drift Model is a statistical tool designed to detect whether an asset exhibits a systematic directional tendency in its historical returns. Unlike traditional momentum indicators that react to price movements, this indicator performs a formal hypothesis test to determine if the observed d
Hyperfork Matrix🔱 Hyperfork Matrix 🔱 A manual Andrews Pitchfork tool with action/reaction propagation lines and lattice matrix functionality. This indicator extends Dr. Alan Andrews' and Patrick Mikula's median line methodology by automating the projection of reaction and action lines at equidistant intervals, cr
Arbitrage Matrix [LuxAlgo]The Arbitrage Matrix is a follow-up to our Arbitrage Detector that compares the spreads in price and volume between all the major crypto exchanges and forex brokers for any given asset.
It provides traders with a comprehensive view of the entire marketplace, revealing hidden relationships among d
Wyckoff Schematic by Kingshuk GhoshThe "Wyckoff Schematic" is a Pine Script indicator that automatically detects and visualizes Wyckoff Method accumulation and distribution patterns in real-time. This professional tool helps traders identify smart money movements, phase transitions, and critical market structure points.
Key Features
Volume Cluster Profile [VCP] (Zeiierman)█ Overview
Volume Cluster Profile (Zeiierman) is a volume profile tool that builds cluster-enhanced volume-by-price maps for both the current market window and prior swing segments.
Instead of treating the profile as a raw histogram only, VCP detects the dominant volume peaks (clusters) insid
DeeptestDeeptest: Quantitative Backtesting Library for Pine Script
━━━━━━━━━━━━━━━━━━━━━━━━━━━━━━━━━━
█ OVERVIEW
Deeptest is a Pine Script library that provides quantitative analysis tools for strategy backtesting. It calculates over 100 statistical metrics including risk-adjusted return ratios (Sharpe
Arbitrage Detector [LuxAlgo]The Arbitrage Detector unveils hidden spreads in the crypto and forex markets. It compares the same asset on the main crypto exchanges and forex brokers and displays both prices and volumes on a dashboard, as well as the maximum spread detected on a histogram divided by four user-selected percenti
Multi-Distribution Volume Profile (Zeiierman)█ Overview
Multi-Distribution Volume Profile (Zeiierman) is a flexible, structure-first volume profile tool that lets you reshape how volume is distributed across price, from classic uniform profiles to advanced statistical curves like Gaussian, Lognormal, Student-t, and more.
Instead of forcin
Multi-Ticker Anchored CandlesMulti-Ticker Anchored Candles (MTAC) is a simple tool for overlaying up to 3 tickers onto the same chart. This is achieved by interpreting each symbol's OHLC data as percentages, then plotting their candle points relative to the main chart's open. This allows for a simple comparison of tickers to tr
Tüm göstergeleri ve stratejileri görün
Topluluk trendleri
Bullish 3D PatternHisse, iki ayrı düşüş hareketinde de Fibonacci 0,618 düzeltme seviyesinde dip oluşturmuş. Fib 0,618 dönüşü fib 1,272 seviyesinde son bulmuş . Bu kez de aynı fiyat davranışını sergilemesini bekliyorum .
Ayrıca düşen trendi yukarı yönlü kırmış durumda. Bu seviye altına inilmediği sürece hissede gör
Bu Hafta Endeks Beklentileri ve THYAO-ASELS AnaliziYüksek para girişi piyasamızı canlandırırken 2 yıldır en iyi doğrudan yatırımları duymaya da başladık. Kısa süre içinde belirli bir hisse grubuyla gerçekleşen yükseliş piyasaya olan güveni sağlamakta güçlük çekiyor. Bu nedenle kısa sürede fazla fiyatlamaya uğrayan senetler de yatırımcıların dikkatli
ADEL Duzeltme Tamamlandı24 Kasım tarihinde 34TL fiyat bandından takibe aldığımız ADEL hissesi an itibari ile 38TL fiyat bandından işlem görmeye devam etmektedir. Teknik görünüm halen pozitif geçen iki ay zaman zarfında hisse başına net olarak 4TL kazandıran ADEL hissesinde yüzdesel fark %18 üzeri gerçekleşmiştir. Fiyat per
Otokar Hissesi:Süpertrend volatil piyasada sık sinyal veriyorOtokar Hisse Senedi Güncel Durum
Otokar hisse senedi son dönemde düşüş trendinde seyrediyor. Teknik analiz verileri, kısa vadede satış baskısının devam edebileceğini gösteriyor.
Kritik Direnç Seviyeleri
443,25 TL: İlk önemli direnç noktası. Bu seviyenin aşılması için güçlü alım gücü gerekiyor.
46
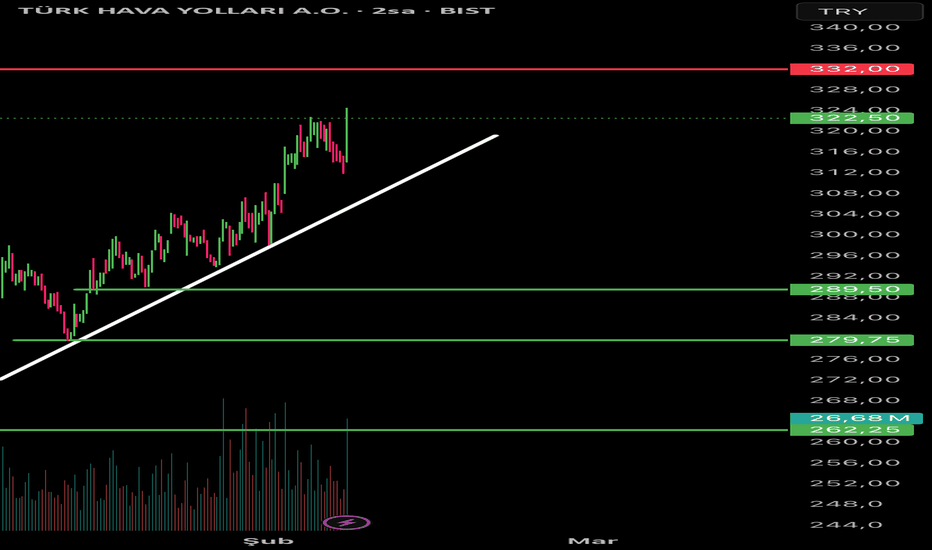
THYTHY hissesi güçlü bir yükseliş trendi içinde. Beyaz trend çizgisi net şekilde çalışıyor ve fiyat bu çizgi üzerinde kaldığı sürece ana senaryom yükselişin devamı. 322,50 seviyesi üzerinde tutunma önemliydi, şu an bunu koruyor.
Aşağıda 289,50 ilk güçlü destek, devamında 279,75 ve majör olarak 262,25
#MEYSU'da Potansiyel Harmonik Bat ve Yükselen Üçgen İhtimaliBu çalışma eğitim amaçlı bir çalışmadır, kesinlikle yatırım tavsiyesi değildir.
MEYSU hissesinde; Potansiyel Harmonik Bat Pattern ve Yükselen Üçgen Formasyonu ihtimali bulunmaktadır. Her iki formasyonun da olası hedefleri aynı olup, 17,42 ₺' dir. Fiyatın hedefe gidebilmesi için 15,18 ₺ direncini kı
Tüm hisse senedi fikirlerini görün
12 Şub
SOKMŞOK MARKETLER TİCARET A.Ş.
Güncel
—
Tahmin
—
12 Şub
KCHOLKOÇ HOLDİNG A.Ş.
Güncel
—
Tahmin
—
16 Şub
HALKBTÜRKİYE HALK BANKASI A.Ş.
Güncel
—
Tahmin
1,68
TRY
17 Şub
TAVHLTAV HAVALİMANLARI HOLDİNG A.Ş.
Güncel
—
Tahmin
—
18 Şub
VAKBNTÜRKİYE VAKIFLAR BANKASI T.A.O.
Güncel
—
Tahmin
2,55
TRY
18 Şub
TOASOTOFAŞ TÜRK OTOMOBİL FABRİKASI A.Ş.
Güncel
—
Tahmin
—
18 Şub
TTKOMTÜRK TELEKOMÜNİKASYON A.Ş.
Güncel
—
Tahmin
—
23 Şub
TKNSATEKNOSA İÇ VE DIŞ TİCARET A.Ş.
Güncel
—
Tahmin
—
Daha fazla olay gör
Topluluk trendleri
Bitcoin tam kapitülasyon aşamasına doğru geriliyorBitcoin tam kapitülasyon aşamasına doğru geriliyor
Bitcoin tam teslimiyet aşamasına doğru bir adım daha aşağıya atacak. 2021'de Bitcoin düşmeye başladı ve düşüşler ayı bayrağı desenini takip etti. Teslimiyet aşamasına gelmiştik. Herkes fiyat boşluğunun çabucak doldurulacağını düşündü ama bir küçük
CRYPTO:BTCUSD 2 Aylık Grafikte Dalga 5 Diyagonal Mi Bitti?Bu bir felaket senaryosu mu acaba ne?
Lütfen fikirlerinizi saygı çerçevesinde söyler misiniz?
Diyagonal bitişlerde genelde diyagonalin başladığı yere dönüş gelir diyor üstadlar.
Benzer grafiğin Binance.US BTCUSD grafiğinde olduğunu 8200 dolar civarında bir fitilin olduğunu hatırlatırım. Benzer
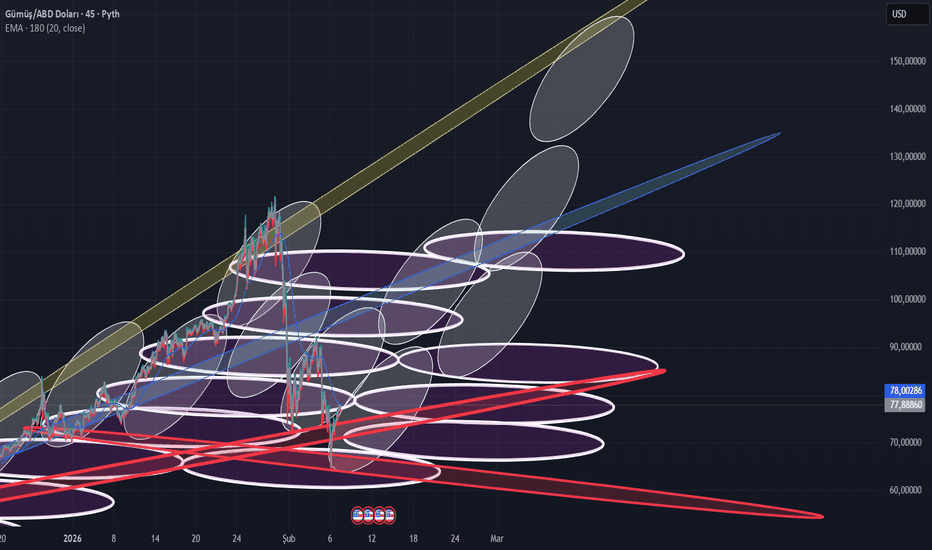
Yay Zincir Denemesi – Gümüş
Bu çalışmada, gümüş fiyatı üzerinde
sabit çift yay zinciri yaklaşımı denenmiştir.
Yaylar, rastgele değil;
oluşturulan sabit yapı temel alınarak
mevcut trende uygun sırayla yerleştirilmiştir.
Burada amaç:
tekil destek–direnç seviyeleri üretmek değil,
fiyatın yay alanları arasında nasıl geçiş yapt
9 ŞUBAT Bitcoin Bybit Grafik AnaliziMerhaba
Bu bir Bitcoin Rehberi.
"Takip ederseniz"
Önemli bölümlerde gerçek zamanlı hareket yolları ve yorum bildirimleri alabilirsiniz.
Analizim faydalı olduysa,
Lütfen alttaki destek düğmesine tıklayın.
Bu bir Bitcoin 30 dakikalık grafiğidir.
Ayrı bir Nasdaq göstergesi bulunmamaktadır.
Kırmı
#Bitcoin Analiz#Bitcoin işte size gerçek bir senaryo:
#BTC Haftalıkta CHoCH yapar. Tam da o noktada (Haftalık Bullish OB) Cypher Harmonik formasyonu çalışır ve OTE 0.70-0.79 bölgesine doğru yola çıkar. Tüm fenomenler "Ben demiştim; mega boğa başlayacak diye" derken, biz yeniden Short işlemlere geçeriz.
Filmin bu
Bitcoin Güncel Teknik DeğerlendirmeHaftalıkta bulunan yükselen trend bandının zayıflaması, kırılımı sonrası satış baskısının artmasına neden olmuştur.
Devam eden fiyat hareketinde, 60.000 bölgesinden alınan tepkiyle kısa vadeli bir toparlanma izlenmiş; ancak fiyatın ara direnç olan 72.500 seviyesinde satış baskısıyla karşılaştığı v
XRP/USDT Haftalık Range SIBI FVG OB HİDDEN BASE XRP/USDT Haftalık analizidir
Long düşünmek için sibi noktası ve range low noktamızın üstünde hafta kapanışı görmek gerekli.
ilk hedef range orta bandı range orta bandı üzerin'de hafta kapanısı ile range high noktası hedef olur
Po3 oluşumuda gelebilir o zaman yeni Range low noktasına girmesiy
BTC - Basit Fiyat Aksiyonu AnaliziBTC aylik mum grafigine bakarak basit bir PA analizi yaptigimizda sunu anlayabiliriz:
Eger 74500 altinda ay kapanisi gelirse BTC tarihinde ilk defa ay bazli HTF yapisinda market kirilimi yapmis olur (HTF MSB).
Bu olursa da fiyatin hedefi grafikteki mitigasyon bolgesi olur yani (37000-48500). Evet g
Tüm kripto fikirlerini görün
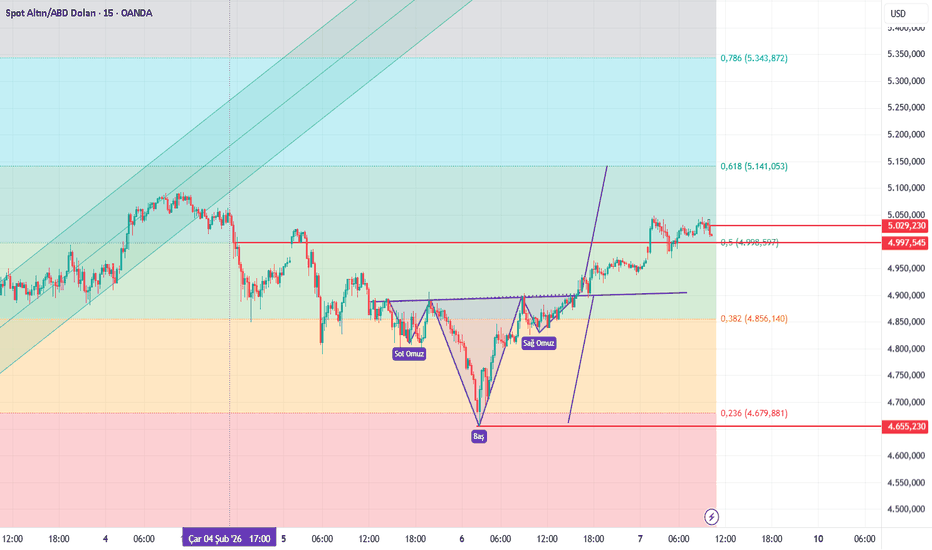
Altın Teknik Analiz Stratejisi: Yükseliş Gücü Devam Ediyor, DüşüAltın Teknik Analiz Stratejisi: Yükseliş Gücü Devam Ediyor, Düşüşlerde Alım Yapın
Piyasa Değerlendirmesi: Altın bugün yükselişle açıldı ve yaklaşık 4989 seviyesinden yukarı doğru bir boşluk oluşturdu. Sabahın erken saatlerinde hızla 5046'ya yükseldi, ardından boşluğu doldurdu ve tekrar toparlanmada
ONS ALTIN - 08.02.2026Merhaba,
Bu grafiğimizde görülen mor dolgulu Wolf yapısını daha önce paylaşmıştım. İç yapısında bazı değişiklikler oluştu ve onlara değinmek istiyorum...
Grafikte mavi aralık ile görülen son yükselen FVG bölgesi aşağı yönlü kırıldıktan sonra bu bölge önemli bir direnç bölgesine dönüşmüştür. Dolayıs
Ons altında düzeltme süreci devam edecek mi ???merhaba arkadaşlar, Ons altında 5602 zirvesi sonrası düzeltme süreci yaşamıştık. 4670 gün destek üzerinde kalıcılık sağlayan ons altında kanal dibi olan 4402 ile çok kısada en dibi test etmiştik.
Kısa vadede Düzeltme sonrası TUT konumda olan Ons altında İlk kez alımlar için Teknik olarak yeniden A
ALTIN: Fiyat AB=CD Deseni! Sırada ne var?ALTIN: Fiyat AB=CD Deseni! Sırada ne var?
Sevgili Tüccarlar,
Fiyatın 5600 dolara yükselmesinin ardından, gelecekteki fiyat hareketinin daha net bir göstergesi ortaya çıktı. Ancak fiyat, beklenmedik 4400$ seviyesine düştükten sonra kendini düzeltti. O zamandan beri doğal fiyat hareketini yeniden ba
Silver (2H)Silver için 2 saatlik grafikte, fiyatın geçmişteki yükselen ana trendini 120 bölgesinden aldığı dirençle aşağı yönlü kırdığı ve düşen kanal içerisinde hareketine devam ettiği görülmektedir. Trend kırılımı sonrası 110–95 destekleri kaybedilmiş, düşüş 64 seviyelerine kadar sürmüştür.
Bu bölgeden gele
Gold 1(H) Teknik AnaliziBu grafikte altının 1 saatlik periyotta sert bir yükseliş sonrası düzeltme sürecine girdiğini ve bu düzeltmenin giderek sıkışan bir yapı oluşturduğunu görüyorum. Fiyat, yukarıdan gelen düşen trend çizgisi ile aşağıdan gelen yükselen destek çizgisi arasında hareket ederek bir kama formasyonu içinde i
GOLD Düzeltme Yaptı mı ? 🧈 GRAFİK ANALİZİ | NASDAQ100 🧈
Fiyatın 5.047,429 direnç seviyesini test edip 4.940,815 desteğine yönelmesi beklenebilir. ⚖️
Aksi senaryoda 4.940,815 altı kapanış, satış baskısını artırarak 4.810,820 → 4.745,742 desteklerine geri çekilme getirebilir. 📉
Genel görünüm pozitif. Kısa va
Altını düşük seviyelerden alın
Önümüzdeki Pazartesi günü, altın piyasası 5088 fiyat seviyesini yakından takip ediyor ve birçok yatırımcı bu hedefe ulaşma potansiyeline sahip olduğuna inanıyor.
Bu hafta sonu, İran ve Amerika Birleşik Devletleri nükleer anlaşmayla ilgili yeni bir müzakere turuna giriyor. Mevcut duruma göre, bu g
Tüm gelecek fikirlerini görün
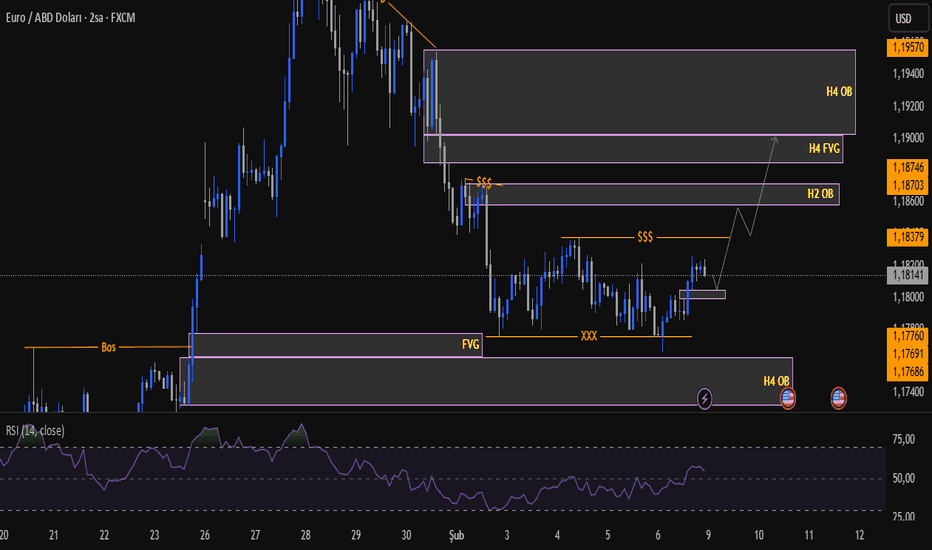
EURUSD İçin Haftalık AnalizGeçtiğimiz hafta düzeltmeye giren paritenin bu düzeltmeyi FVG bölümünü doldurarak tamamladığını düşünüyorum. aşağıda yaptığı consolide hareketi likidite alarak son gün yukarı hareket ile range in üst bölümüne geldi. bu hafta yukarıda belirlediğim FVG ve order bloklara giderek ykseliş trendinin devam
NZD/USDAçık bırakılan likitideleri hedeflemek istiyorum.. Siyah kutu (breaker) Alım bölgem.. Kaybedilmesi durumunda (net kapanış+ltf de bırakılacak ob) durumunda kırılımı fake olarak kabul eder Entry'de pozisyondan kaçarım.. Eur/usd paritesinde de benzer durumlar mevcut.. Eş zamanlı olarak takip etmekteyim
EURGBP — Haftalık Akıllı Para Planı (SMC)📈 Piyasa Bağlamı
EURGBP, piyasaların İngiltere Merkez Bankası ve ECB faiz beklentilerini yeniden fiyatlandırdığı güçlü makro etki altında yeni haftaya adım atıyor. İngiltere’deki inatçı enflasyon, karışık veriler ve ECB faiz indirimleri etrafındaki artan spekülasyon, temiz yönlü trendler yerine düz
GBPCAD teknik ve temel analizPound tarafında BoE faizi sabit tutsa da kurul içindeki indirim yönünde oyların artması, bankanın giderek daha güvercin bir çizgiye kaydığına işaret ediyor.
Büyüme beklentilerinin aşağı çekilmesi ve enflasyonun hedefe yaklaşması da ileriye dönük faiz avantajının zayıflayabileceğini düşündürüyor.
CHFJPY // Fiyatlar kanal içinde hareket etmeye devam ediyor.Sarı çizgi veya kaufman indikatörü altında olabilecek kapanışlarda stop olmak veya short işlem açmak düşünülebilir.
Paylaşım yaptığımda size email gelmiyorsa sırasıyla profil ayarları-bildirimler-takip ettiğiniz yazarlar altında bulunan eposta se
Tüm foreks fikirlerini görün
Desteklenen, tam doğrulanmış ve kullanıcılar tarafından incelenmiş aracı kurumlarımız aracılığıyla doğrudan Süpergrafikler üzerinde işlem yapın.


