ZVOL — Z-Score Volume Heatmapⓩ ZVOL transforms raw volume into a statistically calibrated heatmap using Z-score thresholds. Unlike classic volume indicators that rely on fixed MA comparisons, ZVOL calculates how many standard deviations each volume bar deviates from its mean. This makes the reading adaptive across timeframes and assets, in order to distinguish meaningful crowd behavior from random volatility.
📊 The core display is a five-zone histogram, each encoded by color and statistical depth. Optional background shading mirrors these zones across the entire pane, revealing subtle compression or structural rhythm shifts across time. By grounding the volume reading in volatility-adjusted context, ZVOL inhibits impulsive trading tactics by compelling the structure, not the sentiment, to dictate the signal.
🥵 Heatmap Coloration:
🌚 Suppressed volume — congestion, coiling phases
🩱 Stable flow — early trend or resting volume
🏀 High activity — emerging pressure
💔 Extreme — possible climax or institutional print
🎗️ A dynamic Fibonacci-based 21:34-period EMA ribbon overlays the histogram. The fill area inverts color on crossover, providing a real-time read on tempo, expansion, or divergence between price structure and crowd effort.
💡 LTF Usage Suggestions:
• Confirm breakout legs when orange or red zones align with range exits
• Fade overextended moves when red bars appear into resistance
• Watch for rising EMAs and orange volume to front-run impulsive moves
• Combine with volatility suppression (e.g. ATR) to catch compression → expansion transitions
🥂 Ideal Pairings:
• OBVX Conviction Bias — to confirm directional intent behind volume shifts
• SUPeR TReND 2.718 — for directional filters
• ATR Turbulence Ribbon — to detect compression phases
👥 The OBVX Conviction Bias adds a second dimension to ZVOL by revealing whether crowd effort is aligning with price direction or diverging beneath the surface. While ZVOL identifies statistical anomalies in raw volume, OBVX tracks directional commitment using cumulative volume and moving average cross logic. Use them together to spot fake-outs, anticipate structure-confirmed breakouts, or time pullbacks with volume-based conviction.
🔬 ZVOL isn’t just a volume filter — it’s a structural lens. It reveals when crowd effort is meaningful, when it's fading, and when something is about to shift. Designed for structure-aware traders who care about context, not noise.
Z-score

MACD Z-ScoreMACD Z-Score Indicator Description
This indicator takes the traditional MACD and converts its histogram into a standardized z‑score. It does so by first calculating the MACD using a fast and a slow moving average (which you can choose to compute with either SMA or EMA). The MACD histogram is then derived as the difference between the MACD line and a signal line (again, with your choice of smoothing method).
Next, the indicator computes a z‑score of that histogram over a user‑defined lookback period. In simple terms, it measures how far (in terms of standard deviations) the current histogram value deviates from its average. This standardization makes it easier to compare the MACD’s momentum across different assets or timeframes. There’s also an option to further smooth the z‑score with an EMA to reduce noise.
Finally, the indicator plots the resulting z‑score along with horizontal reference lines at key levels (such as 1, -1, 2, -2, 3, and -3) and changes the background color when the z‑score exceeds a high threshold (above 2) or drops below a low threshold (below -2), providing a visual cue for potential long or short conditions.
This indicator is ideal for traders looking for a normalized way to assess momentum, helping them to easily spot when the MACD histogram deviates significantly from its typical range.

NUPL Z-Score | Vistula LabsWhat is NUPL?
NUPL (Net Unrealized Profit/Loss) is a fundamental on-chain metric used to evaluate the profit or loss state of a cryptocurrency's market participants, such as Bitcoin (BTC) and Ethereum (ETH). It compares the current market capitalization—the total value of all coins at their current price—to the realized capitalization, which represents the average price at which all coins were last transacted on-chain.
Market Capitalization: Current price × circulating supply.
Realized Capitalization: The sum of the value of all coins based on the price at their last on-chain movement.
For Bitcoin (BTC):
NUPL = (Market Cap - Realized Cap) / Market Cap * 100
For Ethereum (ETH):
NUPL = (Market Cap - Realized Cap) / Market Cap
A positive NUPL indicates that the market holds unrealized profits, meaning the current value exceeds the price at which coins were last moved. A negative NUPL signals unrealized losses. Extreme NUPL values—high positives or low negatives—can suggest overvaluation (potential market tops) or undervaluation (potential market bottoms), respectively.
How NUPL is Calculated for BTC & ETH
This indicator calculates NUPL using data sourced from Glassnode and CoinMetrics:
For Bitcoin:
Market Cap: GLASSNODE:BTC_MARKETCAP
Realized Cap: COINMETRICS:BTC_MARKETCAPREAL
Formula: ((btc_market_cap - btc_market_cap_real) / btc_market_cap) * 100
For Ethereum:
Market Cap: GLASSNODE:ETH_MARKETCAP
Realized Cap: COINMETRICS:ETH_MARKETCAPREAL
Formula: ((eth_market_cap - eth_market_cap_real) / eth_market_cap) * 100
The indicator then transforms these NUPL values into a Z-Score, which measures how many standard deviations the current NUPL deviates from its historical average. The Z-Score calculation incorporates:
A customizable moving average of NUPL (options: SMA, EMA, DEMA, RMA, WMA, VWMA) over a user-defined length (default: 220 periods).
The standard deviation of NUPL over a specified lookback period (default: 200 periods).
Z-Score Formula:
Z-Score = (Current NUPL - Moving Average of NUPL) / Standard Deviation of NUPL
This normalization allows the indicator to highlight extreme market conditions regardless of the raw NUPL scale.
How This Indicator Can Be Used
Trend Following
The NUPL Z-Score indicator employs a trend-following system with adjustable thresholds to generate trading signals:
Long Signals: Triggered when the Z-Score crosses above the Long Threshold (default: 0.26).
Short Signals: Triggered when the Z-Score crosses below the Short Threshold (default: -0.62).
Visual Representations:
Green up-triangles: Indicate long entry points (plotted below the bar).
Red down-triangles: Indicate short entry points (plotted above the bar).
Color-coded elements:
Candles and Z-Score plot turn teal (#00ffdd) for long positions.
Candles and Z-Score plot turn magenta (#ff00bf) for short positions.
These signals leverage historical NUPL trends to identify potential momentum shifts, aiding traders in timing entries and exits.
Overbought/Oversold Conditions
The indicator flags extreme market states using additional thresholds:
Overbought Threshold (default: 3.0): When the Z-Score exceeds this level, the market may be significantly overvalued, hinting at potential selling pressure. Highlighted with a light magenta background (#ff00bf with 75% transparency).
Oversold Threshold (default: -2.0): When the Z-Score drops below this level, the market may be significantly undervalued, suggesting buying opportunities. Highlighted with a light teal background (#00ffdd with 75% transparency).
These extreme Z-Score levels have historically aligned with major market peaks and troughs, making them useful for medium- to long-term position management.
Customization Options
Traders can tailor the indicator to their preferences:
Cryptocurrency Source: Choose between BTC or ETH.
Moving Average Type: Select from SMA, EMA, DEMA, RMA, WMA, or VWMA.
Moving Average Length: Adjust the period for the NUPL moving average (default: 220).
Z-Score Lookback Period: Set the historical window for Z-Score calculation (default: 200).
Thresholds: Fine-tune values for: Long Threshold (default: 0.26), Short Threshold (default: -0.62), Overbought Threshold (default: 3.0), Oversold Threshold (default: -2.0)
These options enable users to adapt the indicator to various trading strategies and risk profiles.
Alerts
The indicator supports four alert conditions to keep traders informed:
NUPL Long Opportunity: Alerts when a long signal is triggered.
NUPL Short Opportunity: Alerts when a short signal is triggered.
NUPL Overbought Condition: Alerts when the Z-Score exceeds the overbought threshold.
NUPL Oversold Condition: Alerts when the Z-Score falls below the oversold threshold.
These alerts allow traders to monitor key opportunities without constantly watching the chart.

Ichimoku Score Indicator [tanayroy]The Ichimoku Cloud is a comprehensive indicator that provides a clear view of market states through five key components. By analyzing the interaction between these components and the asset's price, traders can gain insights into trend direction, momentum, and potential reversals.
Introducing the Ichimoku Score System
I have developed a scoring system that quantifies these interactions, offering an objective method to evaluate market conditions. The score is calculated based on the relative positioning of Ichimoku components, with adjustable weightings via user input.
Scoring Criteria
Each component contributes to the overall score as follows:
Price vs. Cloud (Kumo) & Other Components
Price vs. Kumo → 2 Points
Price vs. Kumo Shadow → 0.5 Points
Tenkan vs. Kijun
Tenkan vs. Kijun → 2 Points
Tenkan vs. Kumo → 0.5 Points
Kijun vs. Kumo → 0.5 Points
Tenkan Slope → 0.5 Points
Kijun Slope → 0.5 Points
Chikou Span Interactions
Price vs. Chikou → 2 Points
Chikou vs. Kumo → 0.5 Points
Chikou Consolidation → 0.5 Points
Senkou Span Analysis
Senkou A vs. Senkou B → 2 Points
Senkou Slope → 0.5 Points
Price vs. Key Levels
Price vs. Tenkan → 2 Points
Price vs. Kijun → 2 Points
Interpreting the Score
The aggregate score functions as an oscillator, fluctuating between a range of ±16.0.
A higher score indicates strong bullish momentum.
A lower score suggests bearish market conditions.
To enhance readability and smooth fluctuations, a 9-period SMA is applied to the score.
Application in Algorithmic Trading
This scoring system helps integrate Ichimoku Cloud principles into algorithmic trading strategies by providing a structured and quantifiable method for assessing market conditions.
Would love to hear your feedback! 🚀 Let me know how this system works for you.

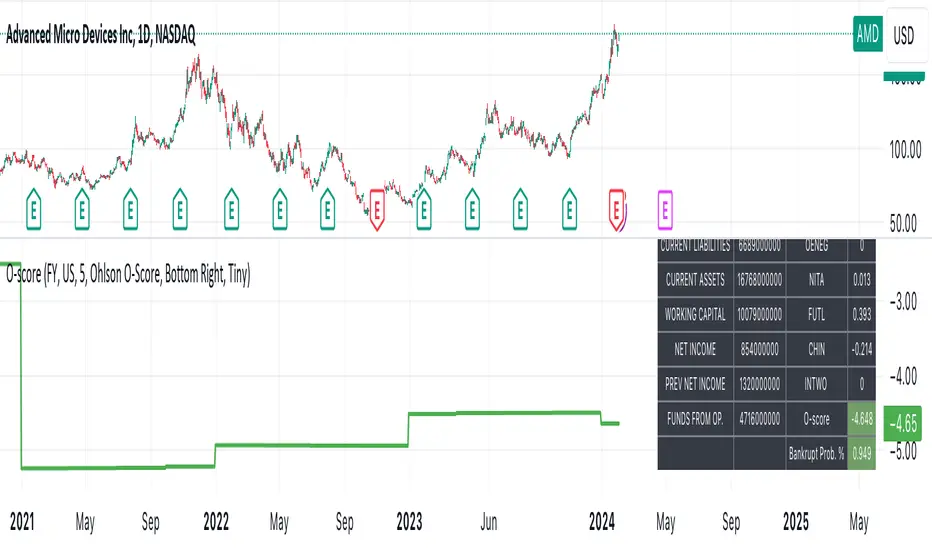
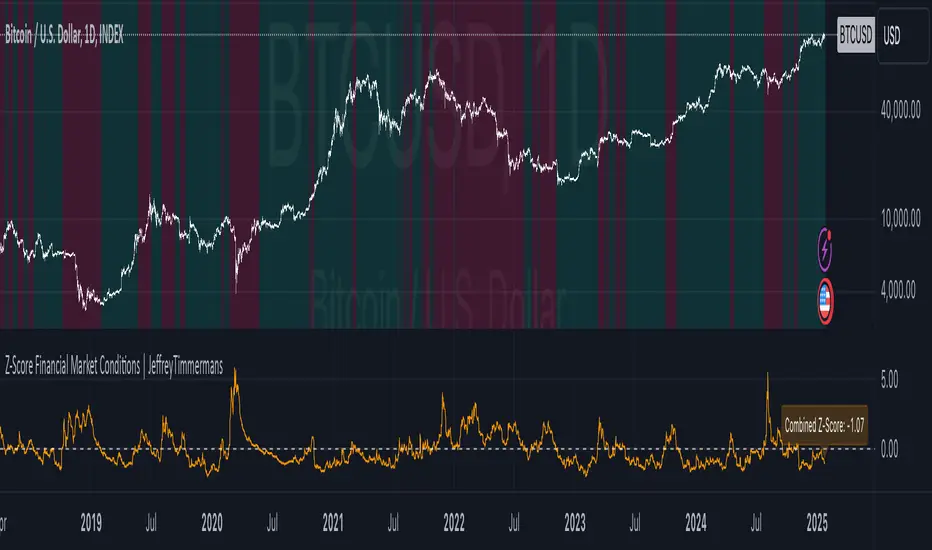
Z-Score Financial Market Conditions | JeffreyTimmermansZ-Score Financial Market Conditions
The Z-Score Financial Market Conditions indicator is a cutting-edge tool for measuring financial market stress and relaxation by combining eight critical financial metrics into a single composite Z-score. This dynamic indicator provides traders and analysts with actionable insights into the overall state of the financial markets, enabling informed decision-making across various trading and investment systems.
Purpose of the Indicator
This indicator serves as a comprehensive gauge of financial market conditions, offering a clear visualization of whether the markets are in a state of stress (elevated risks) or relaxation (normalized conditions). The Z-Score Financial Market Conditions tool is particularly effective for:
Macro-Level Risk Assessment: Identifying periods of high market stress or calmness.
Trend Following Systems: Gauging the market's underlying conditions to validate trends.
Mean Reversion Strategies: Using extreme Z-score levels to detect potential reversals.
Portfolio Risk Management: Adjusting asset exposure based on market-wide financial conditions.
This indicator works exclusively on the 1-day timeframe, as it is calibrated to analyze daily changes in the financial metrics that drive market behavior.
The Eight Key Components and Their Importance
The composite Z-score integrates the Z-scores of the following eight financial metrics. These metrics have been selected for their complementary insights into various aspects of financial market conditions:
VIX (S&P 500 Volatility Index)
Reflects implied volatility in the U.S. equity market.
High VIX values indicate increased uncertainty and risk aversion among market participants.
MOVE (US Treasury Bond Volatility Index)
Captures volatility in U.S. Treasury bonds.
Essential for understanding risk in fixed-income markets, which significantly impact broader economic conditions.
ICE BofA High Yield Option Adjusted Spread (BAMLH0A0HYM2)
Measures the risk premium for high-yield corporate bonds.
Rising spreads suggest increased credit risk and potential economic stress.
ICE BofA Corporate Index Option Adjusted Spread (BAMLC0A0CM)
Tracks credit spreads in the investment-grade bond market.
Helps evaluate the health of higher-quality corporate debt, a key indicator of financial stability.
ICE BofA US High Yield Index Spread (BAMLH0A0HYM2)
Focuses on high-yield U.S. corporate bonds.
Provides localized insights into U.S. credit conditions and risk levels.
CDS (Credit Default Swap Spreads)
Measures the cost of insuring against bond defaults.
Rising CDS spreads signal growing concern over creditworthiness, often a leading indicator of financial stress.
Global Bond Spread (AGG)
Represents global fixed-income spreads.
Offers a broader perspective on international financial conditions beyond the U.S. market.
TED Spread (Treasury-EuroDollar Spread)
The difference between interbank lending rates and short-term U.S. Treasury yields.
Widely regarded as an indicator of systemic risk in the banking sector.
Features and Improvements
This script builds upon the original concept by introducing advanced features to enhance its precision and usability:
Lookback Period Adjustment
A customizable lookback period for Z-score calculations (default: 160 days).
Allows for greater flexibility in adapting to different market conditions.
Moving Average (MA) Smoothing
Optional smoothing of Z-scores using an exponential moving average (EMA) for enhanced clarity.
Default smoothing length: 8 days.
Individual Component Visibility
Plots for individual Z-scores can be enabled or disabled to focus on specific metrics.
Dynamic Background Coloring
Visual cues to indicate bullish (green) or bearish (red) financial conditions based on the composite Z-score.
Custom Inputs
Toggle on/off for each financial metric to tailor the indicator to specific use cases.
Customizable parameters for smoothing and moving averages.
Applications
This indicator is versatile and can be effectively used in various trading systems and strategies:
Long-Term Investment Decision-Making: Assess macroeconomic trends for portfolio rebalancing.
Systematic Trading: Incorporate market conditions into algorithmic models to enhance robustness.
Volatility-Based Strategies: Use Z-score fluctuations to anticipate periods of market turbulence or calm.
Credits
This indicator was inspired by and builds upon the work of TomasOnMarkets . While incorporating significant enhancements, it acknowledges the foundational concepts provided by this original source. Thank you for sharing your input on this important indicator. We are honored to use it and to further improve upon it.
-Jeffrey
VWAP Valuation Model | JeffreyTimmermansVWAP Valuation Model
This indicator provides a powerful tool for traders looking to assess the value of an asset based on the VWAP (Volume Weighted Average Price) and the z-score. The VWAP Valuation Model is designed to give insights into the overbought or oversold condition of an asset by comparing the current price to a volume-weighted average over a defined period.
Key Features:
VWAP Baseline: The indicator calculates a volume-weighted moving average of the price, which serves as the core reference line for price analysis.
Z-Score: The z-score is calculated to determine how far the current price deviates from the mean, adjusted for volatility. This score helps identify overbought and oversold conditions.
Smoothing Option: Optionally, the indicator can be smoothed for better visualization, with the smoothing length being adjustable.
Real-time Data: The indicator provides real-time insights for multiple assets, such as Bitcoin (BTCUSD), Ethereum (ETHUSD), and Solana (SOLUSD), and can take the broader market performance (like the total crypto market) into account.
Z-Score Table: The indicator features an interactive table that provides valuable information on the z-scores of selected assets, allowing traders to quickly get an overview of market conditions. The table is strategically positioned above the chart for maximum visibility without interfering with the chart data.
Usage:
Overbought/Oversold: A z-score above +1.5 indicates overvaluation (overbought), while a score below -1.5 indicates undervaluation (oversold). This indicator helps in making informed trading decisions.
VWAP Range: The indicator offers a visual representation of the VWAP range, crucial for understanding price trends and market dynamics.
This indicator is ideal for investors interested in fundamental analysis while also needing technical insights to identify buy and sell opportunities. It helps to objectively assess market valuation and make well-informed decisions.
Important Note: This indicators works only in mean-reverting markets, not trending periods.
-Jeffrey

Z-Score + Valuation BTC | JeffreyTimmermansBTC Valuation Indicator with Z-Score Analysis
The BTC Valuation Indicator is a sophisticated tool designed to offer traders and analysts a deeper understanding of Bitcoin’s market valuation, empowering them to make more informed decisions. By utilizing a combination of key moving averages and a logarithmic trendline, along with advanced statistical analysis through the Z-Score Indicator, this tool provides a comprehensive view of Bitcoin’s potential undervaluation or overvaluation.
Key Features:
200MA/P (200-Day Moving Average to Price Ratio)
This component compares Bitcoin’s current price to its 200-day Simple Moving Average (SMA), offering insights into the long-term trend. A positive value signals a potential undervaluation of Bitcoin, while a negative value may indicate overvaluation.
Use case: Identifying long-term price trends to forecast potential buying or selling opportunities.
50MA/P (50-Day Moving Average to Price Ratio)
This ratio focuses on the short-term dynamics of Bitcoin’s price, comparing it to its 50-day SMA. It helps traders detect bullish or bearish trends in the immediate future.
Use case: Spotting short-term market movements and adjusting strategies accordingly.
LTL/P (Logarithmic TrendLine to Price Ratio)
This ratio incorporates Bitcoin’s historical age, using a logarithmic trendline to measure price movements against long-term expectations. A divergence from this trendline can signal potential overvaluation or undervaluation, assisting in aligning trading decisions with broader market trends.
Use case: Evaluating the overall trajectory of Bitcoin’s value over time and predicting significant market shifts.
Z-Score Indicator Integration:
The BTC Valuation Indicator utilizes the Z-Score, a powerful statistical measure, to assess how far each of the aforementioned ratios deviates from the mean. Z-Scores help standardize these ratios, allowing traders to gauge the severity of under or overvaluation compared to historical averages.
What is a Z-Score?
A Z-score measures how far a data point is from the mean in terms of standard deviations. A Z-score of 0 indicates the value is exactly at the mean, while a positive or negative score shows how much the value deviates from it. A higher Z-score signals a more significant deviation, potentially pointing to a market anomaly, while a Z-score near 0 indicates normal conditions.
For instance:
A Z-score above +2 indicates that Bitcoin may be overvalued, with the likelihood of a market correction or reversion to the mean.
A Z-score below -2 signals possible undervaluation, suggesting an upward trend may be on the horizon.
Z-Score and Market Volatility
The Z-Score Indicator can be used in conjunction with volatility measures, such as the CBOE Volatility Index (VIX), to forecast potential market volatility. Just as a Z-scored VIX above +2 suggests decreasing volatility and the possibility of an upward trend, a Z-scored VIX below -2 indicates increasing volatility and a potential downward trend. This parallel can be used to predict Bitcoin’s potential movements in times of market uncertainty.
How to Use:
The BTC Valuation Indicator, when paired with the Z-Score, provides a more refined statistical framework to analyze Bitcoin’s market conditions. This integration allows traders to assess the severity of potential trends and price anomalies, assisting in the identification of profitable entry and exit points.
Important Considerations:
No Guarantee of Market Predictions: While this indicator is a valuable tool for assessing market conditions, no indicator can guarantee future performance. Always consider multiple factors and use the indicator as part of a comprehensive strategy.
Market Dynamics:
As market conditions evolve, continuously refine your approach. Historical performance may not be indicative of future results, and traders should remain vigilant to changing trends and developments.
By combining the power of moving averages, logarithmic trend lines, and Z-scores, the BTC Valuation Indicator equips investors with a robust, data-driven approach to Bitcoin valuation, enhancing decision-making and enabling a more nuanced understanding of market dynamics.
-Jeffrey

Universal Trend and Valuation System [QuantAlgo]Universal Trend and Valuation System 📊🧬
The Universal Trend and Valuation System by QuantAlgo is an advanced indicator designed to assess asset valuation and trends across various timeframes and asset classes. This system integrates multiple advanced statistical indicators and techniques with Z-score calculations to help traders and investors identify overbought/sell and oversold/buy signals. By evaluating valuation and trend strength together, this tool empowers users to make data-driven decisions, whether they aim to follow trends, accumulate long-term positions, or identify turning points in mean-reverting markets.
💫 Conceptual Foundation and Innovation
The Universal Trend and Valuation System by QuantAlgo provides a unique framework for assessing market valuation and trend dynamics through a blend of Z-score analysis and trend-following algorithm. Unlike traditional indicators that only reflect price direction, this system incorporates multi-layered data to reveal the relative value of an asset, helping users determine whether it’s overvalued, undervalued, or approaching a trend reversal. By combining high quality trend-following tools, such as Dynamic Score Supertrend, DEMA RSI, and EWMA, it evaluates trend stability and momentum quality, while Z-scores of performance ratios like Sharpe, Sortino, and Omega standardize deviations from historical trends, enabling traders and investors to spot extreme conditions. This dual approach allows users to better identify accumulation (undervaluation) and distribution (overvaluation) phases, enhancing strategies like Dollar Cost Averaging (DCA) and overall timing for entries and exits.
📊 Technical Composition and Calculation
The Universal Trend-Following Valuation System is composed of several trend-following and valuation indicators that create a dynamic dual scoring model:
Risk-Adjusted Ratios (Sharpe, Sortino, Omega): These ratios assess trend quality by analyzing an asset’s risk-adjusted performance. Sharpe and Sortino provide insight into trend consistency and risk/reward, while Omega evaluates profitability potential, helping traders and investors assess how favorable a trend or an asset is relative to its associated risk.
Dynamic Z-Scores: Z-scores are applied to various metrics like Price, RSI, and RoC, helping to identify statistical deviations from the mean, which indicate potential extremes in valuation. By combining these Z-scores, the system produces a cumulative score that highlights when an asset may be overbought or oversold.
Aggregated Trend-Following Indicators: The model consolidates multiple high quality indicators to highlight probable trend shifts. This helps confirm the direction and strength of market moves, allowing users to spot reversals or entry points with greater clarity.
📈 Key Indicators and Features
The Universal Trend and Valuation System combines various technical and statistical tools to deliver a well-rounded analysis of market trends and valuation:
The indicator utilizes trend-following indicators like RSI with DEMA smoothing and Dynamic Score Supertrend to minimize market noise, providing clearer and more stable trend signals. Sharpe, Sortino, and Omega ratios are calculated to assess risk-adjusted performance and volatility, adding a layer of analysis for evaluating trend quality. Z-scores are applied to these ratios, as well as Price and Rate of Change (RoC), to detect deviations from historical trends, highlighting extreme valuation levels.
The system also incorporates multi-layered visualization with gradient color coding to signal valuation states across different market conditions. These adaptive visual cues, combined with threshold-based alerts for overbought and oversold zones, help traders and investors track probable trend reversals or continuations and identify accumulation or distribution zones, adding reliability to both trend-following and mean-reversion strategies.
⚡️ Practical Applications and Examples
✅ Add the Indicator: Add the Universal Trend-Following Valuation System to your favourites and to your chart.
👀 Monitor Trend Shifts and Valuation Levels: Watch the average Z score, trend probability state and gradient colors to identify overbought and oversold conditions. During undervaluation, consider using a DCA strategy to gradually accumulate positions (buy), while overvaluation may signal distribution or profit-taking phases (sell).
🔔 Set Alerts: Configure alerts for significant trend or valuation changes, ensuring you can act on market movements promptly, even when you’re not actively monitoring the charts.
🌟 Summary and Usage Tips
The Universal Trend and Valuation System by QuantAlgo is a highly adaptable tool, designed to support both trend-following and valuation analysis across different market environments. By combining valuation metrics with high quality trend-following indicators, it helps traders and investors identify the relative value of an asset based on historical norms, providing more reliable overbought/sell and oversold/buy signals. The tool’s flexibility across asset types and timeframes makes it ideal for both short-term trading and long-term investment strategies like DCA, allowing users to capture meaningful trends while minimizing noise.

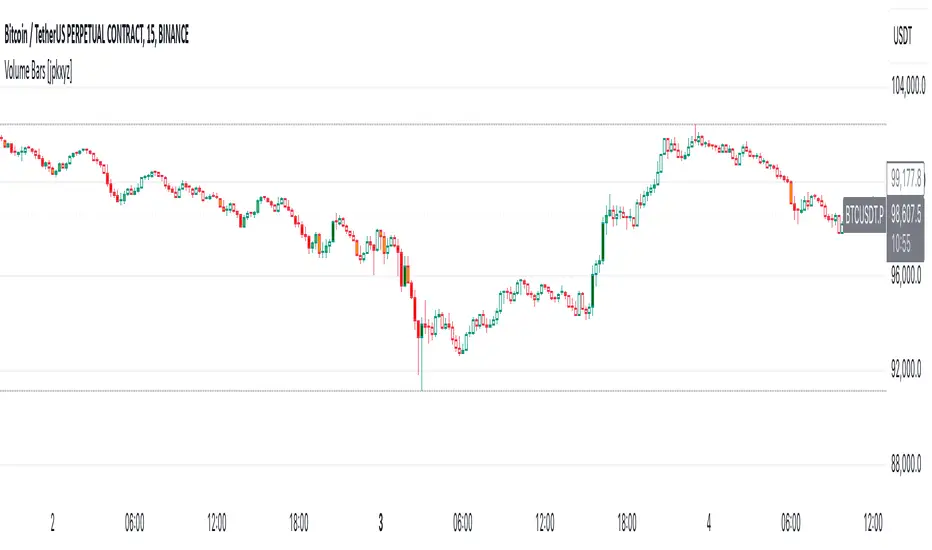
Volume Bars [jpkxyz]
Multi-Timeframe Volume indicator by @jpkxyz
This script is a Multi-Timeframe Volume Z-Score Indicator. It dynamically calculates /the Z-Score of volume over different timeframes to assess how significantly current
volume deviates from its historical average. The Z-Score is computed for each
timeframe independently and is based on a user-defined lookback period. The
script switches between timeframes automatically, adapting to the chart's current
timeframe using `timeframe.multiplier`.
The Z-Score formula used is: (current volume - mean) / standard deviation, where
mean and standard deviation are calculated over the lookback period.
The indicator highlights periods of "significant" and "massive" volume by comparing
the Z-Score to user-specified thresholds (`zScoreThreshold` for significant volume
and `massiveZScoreThreshold` for massive volume). The script flags buy or sell
conditions based on whether the current close is higher or lower than the open.
Visual cues:
- Dark Green for massive buy volume.
- Red for massive sell volume.
- Green for significant buy volume.
- Orange for significant sell volume.
- Gray for normal volume.
The script also provides customizable alert conditions for detecting significant or massive buy/sell volume events, allowing users to set real-time alerts.
Z-Score RSI StrategyOverview
The Z-Score RSI Indicator is an experimental take on momentum analysis. By applying the Relative Strength Index (RSI) to a Z-score of price data, it measures how far prices deviate from their mean, scaled by standard deviation. This isn’t your traditional use of RSI, which is typically based on price data alone. Nevertheless, this unconventional approach can yield unique insights into market trends and potential reversals.
Theory and Interpretation
The RSI calculates the balance between average gains and losses over a set period, outputting values from 0 to 100. Typically, people look at the overbought or oversold levels to identify momentum extremes that might be likely to lead to a reversal. However, I’ve often found that RSI can be effective for trend-following when observing the crossover of its moving average with the midline or the crossover of the RSI with its own moving average. These crossovers can provide useful trend signals in various market conditions.
By combining RSI with a Z-score of price, this indicator estimates the relative strength of the price’s distance from its mean. Positive Z-score trends may signal a potential for higher-than-average prices in the near future (scaled by the standard deviation), while negative trends suggest the opposite. Essentially, when the Z-Score RSI indicates a trend, it reflects that the Z-score (the distance between the average and current price) is likely to continue moving in the trend’s direction. Generally, this signals a potential price movement, though it’s important to note that this could also occur if there’s a shift in the mean or standard deviation, rather than a meaningful change in price itself.
While the Z-Score RSI could be an insightful addition to a comprehensive trading system, it should be interpreted carefully. Mean shifts may validate the indicator’s predictions without necessarily indicating any notable price change, meaning it’s best used in tandem with other indicators or strategies.
Recommendations
Before putting this indicator to use, conduct thorough backtesting and avoid overfitting. The added parameters allow fine-tuning to fit various assets, but be careful not to optimize purely for the highest historical returns. Doing so may create an overly tailored strategy that performs well in backtests but fails in live markets. Keep it balanced and look for robust performance across multiple scenarios, as overfitting is likely to lead to disappointing real-world results.

Fetch Z-scoreThis script is enspired by the creator of the Z-score probability indicator made by www.tradingview.com
I took his calculation for the z-score and created my own strategy based on that z-score.
What is z-score? The Z-score represents how far the current price deviates from the moving average, measured in terms of standard deviations
What does this script do with the Z-score?
The script offers several customizable options, including displaying buy and sell signals based on Z-score thresholds and overlaying these signals directly on the chart or below/above the bars.
The idea is that when the Z-score exceeds a certain treshold, a count will start. The count will lead to a signal. For example: Say the Z-score dipped below -1. From there, the script will by default count whether the current Z-score is higher than the Z-score of the past 10 datapoints. If so, a buy signal will be printed on the chart. The idea is that the Z-score will creep up after a low, making sure you buy earyly in the new uptrend, making this a trend followiung system, with early trend detection.
You can choose whether you want the buy and sell signals on the seperate pane, or on the chart by toggeling a simple setting.
What are my favorite settings?
- Timeframe: weekly
- SMA Length: 75
- Z score buy treshold: -1.5
- Z score sell treshold: 3
- Lookback buy period: 20
- Lookback sell period: 20

HMA Z-Score Probability Indicator by Erika BarkerThis indicator is a modified version of SteverSteves's original work, enhanced by Erika Barker. It visually represents asset price movements in terms of standard deviations from a Hull Moving Average (HMA), commonly known as a Z-Score.
Key Features:
Z-Score Calculation: Measures how many standard deviations the current price is from its HMA.
Hull Moving Average (HMA): This moving average provides a more responsive baseline for Z-Score calculations.
Flexible Display: Offers both area and candlestick visualization options for the Z-Score.
Probability Zones: Color-coded areas showing the statistical likelihood of prices based on their Z-Score.
Dynamic Price Level Labels: Displays actual price levels corresponding to Z-Score values.
Z-Table: An optional table showing the probability of occurrence for different Z-Score ranges.
Standard Deviation Lines: Horizontal lines at each standard deviation level for easy reference.
How It Works:
The indicator calculates the Z-Score by comparing the current price to its HMA and dividing by the standard deviation. This Z-Score is then plotted on a separate pane below the main chart.
Green areas/candles: Indicate prices above the HMA (positive Z-Score)
Red areas/candles: Indicate prices below the HMA (negative Z-Score)
Color-coded zones:
Green: Within 1 standard deviation (high probability)
Yellow: Between 1 and 2 standard deviations (medium probability)
Red: Beyond 2 standard deviations (low probability)
The HMA line (white) shows the trend of the Z-Score itself, offering insight into whether the asset is becoming more or less volatile over time.
Customization Options:
Adjust lookback periods for Z-Score and HMA calculations
Toggle between area and candlestick display
Show/hide probability fills, Z-Table, HMA line, and standard deviation bands
Customize text color and decimal rounding for price levels
Interpretation:
This indicator helps traders identify potential overbought or oversold conditions based on statistical probabilities. Extreme Z-Score values (beyond ±2 or ±3) often suggest a higher likelihood of mean reversion, while consistent Z-Scores in one direction may indicate a strong trend.
By combining the Z-Score with the HMA and probability zones, traders can gain a nuanced understanding of price movements relative to recent trends and their statistical significance.

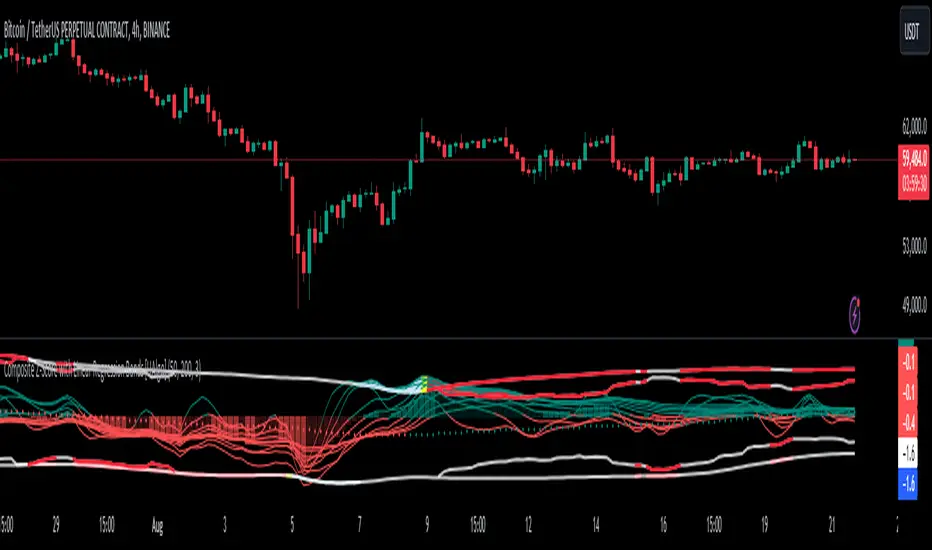
Composite Z-Score with Linear Regression Bands [UAlgo]The Composite Z-Score with Linear Regression Bands is a technical indicator designed to provide traders with a comprehensive analysis of price momentum, volatility, and volume. By combining multiple moving averages with slope analysis, volume/volatility compression-expansion metrics, and Z-Score calculations, this indicator aims to highlight potential breakout and breakdown points with high accuracy. The inclusion of linear regression bands further enhances the analysis by providing dynamic support and resistance levels, which adapt to market conditions. This makes the indicator particularly useful in identifying overbought/oversold conditions, volume squeezes, and the overall direction of the trend.
🔶 Key Features
Multi-Length Slope Calculation: The indicator uses multiple Hull Moving Averages (HMA) across various lengths to calculate slope angles, which are then converted into Z-Scores. This helps in capturing both short-term and long-term price momentum.
Volume/Volatility Composite Analysis: By calculating a composite value derived from both volume and volatility, the indicator identifies periods of compression (squeezes) and expansion, which are crucial for detecting potential breakout opportunities.
Linear Regression Bands: The inclusion of dynamic linear regression bands provides traders with adaptive support and resistance levels. These bands are enhanced by the composite value, which adjusts the band width based on market conditions, offering a clearer view of possible price reversals.
Overbought/Oversold Detection: The indicator highlights overbought and oversold conditions by comparing Z-Scores against the upper and lower bounds of the regression bands, which can signal potential reversal points.
Customizable Inputs: Users can customize key parameters such as the lengths of the moving averages, the regression band period, and the number of deviations used for the bands, allowing for flexibility in adapting the indicator to different market environments.
🔶 Interpreting the Indicator
Z-Score Plots: The individual Z-Score plots represent the normalized slope of the Hull Moving Averages over different periods. Positive values indicate upward momentum, while negative values suggest downward momentum. The combined Z-Sum provides a broader view of the overall market momentum.
Composite Value: The composite value is a ratio of volume to volatility, which highlights periods of market compression and expansion. When the composite value rises, it suggests increasing market activity, often preceding a breakout.
Why are we calculating values for multiple lengths?
The Composite Z-Score with Linear Regression Bands indicator employs a multi-timeframe analysis by calculating Z-scores for various moving average lengths. This approach provides a more comprehensive view of market dynamics and helps to identify trends and potential reversals across different timeframes. By considering multiple lengths, we can:
Capture a broader range of market behaviors: Different moving average lengths capture different aspects of price movement. Shorter lengths are more sensitive to recent price changes, while longer lengths provide a smoother representation of the underlying trend.
Reduce the impact of noise: By combining Z-scores from multiple lengths, we can help to filter out some of the noise that can be present in shorter-term data and obtain a more robust signal.
Enhance the reliability of signals: When Z-scores from multiple lengths align, it can increase the confidence in the identified trend or potential reversal. This can help to reduce the likelihood of false signals.
In essence, calculating values for multiple lengths allows the indicator to provide a more nuanced and reliable assessment of market conditions, making it a valuable tool for traders and analysts.
Linear Regression Bands: The central line represents the linear regression of the Z-Sum, while the upper and lower bands represent the dynamic resistance and support levels, respectively. The deviation from the regression line indicates the strength of the current trend. When price moves beyond these bands, it may signal an overbought (above upper band) or oversold (below lower band) condition.
Volume/Volatility Squeeze: When the price moves between the regression bands and the volume/volatility-adjusted bands, the market is in a squeeze. Breakouts from this squeeze can lead to significant price moves, which are indicated by the filling of areas between the Z-Score plots and the bands.
Color Interpretation: The indicator uses color changes to make it easier to interpret the data. Teal colors generally indicate upward momentum or strong conditions, while red suggests downward momentum or weakening conditions. The intensity of the color reflects the strength of the signal.
Overbought/Oversold Signals: The indicator marks potential overbought and oversold conditions when Z-Scores cross above or below the upper and lower regression bands, respectively. These signals are crucial for identifying potential reversal points in the market.
🔶 Disclaimer
Use with Caution: This indicator is provided for educational and informational purposes only and should not be considered as financial advice. Users should exercise caution and perform their own analysis before making trading decisions based on the indicator's signals.
Not Financial Advice: The information provided by this indicator does not constitute financial advice, and the creator (UAlgo) shall not be held responsible for any trading losses incurred as a result of using this indicator.
Backtesting Recommended: Traders are encouraged to backtest the indicator thoroughly on historical data before using it in live trading to assess its performance and suitability for their trading strategies.
Risk Management: Trading involves inherent risks, and users should implement proper risk management strategies, including but not limited to stop-loss orders and position sizing, to mitigate potential losses.
No Guarantees: The accuracy and reliability of the indicator's signals cannot be guaranteed, as they are based on historical price data and past performance may not be indicative of future results.
Buy-Sell-Hold RecommendationsDescription:
The indicator displays "recommendations" for the active symbol (Buy, Strong buy, Sell, Strong sell or Hold), based on the Tradingview's recommendations data. There are 3 presentations you can choose from:
- Bar -> displays a vertical/horizontal bar with sections for each rating
- Pie chart -> displays a pie chart with sections
- Table -> displays a table with score for each recommendation
Inputs:
- Display mode -> data presentation mode
- Position -> position of the bar/pie chart/table
- Highlight the highest rating -> recommendation(s) with highest score will be highlighted
- Buy, Strong buy, Sell, etc. -> colors of the "bar" sections
- Pixel Width, Pixel Height, etc. -> size of each "pixel" (cell) of the pie chart
- Resolution (X), Resolution (Y) -> how many pixels (cells) the pie chart has on each axis
- Inner area size (%) -> size of the empty space at the center of the pie chart
- Invert theme -> invert coloring scheme for "table" presentation mode
Notes:
- Tradingview seems to provide the recommendations only for major stocks
- Data is taken directly from Tradingview and is based on opinions of "analysts"

TrendMaster ProTrendMaster Pro: A Comprehensive Trend Analysis Tool for Long-Term Investors
TrendMaster Pro is an advanced technical indicator designed to provide long-term investors with a robust and comprehensive analysis of market trends. This sophisticated tool operates exclusively on daily timeframes, making it ideal for those focused on long-term investment strategies. By combining multiple analytical approaches, TrendMaster Pro offers investors a powerful means to assess trend quality and make informed decisions.
Automatic Trend Detection
At the heart of TrendMaster Pro lies its ability to automatically identify the most statistically significant trend. The indicator analyzes various timeframes ranging from 1000 to 5000 days, selecting the one that exhibits the highest correlation. This feature ensures that investors are always working with the most relevant trend data, eliminating the subjectivity often associated with manual trend identification.
The trend detection algorithm employs a regression analysis approach, evaluating approximately 80,000 different trend alternatives each day. Each potential trend is assigned a score based on criteria such as trend density, deviation from regression, and the number of price points near the trend's floor and ceiling. The trend with the highest score is then selected and displayed on the chart.
Comprehensive Scoring System
TrendMaster Pro employs a multi-faceted scoring system that evaluates four key aspects of a trend, providing a holistic view of its quality and potential. Each aspect is scored on a scale of 0 to 10, with the overall trend quality score being a weighted average of these individual scores.
1. Length Score
The Length Score measures the duration of the detected trend. Longer trends receive higher scores, reflecting increased reliability and significance. This score is calculated by normalizing the auto-selected period (which ranges from 1000 to 5000 days) to a scale of 5 to 10.
For example, if the auto-selected period is 3000 days, it would receive a score of around 7.5. This emphasizes the importance of long-term trends in investment decision-making, as they tend to be more stable and indicative of underlying market forces.
2. Strength Score
The Strength Score utilizes Pearson's Correlation Coefficient to assess trend strength. This statistical measure gauges the linear relationship between price and trend projection. A value closer to 1 indicates a strong positive correlation, reinforcing confidence in the trend direction based on historical price movements.
The indicator translates the Pearson's Correlation Coefficient into a score from 0 to 10. For instance, a correlation coefficient of 0.95 might translate to a Strength Score of 8, indicating a strong and reliable trend.
3. Performance Score
The Performance Score compares the asset's Compound Annual Growth Rate (CAGR) to a chosen benchmark, typically a major index like the S&P 500. This score provides insight into how well the asset is performing relative to the broader market.
The CAGR is calculated using the formula: CAGR = (Ending Value / Beginning Value)^(1/n) - 1, where n is the number of years. The Performance Score is then determined by comparing this CAGR to the benchmark's CAGR over the same period. A higher score indicates outperformance relative to the benchmark.
4. Level Score
The Level Score evaluates the current price position within the trend channel. Lower prices within the channel receive higher scores, suggesting potential value or buying opportunities. This score helps identify possible entry points based on historical trend behavior.
For example, if the current price is near the lower boundary of the trend channel, it might receive a Level Score of 9, indicating a potentially attractive entry point.
Visual Representation
TrendMaster Pro provides a clear visual representation of the detected trend by displaying a regression channel on the chart. This channel consists of three lines: a middle line representing the main trend, and upper and lower lines representing standard deviations from the main trend.
The channel offers a quick visual reference for support and resistance levels, helping investors identify potential entry and exit points. The color and style of these lines can be customized to suit individual preferences.
Detailed Information Table
A comprehensive table presents all scores and relevant data, allowing for quick and easy interpretation of the trend analysis. This table includes:
The auto-selected trend length
The Pearson's Correlation Coefficient
The asset's CAGR and the benchmark's CAGR
Individual scores for Length, Strength, Performance, and Level
The overall Trend Quality Score
This table provides investors with a clear, at-a-glance summary of the trend's key characteristics and quality.
Practical Application
To use TrendMaster Pro effectively, investors should consider the following:
Focus on the overall Trend Quality Score as a primary indicator of trend strength and reliability.
Use the Length Score to gauge the trend's longevity and potential stability.
Pay attention to the Strength Score to assess how well the price action aligns with the identified trend.
Utilize the Performance Score to compare the asset's performance against the broader market.
Consider the Level Score when timing entries, looking for opportunities when prices are relatively low within the trend channel.
Use the visual trend channel as a guide for potential support and resistance levels.
Limitations and Considerations
While TrendMaster Pro offers powerful insights, it's important to remember that no indicator can predict future market movements with certainty. The tool should be used in conjunction with fundamental analysis and other market information.
Additionally, as the indicator is designed for daily charts and long-term analysis, it may not be suitable for short-term trading strategies. Users should also be aware that past performance does not guarantee future results, even with strong trend indications.
Conclusion
TrendMaster Pro represents a significant advancement in trend analysis for long-term investors. By combining automatic trend detection, comprehensive scoring, and benchmark comparison, it offers a powerful tool for those seeking to make informed, data-driven investment decisions. Its ability to objectively assess trend quality across multiple dimensions provides investors with a valuable edge in navigating complex market conditions.
For investors looking to deepen their understanding of market trends and enhance their long-term investment strategies, TrendMaster Pro offers a sophisticated yet accessible solution. As with any investment tool, users are encouraged to thoroughly familiarize themselves with its features and interpret its outputs in the context of their overall investment approach.

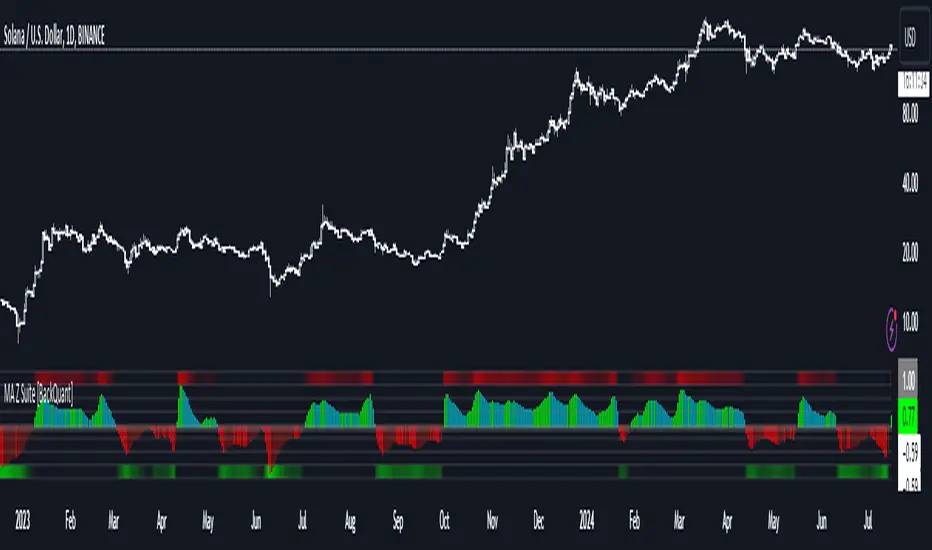
Moving Average Z-Score Suite [BackQuant]Moving Average Z-Score Suite
1. What is this indicator
The Moving Average Z-Score Suite is a versatile indicator designed to help traders identify and capitalize on market trends by utilizing a variety of moving averages. This indicator transforms selected moving averages into a Z-Score oscillator, providing clear signals for potential buy and sell opportunities. The indicator includes options to choose from eleven different moving average types, each offering unique benefits and characteristics. It also provides additional features such as standard deviation levels, extreme levels, and divergence detection, enhancing its utility in various market conditions.
2. What is a Z-Score
A Z-Score is a statistical measurement that describes a value's relationship to the mean of a group of values. It is measured in terms of standard deviations from the mean. For instance, a Z-Score of 1.0 means the value is one standard deviation above the mean, while a Z-Score of -1.0 indicates it is one standard deviation below the mean. In the context of financial markets, Z-Scores can be used to identify overbought or oversold conditions by determining how far a particular value (such as a moving average) deviates from its historical mean.
3. What moving averages can be used
The Moving Average Z-Score Suite allows users to select from the following eleven moving averages:
Simple Moving Average (SMA)
Hull Moving Average (HMA)
Exponential Moving Average (EMA)
Weighted Moving Average (WMA)
Double Exponential Moving Average (DEMA)
Running Moving Average (RMA)
Linear Regression Curve (LINREG) (This script can be found standalone )
Triple Exponential Moving Average (TEMA)
Arnaud Legoux Moving Average (ALMA)
Kalman Hull Moving Average (KHMA)
T3 Moving Average
Each of these moving averages has distinct properties and reacts differently to price changes, allowing traders to select the one that best fits their trading style and market conditions.
4. Why Turning a Moving Average into a Z-Score is Innovative and Its Benefits
Transforming a moving average into a Z-Score is an innovative approach because it normalizes the moving average values, making them more comparable across different periods and instruments. This normalization process helps in identifying extreme price movements and mean-reversion opportunities more effectively. By converting the moving average into a Z-Score, traders can better gauge the relative strength or weakness of a trend and detect potential reversals. This method enhances the traditional moving average analysis by adding a statistical perspective, providing clearer and more objective trading signals.
5. How It Can Be Used in the Context of a Trading System
In a trading system, it can be used to generate buy and sell signals based on the Z-Score values. When the Z-Score crosses above zero, it indicates a potential buying opportunity, suggesting that the price is above its mean and possibly trending upward. Conversely, a Z-Score crossing below zero signals a potential selling opportunity, indicating that the price is below its mean and might be trending downward. Additionally, the indicator's ability to show standard deviation levels and extreme levels helps traders set profit targets and stop-loss levels, improving risk management and trade planning.
6. How It Can Be Used for Trend Following
For trend-following strategies, it can be particularly useful. The Z-Score oscillator helps traders identify the strength and direction of a trend. By monitoring the Z-Score and its rate of change, traders can confirm the persistence of a trend and make informed decisions to enter or exit trades. The indicator's divergence detection feature further enhances trend-following by identifying potential reversals before they occur, allowing traders to capitalize on trend shifts. By providing a clear and quantifiable measure of trend strength, this indicator supports disciplined and systematic trend-following strategies.
No backtests for this indicator due to the many options and ways it can be used,
Enjoy
MVRV-Z adjusted EN version (by ilyaevp95)Descriptions:
The MVRV Z-Score indicator is a powerful tool designed by original authors Murad Mahmudov and David Puell for BTC to help traders make informed decisions about their cryptocurrency investments. It is based on the MVRV (Market Value to Realized Value) metric, which measures the relationship between the market capitalization and the realized capitalization of a cryptocurrency. The indicator provides signals for accumulating or selling an asset based on deviations in market capitalization from realized capitalization.
How it works:
Market Capitalization : This is the total value of coins that have been issued at a given point in time. Market capitalization is calculated by multiplying the current price of the asset by the number of coins that have been issued.
Realized Capitalization (Realized Price) : This is the amount of money that has been spent on purchasing a particular asset. In the context of cryptocurrencies, it represents the sum of all transaction values for a specific blockchain. Realized capitalization can be calculated using historical data on transaction prices.
MVRV Metric : The MVRV metric compares market capitalization with realized capitalization, providing a measure of how overvalued or undervalued a cryptocurrency is relative to its historical transaction data. A high MVRV value indicates that the market is overvaluing the asset, while a low MVRV suggests undervaluation.
Z-Score Calculation : The Z-score is a statistical measure that normalizes the deviation of market capitalization from its mean value (realized capitalization) to a standard deviation. This makes it possible to compare assets that have different values and time periods, as it takes into account the volatility of the market.
Note: For accurate Z-score calculation, you need to use the indicator on a chart with a mostly complete historical data set for a specific cryptocurrency.
Signals : Based on the Z-score, the indicator generates signals for accumulation or sale. If the Z-score falls below a certain threshold (negative), it may indicate an opportunity to accumulate the asset. Conversely, if the Z-score rises above a positive threshold, it could suggest a potential sell signal.
The indicator uses a color-coded system to provide traders with visual cues:
Green background indicates a signal to accumulate.
Orange (Red) background indicates a signal to sell.
Deviations exceeding the specified thresholds by 1 and 2 Z (positive direction), 0.5 and 1 Z (negative direction) are highlighted in a brighter color, indicating more extreme deviations.
Note: The signals provided by this indicator should not be considered financial advice. Traders should conduct their own research (DYOR) before making any investment decisions.
Parameters: The indicator provides several parameters for customization:
Blockchain : The blockchain for which the analysis is performed. This allows the user to select the specific blockchain they are interested in analyzing. The default value is BTC.
Z threshold for positive deviations : This parameter sets the threshold above which the deviation will be considered positive. A higher value will result in fewer signals, while a lower value may generate more false signals. The default value is 3.0.
Z threshold for negative deviations : Similar to the previous parameter, this sets the threshold below which the deviation will be considered negative. The default value is 0.
Market Capitalization : There are two types of market capitalization available: Standard and Free float coin capitalization. Free float is calculated by multiplying its current price by the total number of units in free circulation - the number that are not locked in any contracts or other forms of restriction. For DASH, ZEC, BAT and ALGO available only Free float capitalization. The default value is "Standard"
Negative Deviation Filter Mode : When enabled, if the deviation has been positive for a certain number of previous weeks (the default value is 40 weeks), the indicator will not generate a signal to accumulate. This helps to avoid false signals during the start of a bearish market. This may be helpful for volatile coins, whose price can drastically fall below the realized price after the end of a bull market. The default setting is "disabled".
Display Options:
MVRV plot : Displays the MVRV metric for the selected blockchain.
Z-Score plot : Shows the Z-score calculated by the indicator.
Realized Price plot : Provides a visual representation of the realized price of the cryptocurrency on main chart.
S ignal Display : Choose whether to display signals on the main chart or in a separate panel.
Historical mode : Choose whether to show signals for all historical data on the chart or for a certain number of periods. The default setting is "disabled".

Global Financial IndexIntroducing the "Global Financial Index" indicator on TradingView, a meticulously crafted tool derived from extensive research aimed at providing the most comprehensive assessment of a company's financial health, profitability, and valuation. Developed with the discerning trader and investor in mind, this indicator amalgamates a diverse array of financial metrics, meticulously weighted and balanced to yield optimal results.
Financial Strength:
Financial strength is a cornerstone of a company's stability and resilience in the face of economic challenges. It encompasses various metrics that gauge the company's ability to meet its financial obligations, manage its debt, and generate sustainable profits. In our Global Financial Index indicator, the evaluation of financial strength is meticulously crafted to provide investors with a comprehensive understanding of a company's fiscal robustness. Let's delve into the key components and the rationale behind their inclusion:
1. Current Ratio:
The Current Ratio serves as a vital indicator of a company's liquidity position by comparing its current assets to its current liabilities.
A ratio greater than 1 indicates that the company possesses more short-term assets than liabilities, suggesting a healthy liquidity position and the ability to meet short-term obligations promptly.
By including the Current Ratio in our evaluation, we emphasize the importance of liquidity management in sustaining business operations and weathering financial storms.
2. Debt to Equity Ratio:
The Debt to Equity Ratio measures the proportion of a company's debt relative to its equity, reflecting its reliance on debt financing versus equity financing.
A higher ratio signifies higher financial risk due to increased debt burden, potentially leading to liquidity constraints and solvency issues.
Incorporating the Debt to Equity Ratio underscores the significance of balancing debt levels to maintain financial stability and mitigate risk exposure.
3. Interest Coverage Ratio:
The Interest Coverage Ratio assesses a company's ability to service its interest payments with its operating income.
A higher ratio indicates a healthier financial position, as it implies that the company generates sufficient earnings to cover its interest expenses comfortably.
By evaluating the Interest Coverage Ratio, we gauge the company's capacity to manage its debt obligations without compromising its profitability or sustainability.
4. Altman Z-Score:
The Altman Z-Score, developed by Edward Altman, is a composite metric that predicts the likelihood of a company facing financial distress or bankruptcy within a specific timeframe.
It considers multiple financial ratios, including liquidity, profitability, leverage, and solvency, to provide a comprehensive assessment of a company's financial health.
The Altman Z-Score categorizes companies into distinct risk groups, allowing investors to identify potential warning signs and make informed decisions regarding investment or credit exposure.
By integrating the Altman Z-Score, we offer a nuanced perspective on a company's financial viability and resilience in turbulent market conditions.
Profitability Rank:
Profitability rank is a crucial aspect of investment analysis that evaluates a company's ability to generate profits relative to its peers and industry benchmarks. It involves assessing various profitability metrics to gauge the efficiency and effectiveness of a company's operations and management. In our Global Financial Index indicator, the profitability rank segment is meticulously designed to provide investors with a comprehensive understanding of a company's profitability dynamics. Let's delve into the key components and rationale behind their inclusion:
1. Return on Equity (ROE):
Return on Equity measures a company's net income generated relative to its shareholders' equity.
A higher ROE indicates that a company is generating more profits with its shareholders' investment, reflecting efficient capital utilization and strong profitability.
By incorporating ROE, we assess management's ability to generate returns for shareholders and evaluate the overall profitability of the company's operations.
2. Gross Profit Margin:
Gross Profit Margin represents the percentage of revenue retained by a company after accounting for the cost of goods sold (COGS).
A higher gross profit margin indicates that a company is effectively managing its production costs and pricing strategies, leading to greater profitability.
By analyzing gross profit margin, we evaluate a company's pricing power, cost efficiency, and competitive positioning within its industry.
3. Operating Profit Margin:
Operating Profit Margin measures the percentage of revenue that remains after deducting operating expenses, such as salaries, rent, and utilities.
A higher operating profit margin signifies that a company is efficiently managing its operating costs and generating more profit from its core business activities.
By considering operating profit margin, we assess the underlying profitability of a company's operations and its ability to generate sustainable earnings.
4. Net Profit Margin:
Net Profit Margin measures the percentage of revenue that remains as net income after deducting all expenses, including taxes and interest.
A higher net profit margin indicates that a company is effectively managing its expenses and generating greater bottom-line profitability.
By analyzing net profit margin, we evaluate the overall profitability and financial health of a company, taking into account all expenses and income streams.
Valuation Rank:
Valuation rank is a fundamental aspect of investment analysis that assesses the attractiveness of a company's stock price relative to its intrinsic value. It involves evaluating various valuation metrics to determine whether a stock is undervalued, overvalued, or fairly valued compared to its peers and the broader market. In our Global Financial Index indicator, the valuation rank segment is meticulously designed to provide investors with a comprehensive perspective on a company's valuation dynamics. Let's explore the key components and rationale behind their inclusion:
1. Price-to-Earnings (P/E) Ratio:
The Price-to-Earnings ratio is a widely used valuation metric that compares a company's current stock price to its earnings per share (EPS).
A lower P/E ratio may indicate that the stock is undervalued relative to its earnings potential, while a higher ratio may suggest overvaluation.
By incorporating the P/E ratio, we offer insight into market sentiment and investor expectations regarding a company's future earnings growth prospects.
2. Price-to-Book (P/B) Ratio:
The Price-to-Book ratio evaluates a company's market value relative to its book value, which represents its net asset value per share.
A P/B ratio below 1 may indicate that the stock is trading at a discount to its book value, potentially signaling an undervalued opportunity.
Conversely, a P/B ratio above 1 may suggest overvaluation, as investors are paying a premium for the company's assets.
By considering the P/B ratio, we assess the market's perception of a company's tangible asset value and its implications for investment attractiveness.
3. Dividend Yield:
Dividend Yield measures the annual dividend income received from owning a stock relative to its current market price.
A higher dividend yield may indicate that the stock is undervalued or that the company is returning a significant portion of its profits to shareholders.
Conversely, a lower dividend yield may signal overvaluation or a company's focus on reinvesting profits for growth rather than distributing them as dividends.
By analyzing dividend yield, we offer insights into a company's capital allocation strategy and its implications for shareholder returns and valuation.
4. Discounted Cash Flow (DCF) Analysis:
Discounted Cash Flow analysis estimates the present value of a company's future cash flows, taking into account the time value of money.
By discounting projected cash flows back to their present value using an appropriate discount rate, DCF analysis provides a fair value estimate for the company's stock.
Comparing the calculated fair value to the current market price allows investors to assess whether the stock is undervalued, overvalued, or fairly valued.
By integrating DCF analysis, we offer a rigorous framework for valuing stocks based on their underlying cash flow generation potential.
Earnings Transparency:
Mitigating the risk of fraudulent financial reporting is crucial for investors. The indicator incorporates the Beneish M-Score, a robust model designed to detect earnings manipulation or financial irregularities. By evaluating various financial ratios and metrics, this component provides valuable insights into the integrity and transparency of a company's financial statements, aiding investors in mitigating potential risks.
Overall Score:
The pinnacle of the "Global Financial Index" is the Overall Score, a comprehensive amalgamation of financial strength, profitability, valuation, and manipulation risk, further enhanced by the inclusion of the Piotroski F-Score. This holistic score offers investors a succinct assessment of a company's overall health and investment potential, facilitating informed decision-making.
The weighting and balancing of each metric within the indicator have been meticulously calibrated to ensure accuracy and reliability. By amalgamating these diverse metrics, the "Global Financial Index" empowers traders and investors with a powerful tool for evaluating investment opportunities with confidence and precision.
This indicator is provided for informational purposes only and does not constitute financial advice, investment advice, or any other type of advice. The information provided by this indicator should not be relied upon for making investment decisions. Trading and investing in financial markets involves risk, and you should carefully consider your financial situation and consult with a qualified financial advisor before making any investment decisions. Past performance is not necessarily indicative of future results. The creator of this indicator makes no representations or warranties of any kind, express or implied, about the completeness, accuracy, reliability, suitability, or availability with respect to the indicator or the information contained herein. Any reliance you place on such information is therefore strictly at your own risk. By using this indicator, you agree to assume full responsibility for any and all gains and losses, financial, emotional, or otherwise, experienced, suffered, or incurred by you.

Buffett Quality Score [Industry]The Buffett Quality Score is a composite indicator developed to assess the financial health and quality of companies operating within the Industrial sector. It combines a carefully selected set of financial ratios, each weighted with specific thresholds, to provide a comprehensive evaluation of company performance.
Selected Financial Ratios and Criteria:
1. Return on Assets (ROA) > 5%
ROA measures a company's profitability by evaluating how effectively it utilizes its assets. An ROA exceeding 5% earns 1 point.
2. Debt to Equity Ratio < 1.0
The Debt to Equity Ratio reflects a company's leverage. A ratio below 1.0 earns 1 point, indicating lower reliance on debt financing.
3. Interest Coverage Ratio > 3.0
The Interest Coverage Ratio assesses a company's ability to meet interest payments. A ratio above 3.0 earns 1 point, indicating strong financial health.
4. Gross Margin % > 25%
Gross Margin represents the profitability of sales after deducting production costs. A margin exceeding 25% earns 1 point, indicating better pricing power.
5. Current Ratio > 1.5
The Current Ratio evaluates a company's liquidity by comparing current assets to current liabilities. A ratio above 1.5 earns 1 point, indicating sufficient short-term liquidity.
6. EBITDA Margin % > 15%
EBITDA Margin measures operating profitability, excluding non-operating expenses. A margin exceeding 15% earns 1 point, indicating efficient operations.
7. Altman Z-Score > 2.0
The Altman Z-Score predicts bankruptcy risk based on profitability, leverage, liquidity, solvency, and activity. A score above 2.0 earns 1 point, indicating financial stability.
8. EPS Basic One-Year Growth % > 5%
EPS One-Year Growth reflects the percentage increase in earnings per share over the past year. Growth exceeding 5% earns 1 point, indicating positive earnings momentum.
9. Revenue One-Year Growth % > 5%
Revenue One-Year Growth represents the percentage increase in revenue over the past year. Growth exceeding 5% earns 1 point, indicating healthy sales growth.
10. Piotroski F-Score > 6
The Piotroski F-Score evaluates fundamental strength based on profitability, leverage, liquidity, and operating efficiency. A score above 6 earns 1 point, indicating strong fundamental performance.
Score Calculation Process:
Each company is evaluated against these criteria.
For every criterion met or exceeded, 1 point is assigned.
The total points accumulated determine the Buffett Quality Score out of a maximum of 10.
Interpretation of Scores:
0-4 Points: Indicates potential weaknesses across multiple financial areas.
5 Points: Suggests average performance based on the selected criteria.
6-10 Points: Signifies strong overall financial health and quality, meeting or exceeding most of the performance thresholds.
Research and Development:
The selection and weighting of these specific financial ratios underwent extensive research to ensure relevance and applicability to the Industrial sector. This scoring methodology aims to provide valuable insights for investors and analysts seeking to evaluate company quality and financial robustness within the Industrial landscape.
The information provided about the Buffett Quality Score is for educational purposes only. This document serves as an illustrative example of financial evaluation methodology and should not be construed as financial advice, investment recommendation, or a guarantee of future performance. Actual results may vary based on individual circumstances and specific factors affecting each company. We recommend consulting qualified professionals for personalized financial advice tailored to your individual situation.

Stochastic Z-Score Oscillator Strategy [TradeDots]The "Stochastic Z-Score Oscillator Strategy" represents an enhanced approach to the original "Buy Sell Strategy With Z-Score" trading strategy. Our upgraded Stochastic model incorporates an additional Stochastic Oscillator layer on top of the Z-Score statistical metrics, which bolsters the affirmation of potential price reversals.
We also revised our exit strategy to when the Z-Score revert to a level of zero. This amendment gives a much smaller drawdown, resulting in a better win-rate compared to the original version.
HOW DOES IT WORK
The strategy operates by calculating the Z-Score of the closing price for each candlestick. This allows us to evaluate how significantly the current price deviates from its typical volatility level.
The strategy first takes the scope of a rolling window, adjusted to the user's preference. This window is used to compute both the standard deviation and mean value. With these values, the strategic model finalizes the Z-Score. This determination is accomplished by subtracting the mean from the closing price and dividing the resulting value by the standard deviation.
Following this, the Stochastic Oscillator is utilized to affirm the Z-Score overbought and oversold indicators. This indicator operates within a 0 to 100 range, so a base adjustment to match the Z-Score scale is required. Post Stochastic Oscillator calculation, we recalibrate the figure to lie within the -4 to 4 range.
Finally, we compute the average of both the Stochastic Oscillator and Z-Score, signaling overpriced or underpriced conditions when the set threshold of positive or negative is breached.
APPLICATION
Firstly, it is better to identify a stable trading pair for this technique, such as two stocks with considerable correlation. This is to ensure conformance with the statistical model's assumption of a normal Gaussian distribution model. The ideal performance is theoretically situated within a sideways market devoid of skewness.
Following pair selection, the user should refine the span of the rolling window. A broader window smoothens the mean, more accurately capturing long-term market trends, while potentially enhancing volatility. This refinement results in fewer, yet precise trading signals.
Finally, the user must settle on an optimal Z-Score threshold, which essentially dictates the timing for buy/sell actions when the Z-Score exceeds with thresholds. A positive threshold signifies the price veering away from its mean, triggering a sell signal. Conversely, a negative threshold denotes the price falling below its mean, illustrating an underpriced condition that prompts a buy signal.
Within a normal distribution, a Z-Score of 1 records about 68% of occurrences centered at the mean, while a Z-Score of 2 captures approximately 95% of occurrences.
The 'cool down period' is essentially the number of bars that await before the next signal generation. This feature is employed to dodge the occurrence of multiple signals in a short period.
DEFAULT SETUP
The following is the default setup on EURAUD 1h timeframe
Rolling Window: 80
Z-Score Threshold: 2.8
Signal Cool Down Period: 5
Stochastic Length: 14
Stochastic Smooth Period: 7
Commission: 0.01%
Initial Capital: $10,000
Equity per Trade: 40%
FURTHER IMPLICATION
The Stochastic Oscillator imparts minimal impact on the current strategy. As such, it may be beneficial to adjust the weightings between the Z-Score and Stochastic Oscillator values or the scale of Stochastic Oscillator to test different performance outcomes.
Alternative momentum indicators such as Keltner Channels or RSI could also serve as robust confirmations of overbought and oversold signals when used for verification.
RISK DISCLAIMER
Trading entails substantial risk, and most day traders incur losses. All content, tools, scripts, articles, and education provided by TradeDots serve purely informational and educational purposes. Past performances are not definitive predictors of future results.

Price Based Z-Trend - Strategy [presentTrading]█ Introduction and How it is Different
Z-score: a statistical measurement of a score's relationship to the mean in a group of scores.
Simple but effective approach.
The "Price Based Z-Trend - Strategy " leverages the Z-score, a statistical measure that gauges the deviation of a price from its moving average, normalized against its standard deviation. This strategy stands out due to its simplicity and effectiveness, particularly in markets where price movements often revert to a mean. Unlike more complex systems that might rely on a multitude of indicators, the Z-Trend strategy focuses on clear, statistically significant price movements, making it ideal for traders who prefer a streamlined, data-driven approach.
BTCUSD 6h LS Performance
█ Strategy, How It Works: Detailed Explanation
🔶 Calculation of the Z-score
"Z-score is a statistical measurement that describes a value's relationship to the mean of a group of values. Z-score is measured in terms of standard deviations from the mean. If a Z-score is 0, it indicates that the data point's score is identical to the mean score. A Z-score of 1.0 would indicate a value that is one standard deviation from the mean. Z-scores may be positive or negative, with a positive value indicating the score is above the mean and a negative score indicating it is below the mean."
The Z-score is central to this strategy. It is calculated by taking the difference between the current price and the Exponential Moving Average (EMA) of the price over a user-defined length, then dividing this by the standard deviation of the price over the same length:
z = (x - μ) /σ
Local
🔶 Trading Signals
Trading signals are generated based on the Z-score crossing predefined thresholds:
- Long Entry: When the Z-score crosses above the positive threshold.
- Long Exit: When the Z-score falls below the negative threshold.
- Short Entry: When the Z-score falls below the negative threshold.
- Short Exit: When the Z-score rises above the positive threshold.
█ Trade Direction
The strategy allows users to select their preferred trading direction through an input option.
█ Usage
To use this strategy effectively, traders should first configure the Z-score thresholds according to their risk tolerance and market volatility. It's also crucial to adjust the length for the EMA and standard deviation calculations based on historical performance and the expected "noise" in price data.
The strategy is designed to be flexible, allowing traders to refine settings to better capture profitable opportunities in specific market conditions.
█ Default Settings
- Trade Direction: Both
- Standard Deviation Length: 100
- Average Length: 100
- Threshold for Z-score: 1.0
- Bar Color Indicator: Enabled
These settings offer a balanced starting point but can be customized to suit various trading styles and market environments. The strategy's parameters are designed to be adjusted as traders gain experience and refine their approach based on ongoing market analysis.
Z-score is a must-learn approach for every algorithmic trader.

Buy Sell Strategy With Z-Score [TradeDots]The "Buy Sell Strategy With Z-Score" is a trading strategy that harnesses Z-Score statistical metrics to identify potential pricing reversals, for opportunistic buying and selling opportunities.
HOW DOES IT WORK
The strategy operates by calculating the Z-Score of the closing price for each candlestick. This allows us to evaluate how significantly the current price deviates from its typical volatility level.
The strategy first takes the scope of a rolling window, adjusted to the user's preference. This window is used to compute both the standard deviation and mean value. With these values, the strategic model finalizes the Z-Score. This determination is accomplished by subtracting the mean from the closing price and dividing the resulting value by the standard deviation.
This approach provides an estimation of the price's departure from its traditional trajectory, thereby identifying market conditions conducive to an asset being overpriced or underpriced.
APPLICATION
Firstly, it is better to identify a stable trading pair for this technique, such as two stocks with considerable correlation. This is to ensure conformance with the statistical model's assumption of a normal Gaussian distribution model. The ideal performance is theoretically situated within a sideways market devoid of skewness.
Following pair selection, the user should refine the span of the rolling window. A broader window smoothens the mean, more accurately capturing long-term market trends, while potentially enhancing volatility. This refinement results in fewer, yet precise trading signals.
Finally, the user must settle on an optimal Z-Score threshold, which essentially dictates the timing for buy/sell actions when the Z-Score exceeds with thresholds. A positive threshold signifies the price veering away from its mean, triggering a sell signal. Conversely, a negative threshold denotes the price falling below its mean, illustrating an underpriced condition that prompts a buy signal.
Within a normal distribution, a Z-Score of 1 records about 68% of occurrences centered at the mean, while a Z-Score of 2 captures approximately 95% of occurrences.
The 'cool down period' is essentially the number of bars that await before the next signal generation. This feature is employed to dodge the occurrence of multiple signals in a short period.
DEFAULT SETUP
The following is the default setup on EURUSD 1h timeframe
Rolling Window: 80
Z-Score Threshold: 2.8
Signal Cool Down Period: 5
Commission: 0.03%
Initial Capital: $10,000
Equity per Trade: 30%
RISK DISCLAIMER
Trading entails substantial risk, and most day traders incur losses. All content, tools, scripts, articles, and education provided by TradeDots serve purely informational and educational purposes. Past performances are not definitive predictors of future results.
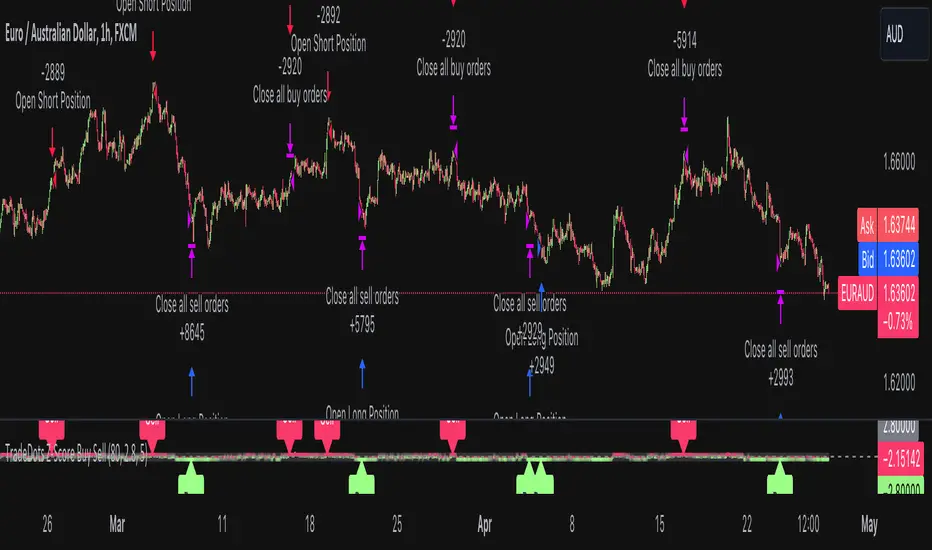
Ohlson O-Score IndicatorThe Ohlson O-Score is a financial metric developed by Olof Ohlson to predict the probability of a company experiencing financial distress. It is widely used by investors and analysts as a key tool for financial analysis.
Inputs:
Period: Select the financial period for analysis, either "FY" (Fiscal Year) or "FQ" (Fiscal Quarter).
Country: Specify the country for Gross Net Product data. This helps in tailoring the analysis to specific economic conditions.
Gross Net Product : Define the number of years back for the index to be set at 100. This parameter provides a historical context for the analysis.
Table Display : Customize the display of various tables to suit your preference and analytical needs.
Key Features:
Predictive Power : The Ohlson O-Score is renowned for its predictive power in assessing the financial health of a company. It incorporates multiple financial ratios and indicators to provide a comprehensive view.
Financial Distress Prediction : Use the O-Score to gauge the likelihood of a company facing financial distress in the future. It's a valuable tool for risk assessment.
Country-Specific Analysis : Tailor the analysis to the economic conditions of a specific country, ensuring a more accurate evaluation of financial health.
Historical Context : Set the Gross Net Product index at a specific historical point, allowing for a deeper understanding of how a company's financial health has evolved over time.
How to Use:
Select Period : Choose either Fiscal Year or Fiscal Quarter based on your preference.
Specify Country : Input the country for country-specific Gross Net Product data.
Set Historical Context : Determine the number of years back for the index to be set at 100, providing historical context to your analysis.
Custom Table Display : Personalize the display of various tables to focus on the metrics that matter most to you.
Calculation and component description
Here is the description of O-score components as found in orginal Ohlson publication :
1. SIZE = log(total assets/GNP price-level index). The index assumes a base value of 100 for 1968. Total assets are as reported in dollars. The index year is as of the year prior to the year of the balance sheet date. The procedure assures a real-time implementation of the model. The log transform has an important implication. Suppose two firms, A and B, have a balance sheet date in the same year, then the sign of PA - Pe is independent of the price-level index. (This will not follow unless the log transform is applied.) The latter is, of course, a desirable property.
2. TLTA = Total liabilities divided by total assets.
3. WCTA = Working capital divided by total assets.
4. CLCA = Current liabilities divided by current assets.
5. OENEG = One if total liabilities exceeds total assets, zero otherwise.
6. NITA = Net income divided by total assets.
7. FUTL = Funds provided by operations divided by total liabilities
8. INTWO = One if net income was negative for the last two years, zero otherwise.
9. CHIN = (NI, - NI,-1)/(| NIL + (NI-|), where NI, is net income for the most recent period. The denominator acts as a level indicator. The variable is thus intended to measure change in net income. (The measure appears to be due to McKibben ).
Interpretation
The foundational model for the O-Score evolved from an extensive study encompassing over 2000 companies, a notable leap from its predecessor, the Altman Z-Score, which examined a mere 66 companies. In direct comparison, the O-Score demonstrates significantly heightened accuracy in predicting bankruptcy within a 2-year horizon.
While the original Z-Score boasted an estimated accuracy of over 70%, later iterations reached impressive levels of 90%. Remarkably, the O-Score surpasses even these high benchmarks in accuracy.
It's essential to acknowledge that no mathematical model achieves 100% accuracy. While the O-Score excels in forecasting bankruptcy or solvency, its precision can be influenced by factors both internal and external to the formula.
For the O-Score, any results exceeding 0.5 indicate a heightened likelihood of the firm defaulting within two years. The O-Score stands as a robust tool in financial analysis, offering nuanced insights into a company's financial stability with a remarkable degree of accuracy.