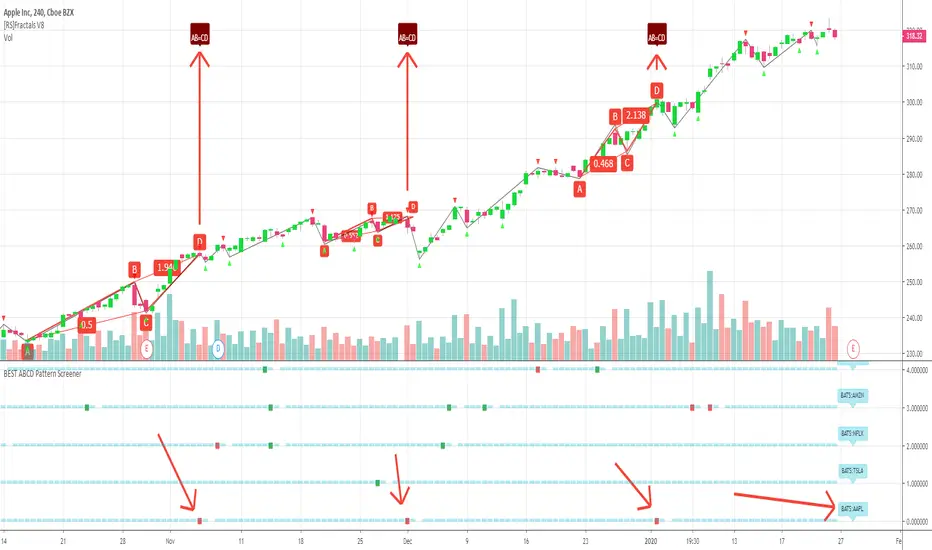
BEST ABCD Pattern ScreenerHello ladies and gentlemen traders
Continuing deeper and stronger with the screeners' educational series one more time.
This one is heavy crazy mega cool (pardon my french).
I - Concept
I present to you, ladies and gentlemen, the first screener for harmonic patterns.
Starting with an ACBD pattern screener this time!!
I used the calculations from Ricardo Santo's script
In short, he's using fractals (regular or Bill Williams ) for the pattern calculations. A masterpiece !!!
The screener will show in 1 consolidated chart the ABCD patterns for 5 selected assets. Could be stocks, forex, crypto, whatever you feel like making money with
II - Definitions
The ABCD pattern ( AB=CD ) is one of the classic chart patterns which is repeated over and over again.
The ABCD pattern shows perfect harmony between price and time.
More info here
The Williams Fractal is an indicator, developed by Bill Williams, that aims to detect reversal points (highs and lows) and marks them with arrows.
Up fractals and down fractals have specific shapes. The Williams Fractal indicator helps users determine in which direction price will develop
Source: www.tradingview.com
III - How did I set the screener
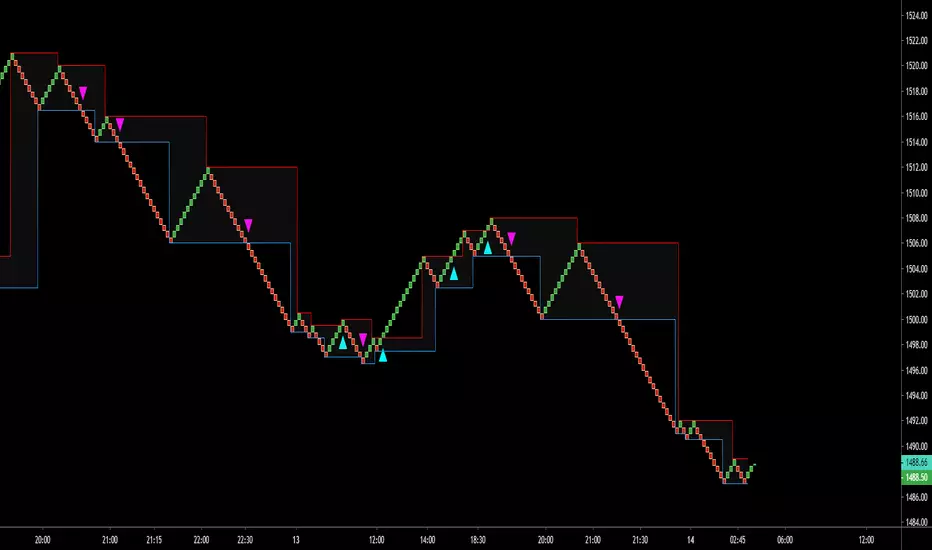
The visual signals are as follow:
- square: whenever there is an ABCD pattern detected
Then the colors are:
- green when a bullish pattern is detected
- red when a bearish pattern is detected
🔸 The script screenshot shows two red squares matching two ABCD bearish pattern from the above panel. As the chart is showing APPL, I highlighted where the screener mentioned the fruit stock ( APPLE, pun, bad joke, Dave out...)
🔸 I tried to make it as clear as I could with red arrows
Once again, we pushed together the limits of pine script beyond of what we thought was possible, beyond the realm of this world, reaching finally the dreamt pine script heaven (am I going too far? feel free to tell me)
Best regards,
Dave
Williams Fraktalı
Zenith BladeThis script is based heavily on "Support/Resistance Zones x3" by Lij_MC
What I did is went and added alerts for when price breakouts the support line/zone.
You have the options to change if it is based on a zone breakout or a line breakout
You also can choose when it will go off, so for example you want an alert to trigger only between 7am and 8am then you can change that in the menu.
Lastly you can choose whither or not to show the Williams Alligator on the chart as I have found it beneficial in conjunction with the script since its based primarily on fractals to calculate Support and Resistance.

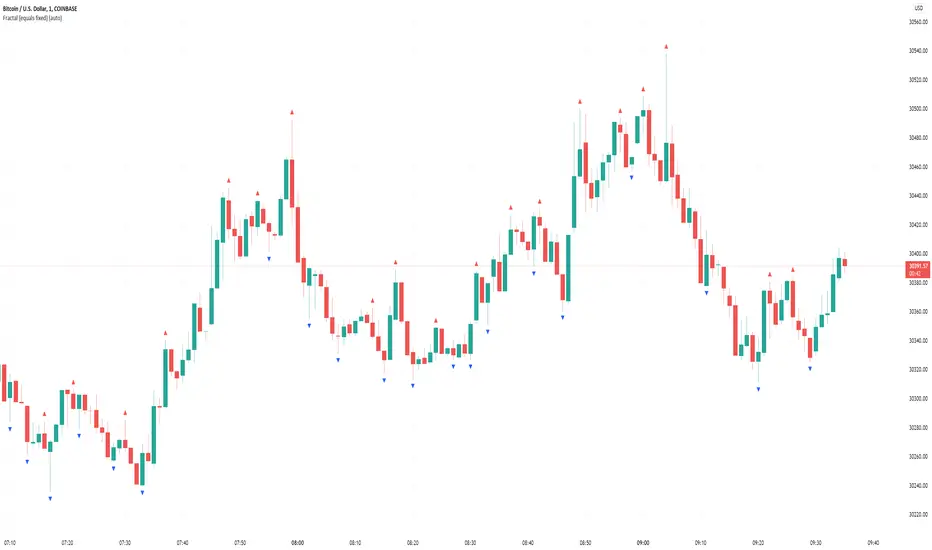
Williams Fractal (equals fixed)In contrast to the default Williams Fractal generator, this one also shows fractals if the two candles before or after are equal (>=, <=).

FractalsMLCombine 2 Fractals into one indicator with default left and right bars are 6 and 24 respectively.
It's for Forex Traders Vietnam group.


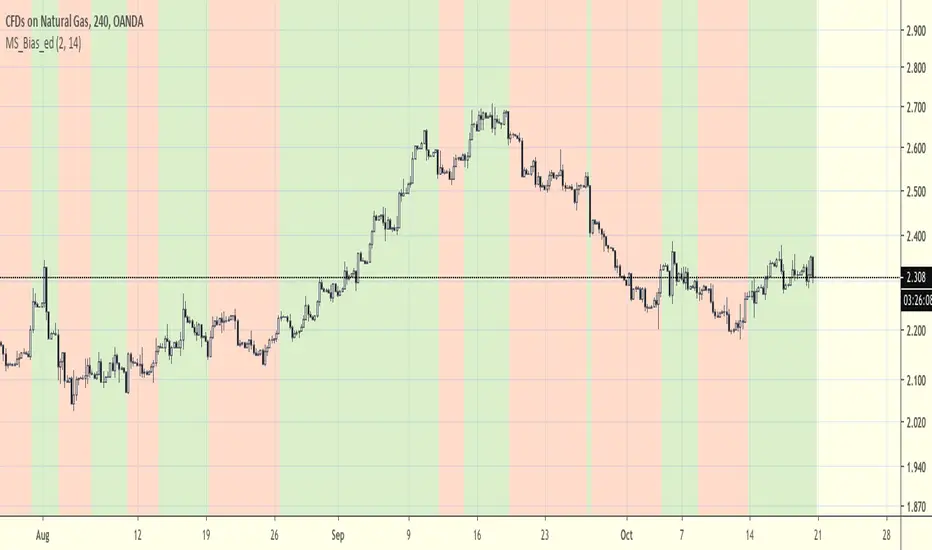
Market Structure Bias_edIdentify trends:
based on William Fractal pivots,
market structure shifts with bar close
wicks based on standard deviation

Volume-supported Fractal SRModified version of SynapticEX's Volume-supported Fractal S/R with EMA instead of SMA, pinescript 4 port, and EMA20/EMA50 defaults for support and resistance.
EMA20 = red/green
EMA50 = orange/yellow

Fractal Framer added buy sellThis script was written by Brobear and published. I only modified by adding buy and sell signal when price crossover fractal channel.
buy_breakout=crossover(close,fracLevelHigh) and OsMA >OsMA and emaRSI >emaRSI
sell_breakout=crossunder(close,fracLevelLow) and OsMA
Trend Direction Helper (ZigZag and S/R and HH/LL labels)Hey everyone
First of all, I'd like to thank Ricardo Santos, Backtest Rookies for the inspiration for this script.
Actually, most of it is coming from them and I only mixed them up (and added my secret sauce ^^). If some of you are not thinking about a trading secret sauce, please get serious for a moment :)
Some of you asked me how I do to set the trend direction. You all understood that if you get an UP label, then the price should go up and vice-versa for down.
But it's not so easy to define the good signals for each asset and each timeframe. I'm going to repeat what I said yesterday because ... well... that's what trading is about
So quoting myself here "The inputs set by default will have to be changed for your asset/timeframe and can't be generic for everything. You have to play with the inputs until the signals will make sense to you
The indicator/strategy with a unique configuration that you'll never check or update according to the market condition DOES NOT exit. "
BUT... a bit of patience and practice and you might do wonders.
The Method
I never realized until now but by connecting the higher highs/lower lows, I was drawing zigzag lines.
The Zig Zag Master is Ricardo Santos . Please give him a follow, he's awesome
For those who don't want to draw on the chart or (my preferred choice) need some inspiration to define your trend directions, this script is for YOU (and your family, your pet, your girlfriend/boyfriend, ...)
I think that each asset/timeframe chart has its own history. What worked in a post could work in the future.
In that regard, if a trend direction worked in the past, that's the parameter that I'll use to trade with it in a demo account and make sure it's relevant. If not then I will adjust
If you're trading with new indicators or a new method right away on your real trading account, you're gonna have a bad time imgflip.com
Lines EVERYWHERE
The script draws the classical horizontal pivots + the zig zag lines + the Higher Highs/Lower Lows label in just 1 script. I'm very excited to share a script (on which I coded 100 lines out of 500) but no one else did it
The horizontal pivots part are coming from Backtest Rookies
For more security, you can add a pullback on a moving average after getting a signal. Pullbacks are necessary to limit any eventual loss or maximize your gains by getting in the trend sooner.
I really give you a solid method and a great script in my opinion. 6 years of experience given away for FREE :p (when Dave will start thinking as a business man instead :O)
Does it repaint ?
Getting this question twice a day. You guys are obsessed with the repainting :)
Short answer, yes because it will calculate the pivots and zig zags whenever new higher highs/lower lows will be formed.
However, the trend direction code is based on the candle close so it shouldn't repaint. If it does, please let me know
See you all on Monday
Love you all
Dave
____________________________________________________________
Be sure to hit the thumbs up. Building those indicators take a lot of time and likes are always rewarding for me :) (tips are accepted too)
- If you want to suggest some indicators that I can develop and share with the community, please use my personal TRELLO board
- I'm an officially approved PineEditor/LUA/MT4 approved mentor on codementor. You can request a coaching with me if you want and I'll teach you how to build kick-ass indicators and strategies
Jump on a 1 to 1 coaching with me
- You can also hire for a custom dev of your indicator/strategy/bot/chrome extension/python
Disclaimer:
Trading involves a high level of financial risk, and may not be appropriate because you may experience losses greater than your deposit. Leverage can be against you.
Do not trade with capital that you can not afford to lose. You must be aware and have a complete understanding of all the risks associated with the market and trading. We can not be held responsible for any loss you incur.
Trading also involves risks of gambling addiction.
Please notice I do not provide financial advice - my indicators, strategies, educational ideas are intended to provide only some source code for anyone interested in improving their trading
The proprietary indicators and strategies developed by Best Trading Indicator, the object of intellectual property rights are and remain the exclusive property of Best Trading Indicator, at the exclusion of images and videos and texts free of rights or provided by the Company or external legal or physical person.
No assignment of intellectual property rights is carried out through these Terms and Conditions.
Any total or partial reproduction, modification or use of these properties for any reason whatsoever is strictly prohibited without the express written authorization of the Company.


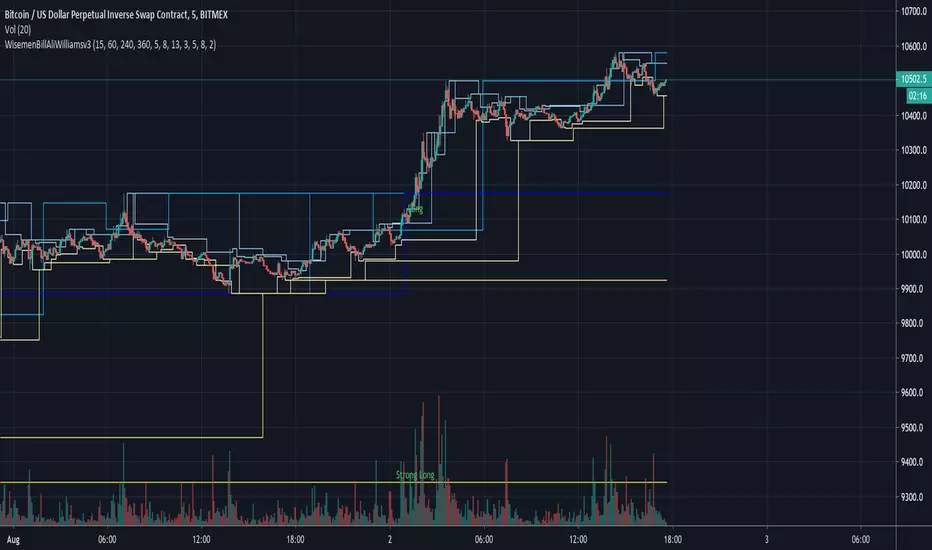
Wisemen Bill Ali Williams v3Use 2 timeframe:
Current timeframe + configurable timeframe (default: 6hours)
Get resistance & support for both timeframe.
Entry when breakout both resistance or both support
For donations
BTC: 3E7rUPX7upS8iTj42JdLt7keJVbJLfvMoH
ETH: 0x094ed88e4c5a9b225e936586cbc2d61f4a027f68
Thank you & happy trading!
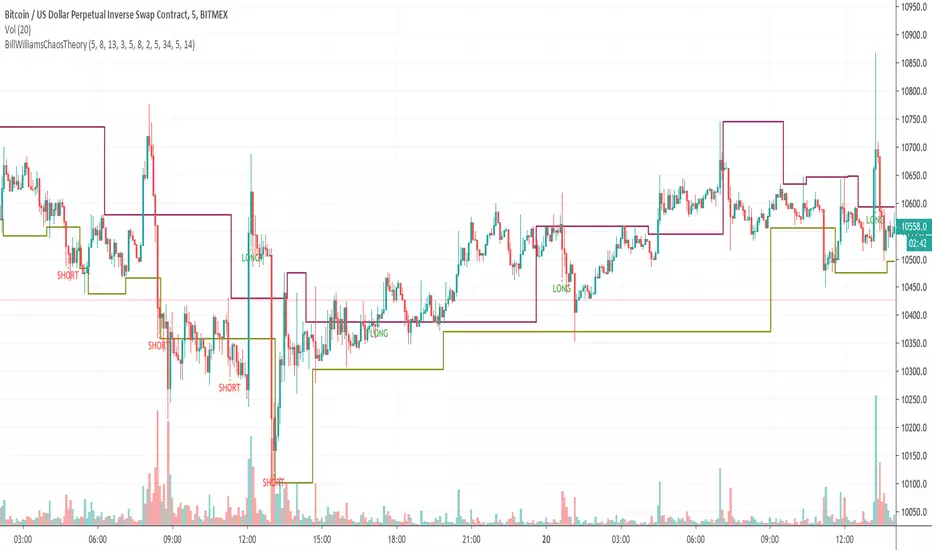
Bill Williams Chaos TheoryBill Williams Chaos Theory
- Alligator
- Fractals
- Accelerator Decelerator Oscillator
- Market Facilitation Index
Combining all of that to generate signal long or short.
Long entry when long signal appears.
Short entry when short signal appears.
For donations
BTC: 3E7rUPX7upS8iTj42JdLt7keJVbJLfvMoH
ETH: 0x094ed88e4c5a9b225e936586cbc2d61f4a027f68
Thank you & happy trading!
Sinyal GhoibLeading Signal!!!
Long entry while long signal appears.
Short entry while short signal appears.
This signal only effective on BitMex | 5m | XBTUSD.
Take profit: 0,6% from entry price
Stop loss: 0,6% from entry price
Leverage: 10x - 50x
For donation
BTC: 3E7rUPX7upS8iTj42JdLt7keJVbJLfvMoH
ETH: 0x094ed88e4c5a9b225e936586cbc2d61f4a027f68
BitMex Referral: P81ZCO
Thank you & happy trading!

Assassin Zenzen about top fractal and bottom fractal
show top fractal and bottom fractal
---
TODO
Contain Kline , Tradingview pine not support yet.


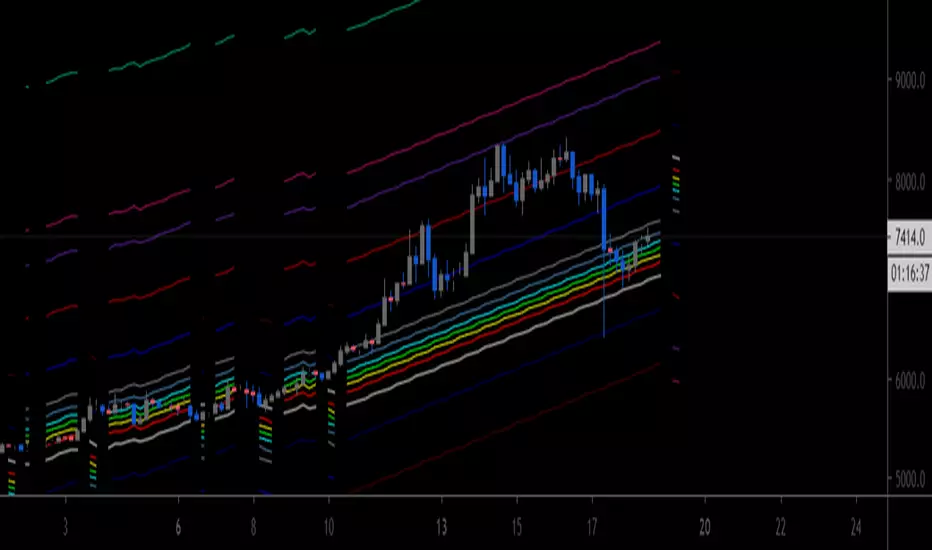
[AU] Fibonacci Fractal Regression ChannelFibonacci Fractal Regression Channel v01
Based upon:
Fractal Regression Channel V0 () by @RicardoSantos
Note: For use on 4H charts and lower intervals/timeframes
Fractal Regression Channel V0.1Port of @RicardoSantos' Fractal Regression Channel V0 from pinescript 2 to pinescript 3.
// Source:
// Original Author: @RicardoSantos
