Wave Trend Momentum OscillatorThis momentum oscillator is instantaneous and also extremely accurate. For use on all timeframes. Shows wave trend momentum as well as reliable diversions. A secondary crossover (Wave Trend Crossover) can be turned on to give even earlier entries and exits. This indicator has the ability to show changes in trend before it happens. Diversions can be turned off in settings.
There are 3 different smoothing options to tune the indicator to your chart/timeframe. Default setting is HULL.
Wave trend has 4 coloring options: sold, dual color 1, dual color 2 or none (dont show wave trend).
A J line can be turned on in settings as well as the wave trend crossover.
Wave

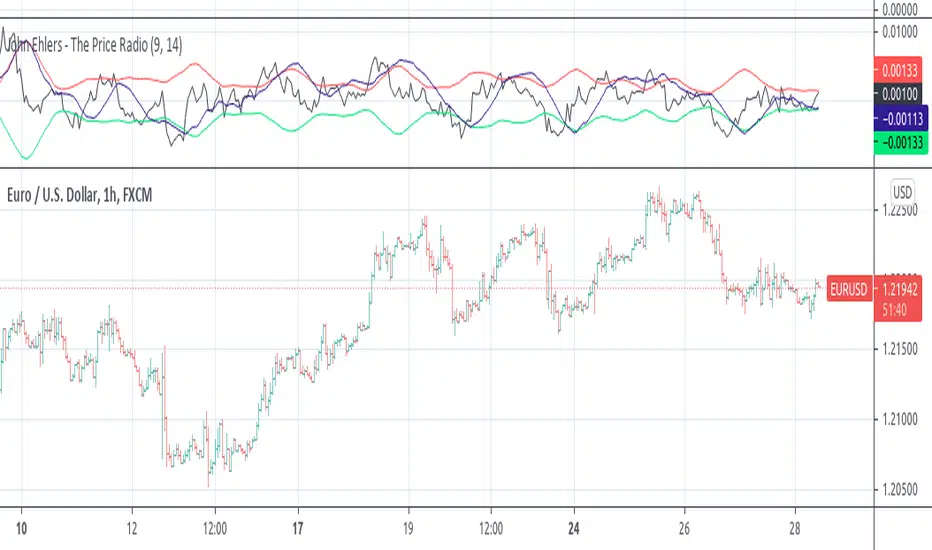
John Ehlers - The Price RadioPrice curves consist of much noise and little signal. For separating the latter from the former, John Ehlers proposed in the Stocks&Commodities May 2021 issue an unusual approach: Treat the price curve like a radio wave. Apply AM and FM demodulating technology for separating trade signals from the underlying noise.
reference: financial-hacker.com
Wave Trend w/ VWMA overlayThis is a trend-following strategy and indicator which combines the Wave Trend Strategy (Lazy Bear) by thomas.gigure with the cRSI + Waves Strategy with VWMA overlay by Dr_Roboto .
You may update the parameters of the Wave Trend oscillator or the VWMA indicator to match your own preferences. You may also adjust the Base Quantity used for determining trade size (as described below) to suit your account size and risk tolerance.
The strategy identifies potential signals based on the on the Wave Trend oscillator, originally ported to TradingView by LazyBear. When a signal is produced by the Wave Trend oscillator, trade size is determined by the VWMA.
When the VWMA is trending against the direction of the Wave Trend signal, Base Quantity x 1 is used
When the VWMA is trending neutral, Base Quantity x 2 is used
When the VWMA is trending with the direction of the Wave Trend signal, Base Quantity x 4 is used
The strategy includes the ability to limit trade signals to certain defined periods of time ("Sessions") during the trading day and, optionally, to close any open position at the end of either or both "Sessions." This may be enabled/disabled via the Limit Signals to Trading Sessions? option on the "Inputs" tab of the strategy's "Settings" window.
If you are trading on a daily chart (or longer) you must disable the Limit Signals to Trading Sessions? in order for the strategy to produce signals.

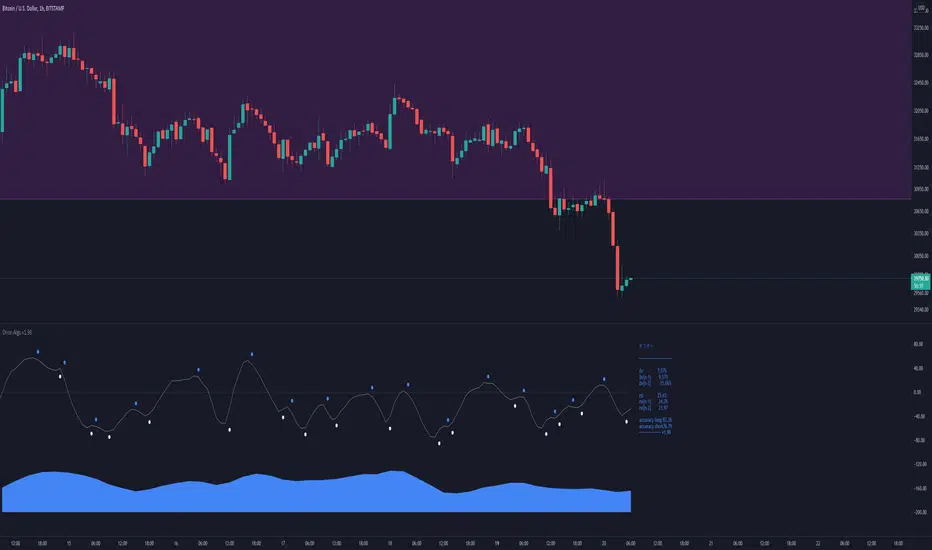
Orion AlgoOrion Algo is a next-gen trading algorithm designed to help traders find the highs and lows of the market before, during, and after they happen. We wanted to give an indicator to people that was simple to use. In fact we created the algorithm in such a way that it currently only needs a single input from the user. Since no indicator can predict the market perfectly, Orion should be used as just another tool (although quite a sharp one) for you to trade with. Fundamental knowledge of price action and TA should be used with Orion Algo.
Being an oscillator, Orion currently has a bias towards market volatility. So you will want to be trading markets over 30% volatility. We have plans to develop future versions that take this into account and adjust automatically for dead conditions. Also, while there are some similarities across all oscillators, what sets ours apart is the prediction curve. The prediction curve looks at the current signal values and gives it a relative score to approximate tops and bottoms 1-2 bars ahead of the signal curve. We also designed a velocity curve that attempts to predict the signal curve 2+ bars ahead. You can find the relative change in velocity in the Info panel. The bottom momentum wave is based on the signal curve and helps find overall market direction of higher time-frames while in a lower one.
Future Roadmap:
Create secondary on-bar indicator to pair with Orion Algo
Automatically adjust internal variables based on market volatility
Indicator style selection
Simple Strategy:
1. Start at a high time-frame to get an overview of the market you are wanting to enter. Daily is usually a good starting time.
2. If you can, add Orion to a second chart with a lower time-frame such as 4H.
3. Check the lower time frame to find potential medium term entry points based on where the trend was heading from the higher time-frame.
4. Step even lower to the 1H to find your optimal entry based on the higher times and technical analysis of the charts (support/resistance, patterns, etc)
5. The momentum wave can be used to find overall trend of the market. When it starts curving up, the market is bullish. When it curves down, the market could be bearish.
Intermediate Strategy:
1. Use simple strategy first.
2. Use the Prediction and ∆v curves to see future reversals in the works.
3. You can use these curves as potential entries as well as exit points.
4. Take into account potential divergence of the signal lines and price action.
Settings and How to Use them:
User Agreement – Orion Algo is a tool for you to use while trading. We aren’t responsible for losses OR the gains you make with it. By clicking the checkbox on the left you are agreeing to the terms.
Super Smooth – Smooths the main signal line based on the value inside the box. Lower values shift the pivot points to the left but also make things more noisy. Higher values move things to the right making it lag a bit more while creating a smoother signal. 8 is a good value to start with.
Theme – Changes the color scheme of Orion.
Info – Turns on a dashboard with useful stats, such as Delta v, Volatility, Rsi, etc. Changing the value box will move the dashboard left and right.
Pivots – Toggles main bull/bear dots.
Prediction – A secondary prediction model that attempts to predict a reversal before it happens (0-2bars). This can be noisy some times so make your best judgement. Curve will toggle a curve view of the prediction. Pivots will toggle bull/bear dots.
∆v – Delta v (change in velocity). This shows momentum of the signal. Crossing 0 signals a reversal. If you see the delta v changing direction, it may signify a reversal in the several bars depending on the overall momentum of the market.
Divergence – Toggles divergence lines. Hidden will show hidden divergences. Cross will show divergences that cross the 0 line.
Momentum Wave – Uses the signal as a macro trend indicator. Changes in direction of the wave can signify macro changes in the market. Average will toggle an averaging algorithm of the momentum waves and makes it easy to understand.
OBOS – Overbought/Oversold lines. Dyn will convert them to dynamic OBOS lines. The value box will adjust the smoothing.
MarketVision BWith Special Thanks to Everyone who has gone before me, and who have both allowed me given me permission to bring my version of Market Cipher to the World
Especially LazyBear for his amazing Wave Trend Oscillator and for Aevir, falconCoin, vumanchu, Crypto_Spike and others who have freely brought MarketCipher to the Tradingview Community
Also special mention to RicardoSantos for his Divergence script
MarketVision B - My take on MarketCipher B / Market Cipher B, Ive just put outlines on the Wave Trend to add to the Visual Appeal and Added a Trend Meter and a few more options for the Oscillators
Nice To Look At
Oscillator 1 Choose Between - RSI, MFI and Ultimate Oscillator
For Stochastics Choose Between Standard and RSI Stochastics and for the source you can choose On Balance Volume
Wave Trend
Money Flow
Trend Meter & Signals Bar
Divergences are marked, However they are easy to spot and it is better to train your eyes to spot them before the indicator marks them out
Lots of Alerts and Loads of ways to trade using MarketVision
PS: You can make this look like the original by adjusting the parameters in the menu

Weis Wave With Effort/Reward MatrixThis is based on Weis Wave principle with different customization. Namely
Shows Volume (in thousands) for each wave
Calculates the effort/reward matrix of each wave (proprietary calculation)
Can show either bar count or Effort/Reward (E/R) Matrix with volume for each wave
Default is E/R Matrix only
You can choose what you want to see from the indicator setting. It could be just wave volume, just ER Matrix (default), both ER Matrix and volume, ER Matrix and bar count or all three.
How It Works
BUY - Look for a wave (down) that ends at and around a same level with double or more ER Matrix
SELL- Look for a wave (up) that ends at and around a same level with double or more ER Matrix
There is also a principle called fading E/R Matrix that suggest the dying interest of either buyers or sellers. That also could be a good pointer to initiate fresh trades in the direction against the fading participants.
Points To Note
That said, it is best that you try to align it with your own trading style and existing principles. For example, I use only this indicator and don't even use candle sticks. It's more to do with the way I want to wade away negative and psychological brain fades. I generally use it with E/R Matrix only. As I have mentioned earlier, I always look for a level failure, i.e when I see the price fail to make a new high/low at around the same level with double or more E/R Matrix value. When this happens the price tends to reverse direction. I generally keep the SL 10 pips below/above the last wave end depending on the kind of trade I am into. What I have seen, it has a decent accuracy rate. Of course you ought to have basic price action idea to use this indicator effectively. It is for the people who have prior price action knowledge, so don't expect the script to generate buy/sell signal, because it won't. This indicator itself is an ecosystem of trading and you have to use it based on your trading style.
You can apply it on to your existing charts (bar, candle, line) or can use the wave alone as I do. Just make sure that you keep your opacity of your candles/bars to a level that makes the wave itself more prominent.
The colour combination looks best on a dark background

Carpe Diem [Strategy]Carpe Diem Strategy, a wave cycle strategy that only enters when markets are up trending.
The script uses 3 different trend detection indicators including volume which helps with confirmation.
This script has 10 variations built within it which are fitted for the coins differnt coinditions
The coins included are
BTC/USDT 4H
ETH/USDT 4H
LTC/USDT 4H
ADA/USDT 4H
BNB/USDT 2H
BAND/USDT 4H
BAT/USDT 3H
OGN/USDT 4H
ZIL/USDT 4H
BZRX/USDT 2H
How to use the Indicator
You can change what plots are shown in the settings Cog
When the wave lines are green, the market is up trending and will be looking for a trade whereas when they are red, the market is in a sideways or downtrend.
The buy signal is given by the fast wave either crossing over the slow wave line, or crossing over the value of 25.
The exit signal is when the wave crosses back under the 75 value
This strategy includes Fees and there is NO Repaint. The script is written in version 4
There is an option in the settings cog to choose from 10 Coins and timeframes which the Strategies have been optimised for.
There is also another option in the settings cog to change the backtesting range.
There is also another option to adjust the stop loss. I have left it on the Default value which I believe works best
This strategy performs best on the Binance listings

Dual Weis Wave VolumeIt took but left, a Weis wave volume that shows the main wave and the fractal wave, thinking of everyone who wants to save space with indicators, you can adjust 2 indicators within 1, it is the dual indicator.
This indicator calculates the volume waves, being created initially by David Weis, largely behind the wyckoff method that unfortunately died, being very useful in reading flow, replacing even Times in Trades in Tape Reading, since he makes the information more accurate visually.
The novelty is the addition of a fractal flow, that is, if the main one misses an information, the fractal will show, in addition to saving space to add another indicator and not the same with other values.

Swing Index System - Heiken Ashi Pivot Breakout StrategyFor Educational Purposes. Results can differ on different markets and can fail at any time. Profit is not guaranteed.
This only works in a few markets and in certain situations. Changing the settings can give better or worse results for other markets. This is a breakout strategy that uses the heiken ashi bars to find the support and resistance levels or the swing pivots to try to objectively find a breakout. When the price breaks out of a swing pivot, breakout can be confirmed and a strategy can be made. The trade exits as soon as in profit when the heiken ashi bar changes color, when the price swings start to slow down, or when the price breaks below a swing pivot. There might be many strategies and possible ideas that can be made just from knowing where the swing pivots are alone. For this one, I decided to try to emulate Wilder's Adam Theory approach by entering only a specific criteria when it makes new highs or lows that I experimented with. The Swing Index System seems to be similar to what he describes in his book (or perhaps it is the same thing).
Some say that price is the ultimate indicator, but not many really know what that really means. This is yet another approach to try to interpret what that means. This strategy only contains a piece of the complete breakout and trend strategy approach of the Adam Theory and won't be profitable in every market under every situation. This does not include price patterns that the Swing Index System is said to be able to find such as chart patterns, wedges, tops/bottoms, etc. This only includes the small breakout portion requirement in the book. I included specific entry and exit criteria to make the strategy work well that involves nothing but the price action of the swing points only due to the lack of the other missing pieces. It does not contain the missing pieces. Despite this, it can still help find where breakouts might be in an objective matter using the Swing Index System as a standalone trading system and it doesn't involve lookbacks or anything but price alone.

Finnie's RSI Waves + Volume Colored CandlesUsing RSI and 4 exponential moving averages, I created this indicator so that you can spot inconsistencies between price action and RSI. There's a lot of misunderstanding surrounding RSI, most people think if something's 'oversold' buying is a guarantee win. This definitely isn't the case as there's many more variable to consider. In addition, with this indicator, candles are colored based off of volume.
INDICATOR USE:
1. Determine trend
2. Find relative support/resistance
3. Once at support/resistance look for entries:
-RSI crossing over the Short EMA (CYAN) is your fist buy/sell signal
-Short EMA (CYAN) crossing Medium EMA (YELLOW) is your second
-RSI crossing Long EMA (PINK) is your final and most accurate signal
4. Once you've made an entry, you can follow step 3. in reverse for an exit
COLORED CANDLES:
Dark Green candles = Strong Bullish volume
Light Green = Average Bullish volume
Dark Red candles = Strong Bearish volume
Light Red = Average Bearish Volume
Orange/blue means volume is conflicting with price action
I plan to add a Colored DOT over each crossover as a visual buy/sell signal if anyone has any suggestions that'd be great :)
cloe V X.0 triple wave trend with trend This script is based on the lazybears wavetrend script
with a extra useful ema
the third ema is based on the last 200 periods and show how the trend is going in the time
- When the original wave cross the third ema it's means that we can continue long or short
- When the third ema stretchs below or up the 0 line it means that the current pair is oversell or overbought but in a large period of time so we can decide if we continue long or short

WaveTrend [LazyBear] vX by DGTDGT interpreted version of LazyBear's WaveTrend, visualizing on Price Chart
Original Author : LazyBear
Crosses above or below threshold are emphasized with bigger labels
- crosses above threshold : probable short indications with a bigger label and relativly small label for probable long indications
- crosses below threshold : probable long indications with a bigger label and relativly small label for probable short indications
All rest crosses within threshold boundaries with relatively small labels for both long and short probable indications

[HWVZ] Hiubris WeisVolume ZigZagThis script follows the Zig Zag pattern of price movement, based on the Weis Wave Volume indicator.
The Weis Wave Volume shows the cumulative volume from the lowest point of the price swing to the highest point (or vice versa)
The user has the option to change the Trend Detection Length of the indicator to adjust the swings frequency (from say 5 to any value above or below)
The user has the option to display Support & Resistance lines based on those turning points
The user has the option to display Info Labels for each swing
The user has the option to change the Weis Wave Volume Timeframe
*This is a Tradingview interpretation of the Weis Wave Plugin

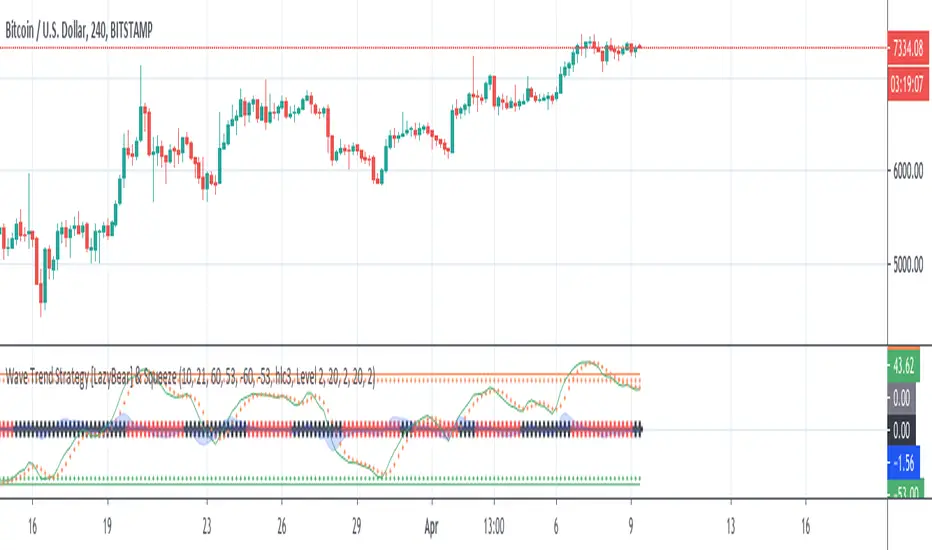
Wave Trend Strategy [LazyBear] & SqueezeThis strategy is a port of famous script Wave Trend Oscillator with a plus: squeeze indicator (LazyBear).
@author LazyBear
Original study from LazyBear
Scope of this port is to identify corrects inputs to get best results from signals that indicator gives.
The squeeze gives a further filter before orders and avoid to enter in a flat market period.
I attached it to chart with heikin ashi candles to have a better result and remove noise: results are good.
Please use comment section for any feedback.
Next improvement (only to whom is interested to this script and follows me): study with alerts on multiple tickers all at one. Leave a comment if you want to have access to study.
********************************** IMPORTANT*******************************
I have developed an expert advisor for metatrader4 (MT4): results of expert advisor form 2015-01-01 to 2018-11-25 are very good with low drawdown and good profit.
********************************************************************************
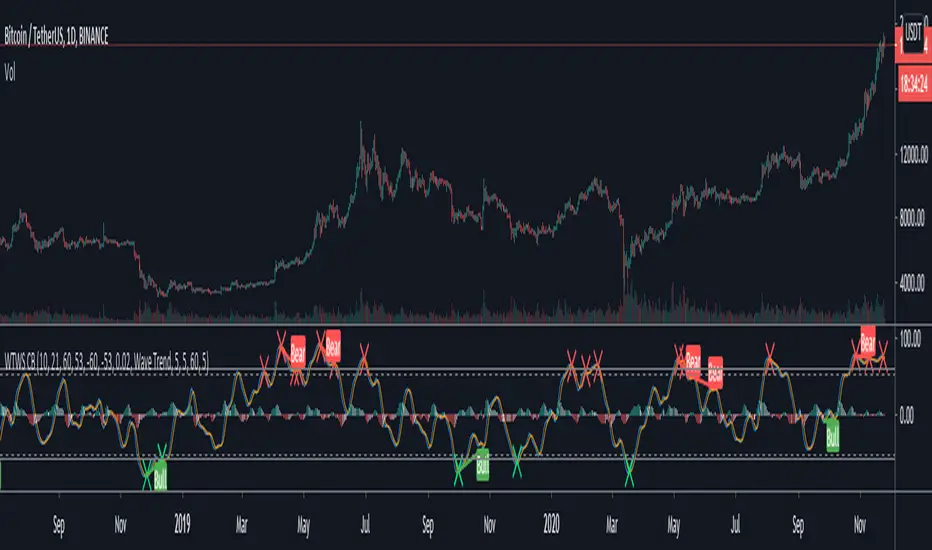
Wave Trend With Signals [ChuckBanger]A wave trend script based on LazyBears script but with added signals and a histogram...
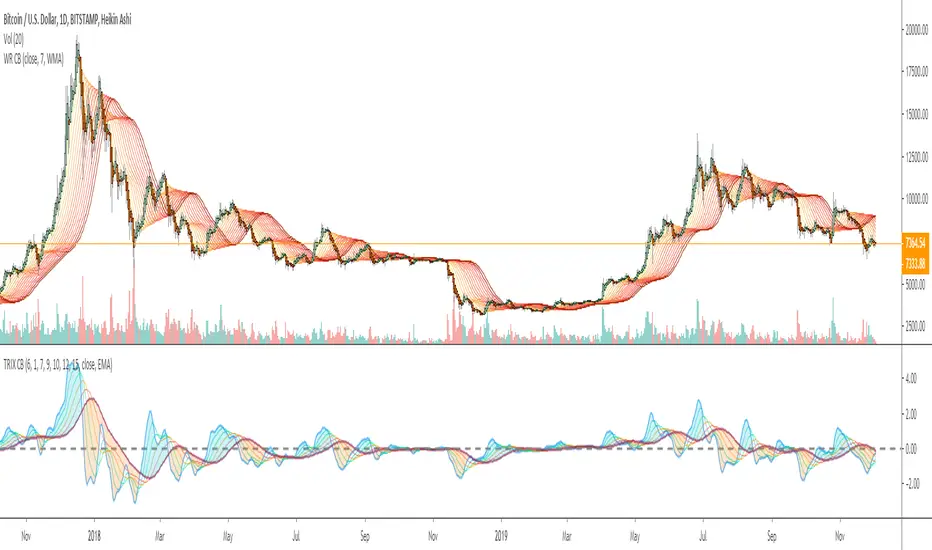
Wave Ribbon [ChuckBanger]This is a very easy script to build. Indicators like this can be very nice to use to spot trends. I just wanted to share it if someone to trade with it or wants to build on it further. The oscillator is my TRIX script:
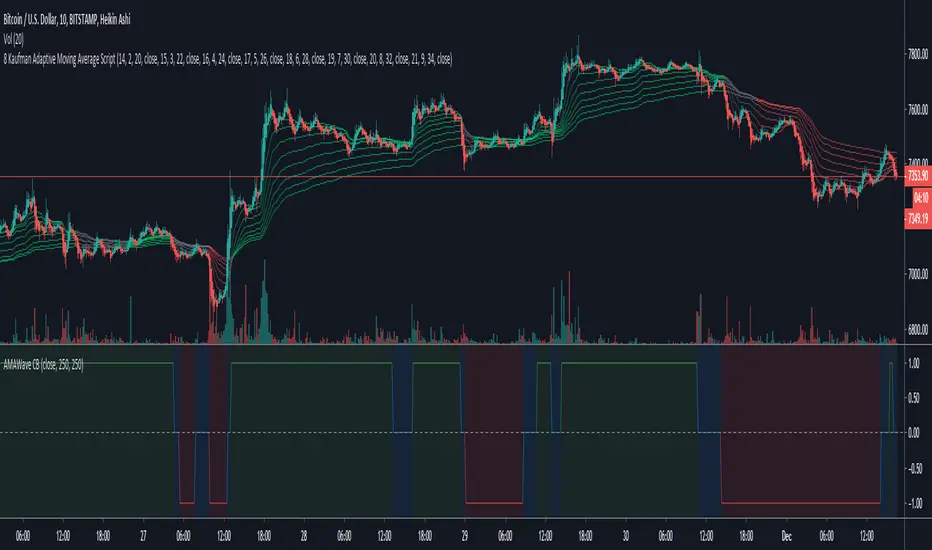
Kaufman AMA Binary Wave [ChuckBanger]This is Kaufman AMA Binary Wave with buy and sell zones. It’s pretty simple: when the line is over zero = buy zone, below zero = sell, at zero = neutral. You can experiment with the filter and length settings to suit your environment.
WolfeWaves SCANNER V2 - Market Scanner for Wolfe Wave Pattern
HI BIG PLAYERS AROUND THE WORLD,
this script allow to find Wolfe Wave Pattern in any market at the same time. One indicator can scan 6 markets/symbols - what ever you choose. For more markets you have to take the indicator more then once in your chart (look on my posting chart above).
Parallel the indicator gives signals as soon as Wolfe Waves are near finish pattern on point 5. In the default settings, the signals are displayed with a blue background on the chart. The markets with Wolfe Waves can you then read on the label in your chart.
The timeframe you currently has open is also the timeframe where the market scanner analyze the other markets / symbols in the background.
WolfeWaves SCANNER V2 is offered for sale. More information can be found below in the signature.
However, anyone can test this indicator for once without any registration in a 3 day trial. You can request access with a simple message to me.
Another trial of 7 days is included in the offer on my website - before the first payment will done.
When testing, please check whether your system requirements are sufficient. The many labels require a lot of memory from your computer.
For more great indicators everyone is invited to follow me on TradingView.
Kind regards
NXT2017
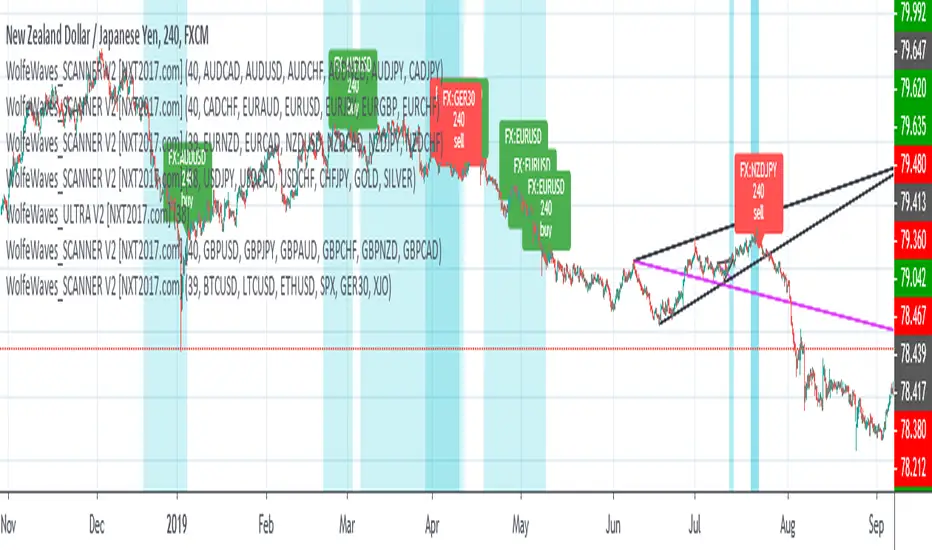
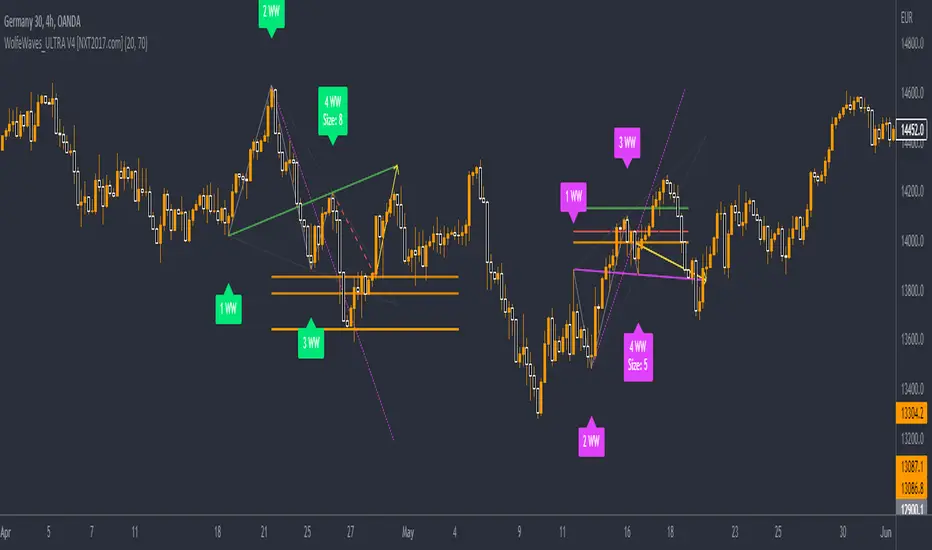
WolfeWaves_ULTRA V2 - Wolfe Wave auto lines drawing incl. SignalHI BIG PLAYERS AROUND THE WORLD,
this script allow to draw automatically lines of Wolfe Wave pattern.
Parallel to the automatic drawing, the indicator can give signals as soon as the 5 point of the Wolfe wave is immediately reached or has been reached. This allows the indicator WolfeWaves_ULTRA V2 to give early signals. In the default settings, the signals are displayed with a blue background on the chart.
WolfeWaves_ULTRA V2 is offered for sale. More information can be found below in the signature.
However, anyone can test this indicator for once without any registration in a 3 day trial. You can request access with a simple message to me.
Another trial of 7 days is included in the offer on my website - before the first payment will done.
In the settings it is possible to change the degree of details. This is sometimes necessary because TradingView limited only 55 lines per indicator in Pinescript Version 4.
In extreme cases it is therefore possible to change the settings that the Wolfe Wave pattern represent waves only from 3 lines. This allows the indicator to detect far more wolf waves on the same chart.
For more great indicators everyone is invited to follow me on TradingView.
Kind regards
NXT2017

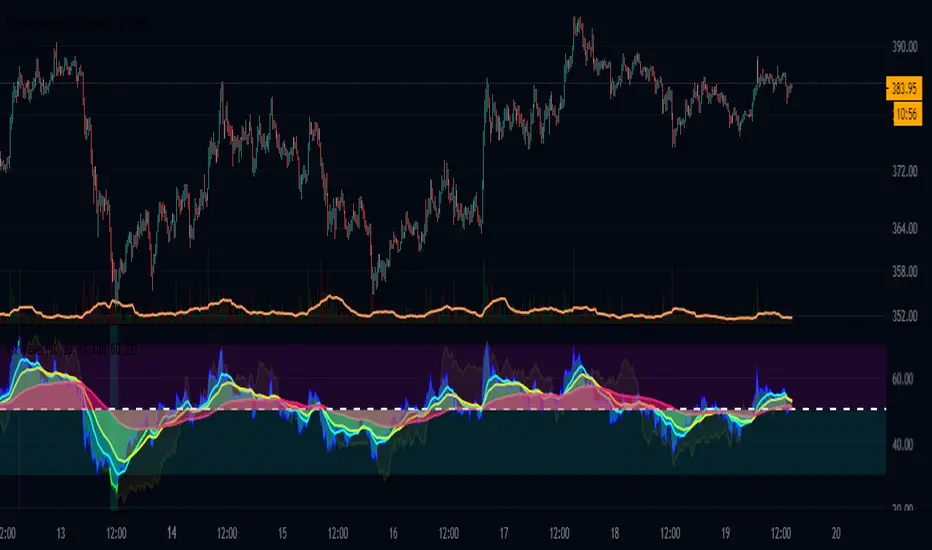
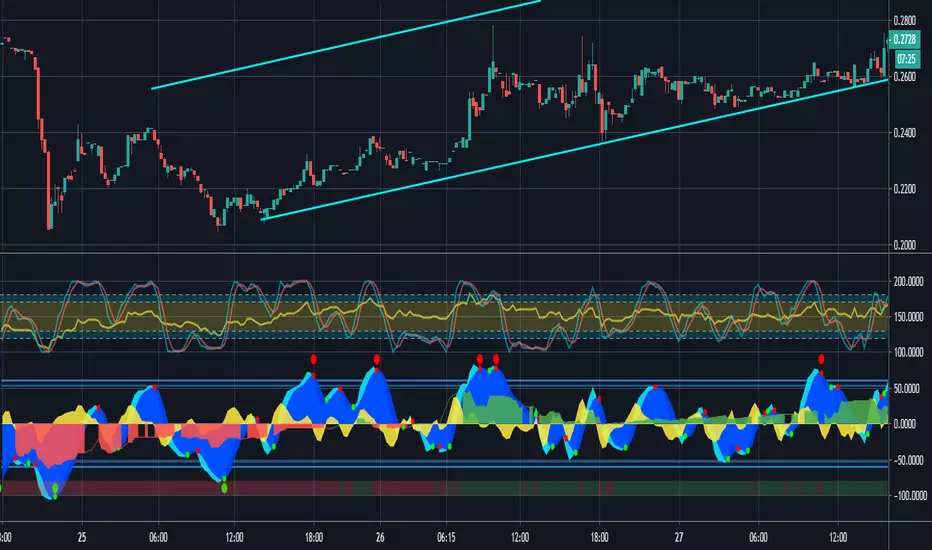
MarCipher | Buy/sell signals including VWAP, RSI and Stoch RSI.//Based on many different scripts
The script can be used on every timeframe.
How to use it?
- First check whether the bar (below the waves) is green (which means there is a lot of buying recently), in that case we are looking for a long option. If it is red (ofcourse) we are looking for a short option.
- The green dots below the blue waves represent a buy signal and if the blue wave is oversold (below 60) the green dot is considered a BIG buy signal (more probability of a good trade). The big buy signals are also plotted on the horizontal bar. So a green dot on the bar while the bar is also green represents a buy signal. You can exit the long when a red dot appears in the blue wave above the zero line.
- Another way to use it is to look for divergence of the blue waves. When a blue wave below the zero line appears and then a new wave (some time later) appears which is smaller than the previous, this is considered a good entry point for a long.
- The yellow represents the VWAP (which can be used as a confirmation (crossing up means buying, crossing down means selling)
The RSI is also added (yellow line) oscillating between 100 and 200 (is moved up by 100).
The Stoch RSI is also added (blue and red lines) on the same interval as the RSI.
For improvements, ideas or questions, please don't hesitate to leave a message.
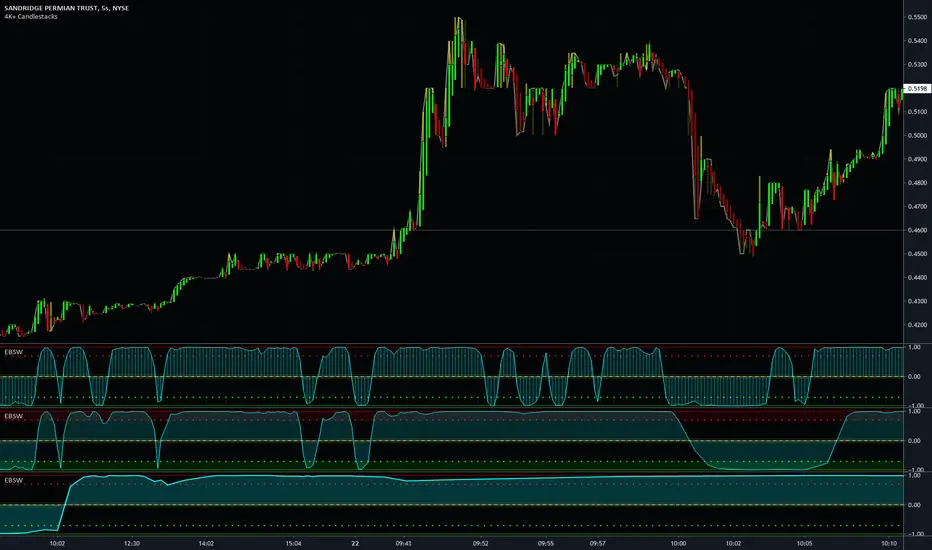
MTF Even Better Sine Wave - Dr. John EhlersThis is my enhanced "MTF Even Better Sine Wave" indicator using Pine Script version 4.0. This originates from the book "Cycle Analytics for Traders" written by Dr. John Ehlers in Chapter 12. While the original was simplistically designed, I enhanced it by adding a multitude of features Pine Script now accommodates.
Most noticeably is the multiple time frame (MTF) features in the indicator "Settings". The three displayed indicators are using 5 second, 30 second, and 7 minute time frames. This may be the first PSv4.0 script to accommodate seconds in MTF adequately, but don't quote me on that. I haven't spent hours extensively looking for them. Be forewarned, second-based time frames are currently for Premium subscribers only, until such time in the future when the prerogative of TV might change. I will be adding second-based time frames to my other indicators where I feel it is beneficial to the indicator.
Unlike Dr. John Ehlers' other Sinewave indicator that is intended for identifying turning points in cycling price fluctuations, the "Even Better Sine Wave", having stochastic like qualities, is intended for trending assets.
Features List Includes:
I.P.O.C.S.(Initial Public Offering Clean Start) Technology
Enable/disable dark background for enhanced visibility
"Source" selection with multiple time frame adjustments - including seconds
"Duration" adjustment
"Super Smoother BandEdge" adjustment
"Display Area" selection for visual mutations displayed above
Ranges and thresholds are enable/disable capable
Upper threshold adjustment
Lower threshold adjustment
Adjustable centered medial zone
Normalized zero mean to +/-1
This is not a freely available indicator, FYI. To witness my Pine poetry in action, properly negotiated requests for unlimited access, per indicator, may ONLY be obtained by direct contact with me using TV's "Private Chats" or by "Message" hidden in my member name above. The comments section below is solely just for commenting and other remarks, ideas, compliments, etc... regarding only this indicator, not others. If you do have any questions or comments regarding this indicator, I will consider your inquiries, thoughts, and concepts presented below in the comments section, when time provides it. When my indicators achieve more prevalent use by TV members, I will implement more ideas when they present themselves as worthy additions. As always, "Like" it if you simply just like it with a proper thumbs up, and also return to my scripts list occasionally for additional postings. Have a profitable future everyone!
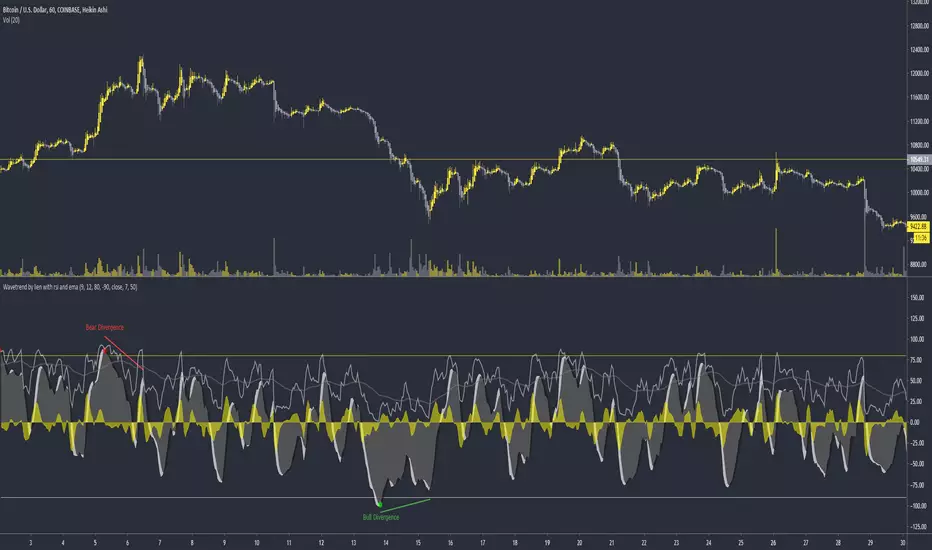
Liens wavetrend with rsi and emaWavetrend with rsi and ema. I would use the rsi and ema on high timeframes like the 4 hour to exit trades when it crosses.
Rsi and ema crosses can also be used to enter without divergence.
Test it out, try it on different TF. Enjoy :-)