Market sessions and Volume profile - By LeviathanThis script allows you to keep track of Forex market sessions (Tokyo, London and New York), as well as Daily, Weekly and Monthly sessions. All of them are accompanied by Volume Profile options where you can view VP Histogram, Point of Control, Value Area High and Value Area Low.
Colors, lines and other design preferences are fully customizable.
* Volume Profile of shorter sessions (eg. Tokyo, London, New York) works better when using lower timeframes such as 15min, 5min, etc.
** Use timeframe higher than 15min when viewing Monthly sessions
Indicator settings overview:
SESSION TYPE
- Tokyo session (1:00 - 9:00 UTC/ GMT )
- London session (7:00 - 16:00 UTC/ GMT )
- New York session (13:00 - 22:00 UTC/ GMT )
- Daily session
- Weekly session
- Monthly session
DISPLAY
- Show Volume Profile (Show or hide Volume Profile histogram)
- Show POC (Show or hide Point Of Control line)
- Show VAL (Show or hide Value Area Low line)
- Show VAH (Show or hide Value Area High line)
- Show Live Zone (Show or hide the ongoing session)
VOLUME PROFILE SETTINGS
- Resolution (The higher the value, the more refined of a profile, but less profiles are shown on the chart)
- Smooth Volume Data (Useful for assets that have very large spikes in volume over large bars, helps create better profiles)
APPEARANCE
- Up Volume color (Pick a custom color for up/ bullish volume profile nodes)
- Down Volume color (Pick a custom color for down/ bearish volume profile nodes)
- POC color and thickness (Pick a custom color and thickness for Point Of Control line)
- VAH color and thickness (Pick a custom color and thickness for Value Area High line)
- VAL color and thickness (Pick a custom color and thickness for Value Area Low line)
- Session box thickness (Pick a custom thickness for the session box. Color is provided automatically with optimal contrast)
** Some VP elements are inspired by @LonesomeTheBlue's volume profile script
Hacim Profili

Average Volume ProfileAverage Volume Profile is an abstract based on a user suggestion.
The information displayed could be summed up as a volume profile divided by a market profile.
This indicator is a profile which displays the average volume of an area (of price).
It also calculates and displays the highest average volume point (HAV) and the relating value zones (calculated in the similar fashion to a volume profile).
Most of the code is directly from my "Volume/Market Profile" Indicator
I am not entirely sure of how to make use of the information displayed in this indicator or how useful it is.
However, I have added some things I figured would be useful to comprehend this information, such as:
- Read-out for highest average volume
- Read-out for current price average volume
- Read-out for current candle distributed volume (labeled as: "Vol")
- Floating line to visualize the current distributed volume in relation to the rest of the profile.
- Color changing labels for when the current distributed volume is higher than the current price avg volume.
Enjoy!

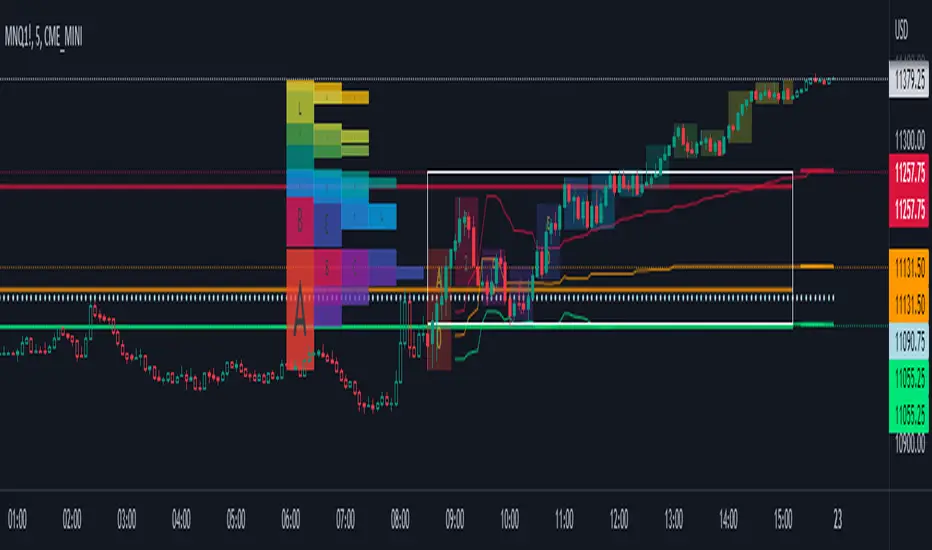
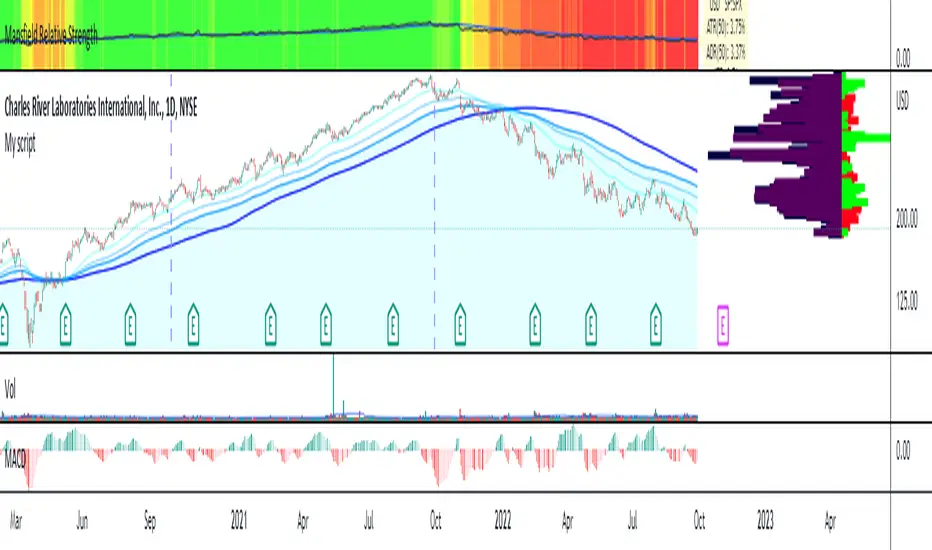
Market ProfileThis indicator is meant to be used on CME Group futures products.
This indicator is the market profile firstly developed by J. Peter Steidlmayer, and also described in J. Dalton's book Mind Over Markets.
Each period is indicated by a color in the profile and overlayed on price by means of the bars of the same color, and the letter on top of it.
In addition to that, the rotation factor (see Mind over markets book) is indicated inside the 30min bar, under the letter.
It is possible to choose the session between different options. Each option changes the open and the close of the regular trading hours session.
It is possible to see the profile shifted on the left of the session open, or overlayed to the session.
The following plots are visible intraday:
Previous day's settlement price (white circles)
Previous day's Value high (red continuous)
Previous day's Point of control (orange continuous)
Previous day's Value low (green continuous)
Current day's Value high (red dashed)
Current day's Point of control (orange dashed)
Current day's Value low (green dashed)
Current day's value area is also highlighted by the light blue background.
If you would like to have your own custom version of this script, you can contact me privately.
Feel free to show your appreciation by donating:
BTC: bc1qs60uqsl0mxls8updnghzawl0vdfex72c9nzzgg
ETH: 0x7Cf5d904Cb88c97504863D6BE9ABBb7E3F806d6d
TetherUSD: 0x7Cf5d904Cb88c97504863D6BE9ABBb7E3F806d6d
USD Coin: 0x7Cf5d904Cb88c97504863D6BE9ABBb7E3F806d6d
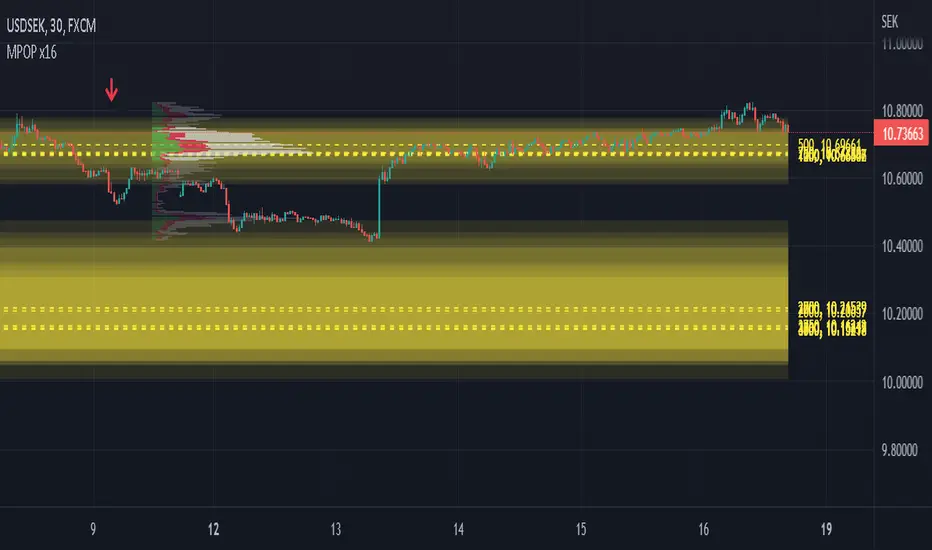
Multiple Popular Prices (x16)Up to 16 popular prices in 16 periods.
Lookback Period: Up to 5,000.
Support 01 volume profile (histogram) on price axis for the last period with up to 100 price ranges.
Histogram of 3 colors (up/down/sideways).
Markets: All.
Timeframes: All from 10s.
Usage: Price moves slowly in the popular price area (PPA) and moves fastly in the unpopular price area (UPA). When price breakouts a PPA, it could be forming an entry to a new PPA or an existing PPA. PPA of a period will move up if price continuously increases or is in an uptrend, and vice versa. It means that this indicator is led by price. Note that, when short-term PPA is higher/lower than long-term PPA, price did move and it is not a buy/sell entry.
Note: If calculation is timeout (“Loop takes too long to execute (> 500 ms)”), try to remove the indicator and reapply it, or try to increase the timeframe, or try to reduce the number of periods used to calculate popular prices.
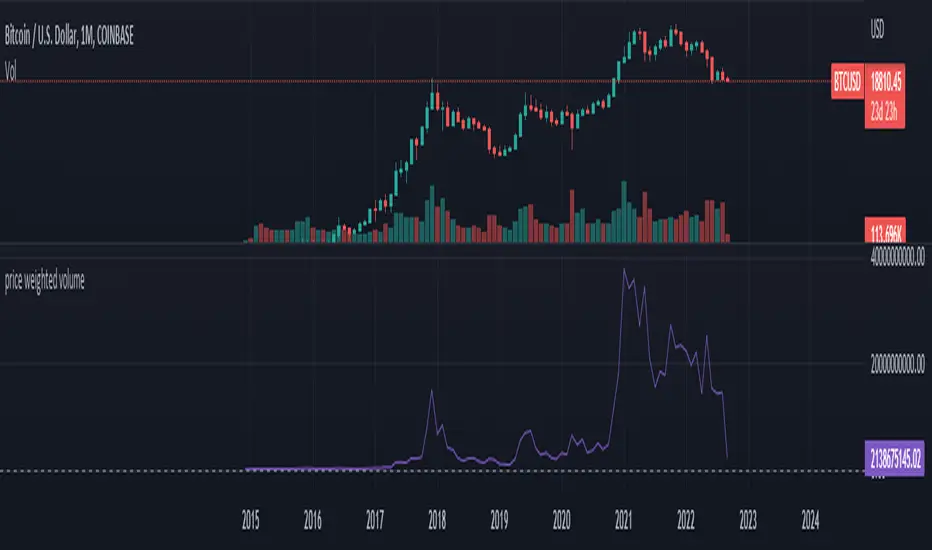
PWV - Price Weighted VolumeThis indicator charts
PWV = volume * close
in order to better visualize exchange volume.
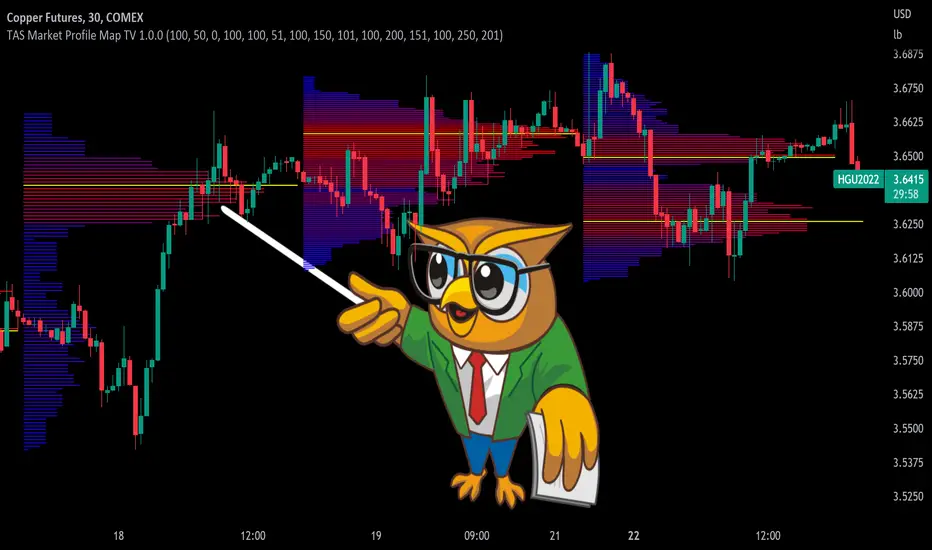
TAS Market Profile Map [TASMarketProfile]TAS Market Profile Map (aka “ TAS Market Map ”) displays volume accumulation at price using our attractive color-coded sideways histogram overlaid onto the price data pane. Hunt for high reward-to-risk opportunities with our favorite “Alligator Jaws” chart pattern setup that reveals significant volume gaps and actionable signals. TAS Market Map can paint up to 5 Maps simultaneously across time windows customized by the user.
TAS Market Map has 4 distinct colored lines:
RED ZONE – Designates an area where there are many market participants willing to transact. This zone of red lines grouped together is known as the “value area” and contains approximately 70% of the volume transacted in that particular section of the price map within the overall Market Map.
YELLOW LINE – Each TAS Market Map will contain at least one yellow horizontal line. This line is called the “Point of Control” (POC) and it represents the price where the most executions have occurred. In the case of multiple yellow POC lines, the one that extends closest to the price axis is considered the “Master Point of Control.”
PURPLE ZONE – Represents an area where there are less people willing to transact and is referred to as being “outside of value.”
BLUE ZONE – Designates areas where there is little interest on the part of commercial or institutional professionals to transact. When these areas occur on the perimeters of the TAS Market Map, they are referred to as “runaway gaps” or “rejection tails.”
∟ THE ALLIGATOR JAWS CHART PATTERN:
A popular chart pattern utilizing TAS Market Map is called the “Alligator Jaws” setup. Due to its unmistakable appearance similar to the side profile of an alligator with its mouth open, this chart pattern seeks to exploit when there are two significant Points of Control (yellow lines) with a large volume gap in between. Enter the trade as the market breaks outside of the value area (red zone) in the direction of the volume gap (inside the open jaws), place a stop loss on the other side of the Point of Control and preferably also across the value area (red zone). Seek to take profits at either 50% of the way through the volume gap or a more optimistic target just ahead of entering the opposing jawline (red zone value area). This trading technique can be applied to both long and short side entries.
Below you will find a couple examples of this chart pattern.
∟ INPUT SETTINGS:
By default, three TAS Market Maps will appear. You can activate the 4th and 5th Market Maps easily by checking the boxes in the Input settings. TAS Market Map updates automatically at the close of each bar after it has calculated all of the volume from the closed bar in addition to the completed OHLC data (Open, High, Low, Close). This happens in a matter of seconds at each bar close. The analysis is not static, but rather a rolling period of analysis at each bar close.
THERE ARE 3 SETTINGS FOR EACH MARKET MAP :
>>> # of Lines – This represents how many horizontal lines you want to comprise the Market Map so it generates a transparency customization. The default is 50 lines. If you increase the number to, for example 100, then the Market Map will appear more prominent and less transparent on the chart. Similarly, a lower input setting would remove lines and make it more transparent.
>>> BarStart – This setting dictates the starting point for that particular Market Map analysis based on the number of bars from the current bar. The default is 50 bars so this means the start of the 1st Market Map begins 50 bars from the present. At the close of each new bar, the analysis rolls to the most recent 50 bars automatically. Therefore a setting of 100 would start the analysis based on the most recent rolling 100 most recent bars.
>>> BarStop – This setting dictates the end point for the analysis of that particular Market Map. By default, the 1st Market Map will have a 0 which means it runs analysis through to the most recent bar.
OTHER NOTES ABOUT SETTINGS:
You’ll notice that by default the input settings for BarStart and BarStop for all 5 of the Market Maps are set to 50 bar increments and don’t overlap. For example the StopBar of Market Map #2 is 51, whereas the StartBar for Market Map #1 begins at 50. It is best practice to have consistency regarding the number of bars from the start and stop of the analysis.
Although not as popular, if you want to flip the orientation of the Market Map to paint from right to left instead of the default left to right, simply change the StartBar to 0 and StopBar to 50 and you’ll achieve this preference.
∟ INTERPRETATION AND RULES:
When the market is inside the red zone “value area” of the Market Map, it tends to move sideways within the range of the zone. Therefore you can look to enter trades near the top and bottom of the red zones with potential exits near the POC (yellow line) or opposing side of the red zone value area.
When price does break and close outside the value area zone, then the value area zone becomes new support or resistance and this can be leveraged for trailing stops. The most aggressive trailing stop would be after the market has penetrated into open space away from the value area, moving the stop to just back inside the value area. This would significantly reduce the trade risk.
The use of multiple Market Maps allows the trader to anticipate upcoming areas of support and resistance when the market moves beyond the scope of the current 1st Market Map. Historical Market Maps provide valuable information regarding where commercial interest existed in the past and likely to revisit in the future.
When multiple Market Maps form and the value areas align or overlap across their respective different time windows, these tend to be significant attraction zones for the market and a trader can expect sideway trading within the red value areas zones. Prudent trading is to observe the market conditions present and you the trader must adapt your trading mode to match, or not trade at all. In other words, you must trade the range during times when the market is in the value area zones and trade breakout when confirmed moves occur outside the value area zones.
In the case of a Market Map that develops “multiple distribution” areas (i.e. multiple developed value areas within Market Map), we anticipate a trending move
with price continuing in the direction the value areas are forming in relation to one another and in relation to the direction multiple Market Maps are forming.
Example of multiple Market Maps forming lower and revealing the bearish market trend:
Trade Well My Friends,
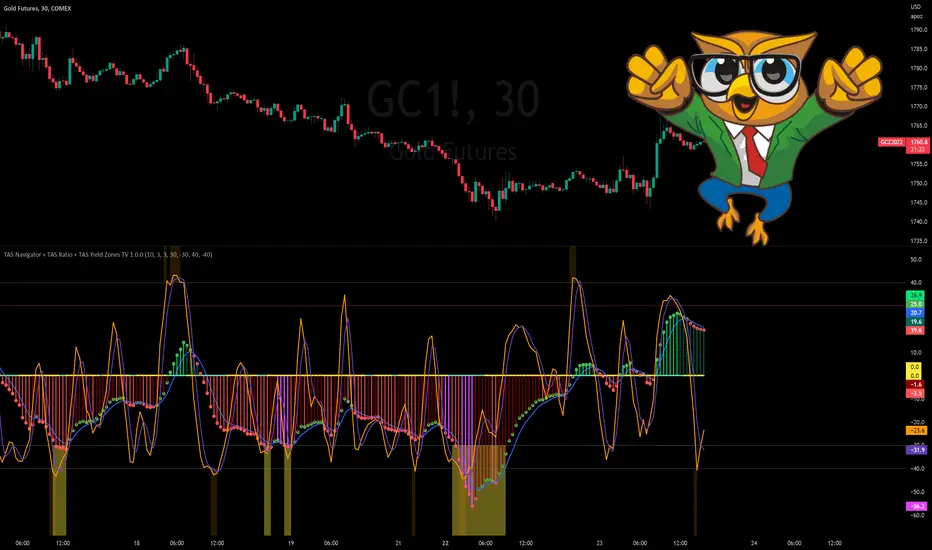
TAS Navigator + TAS Ratio + TAS Yield Zones [TASMarketProfile]This bundle of 3 TAS Market Profile indicators reveal when markets are gaining momentum, exhausted and reaching critical overbought/oversold conditions. The indicators display on a space-saving bottom pane and provide multi-perspective analysis that yield confidence in what direction to trade and when. The TAS Navigator, TAS Ratio, and TAS Yield Zones can be applied to any financial market such as stocks, ETFs, futures, Forex and digital currencies.
∟ ABOUT TAS NAVIGATOR:
TAS Navigator is a versatile indicator that combines several signals to help you manage your trades and avoid unfavorable situations. At a glance, the Navigator can provide the trader with useful information about underlying trading conditions for any time frame chart. The Navigator is comprised of three primary components – the histogram, the moving average and the zero line.
The histogram consists of the vertical bars plotted above and below the horizontal “zero line.” The bars are color-coded to provide the following information:
NEON GREEN / RED – The directional move continues to gain momentum.
DARK GREEN / RED – The buying or selling momentum is falling off.
MAGENTA – Exhaustion warning and the move has reached “peaking” conditions that may be difficult to maintain. Markets are likely to run sideways for a period of time or a direction change may be near.
The moving average (MA) is the blue line that travels horizontally across the Navigator and provides a relative measure of the overall levels of buying or selling. You will notice that the dots capping the histogram bars change from green to red as they move above or below the MA. The color of these dots tells us the following:
GREEN DOTS – The buyers are currently in control.
RED DOTS – The sellers are currently in control.
The zero line is the horizontal line around which the histogram plots. It provides a reference point for the larger momentum shifts. It is color-coded in the following manner:
CYAN – The current market phase is trending / unbalanced.
YELLOW – The current market phase is sideways / balanced.
INTERPRETATION AND RULES:
The TAS Navigator’s inherent ability to visualize the overall pulse of the market can inform your trading decisions in several ways:
>>> If the histogram is neon green or red, the trader should look for trading opportunities in the appropriate direction (green = long; red = short) and hold for increased profits as long as the bars remain neon green or red.
>>> If magenta bars appear, the trader knows to tighten stops and look for profit-taking opportunities because the trend has reached peaking conditions.
>>> When the histogram switches to dark green or red – indicating momentum is slowing – the trader can look to tighten stops and consider technical areas for reentry.
>>> Once the histogram crosses the MA and the capping dot changes to the opposite color of the histogram bar, a trader knows that they can begin looking for countertrend trade opportunities.
>>> Most importantly, until that dot changes color, the trader knows that the odds do not favor looking for trading opportunities against the current trend.
>>> The relative peaks of the histogram bars can also provide valuable information. As consecutive histogram peaks move further away from the zero line, price should extend the trending move. When consecutive histogram peaks become closer to the zero line, the price should create a lower high or higher low soon.
>>> A trend line connecting histogram peaks can be used to identify trading levels based upon momentum reaching the necessary level to touch the projected trend line.
>>> Trading opportunities can also be found when divergence occurs between the histogram and price. For example, consecutive histogram peaks move further away from zero line, but price cannot extend the trend.
∟ ABOUT TAS RATIO:
TAS Ratio is a leading indicator which helps forecast short-term price movements. It is best used for gauging targeted areas for entry and exit points. It was designed to identify when price movement is confirmed by volume and volatility as well as when market moves lack momentum, conviction and follow through. TAS Ratio levels are determined by a defined time within a 24-hour period and applicable for intraday charts only. The analysis can be applied to any liquid financial instrument and provides target trading zones in either direction.
INPUT SETTINGS FOR TAS RATIO:
There are 3 inputs for TAS Ratio and below you’ll find the default settings:
Ratio RangeBars: 10
Ratio AverageBars: 3
Ratio MABars: 3
>>> Ratio RangeBars – Sets the desired lookback period. Default = 10.
>>> Ratio AverageBars – Sets the smoothing factor and should be the same as MABars setting. Default = 3.
>>> Ratio MABars – Sets the smoothing factor and should be the same as AverageBars setting. Default = 3.
CONFIGURATION NOTES:
As a rule, the RangeBars period should be twice (or more) than the AverageBars and MABars setting. Remember that the AverageBars and MABars settings should be equal. For example, 6/3/3 or 8/4/4 would be minimum separation.
Faster time charts may prefer slower indicator settings for smoother readings. For example, on 30-minute charts or lower the settings for RangeBars period and AverageBars and MABars could be 10/5/5 or even 16/8/8 respectively.
TAS RATIO DISPLAY:
TAS Ratio – Displays more volatile orange-colored line
Moving Average – Displays smoothed moving average purple-colored line
Note that the default colors can be adjusted in the Style settings.
INTERPRETATION AND RULES:
TAS Ratio is displayed on the same pane and scale as TAS Navigator in which readings of +40 is considered overbought and -40 is oversold.
TAS Ratio is especially effective when traders are aiming to time entry points into emerging intraday trends which can be observed when the price is making new “higher lows” or alternatively when price is making new “lower highs.”
TAS Ratio is a sensitive indicator by nature and should be viewed as a tool for fine-tuning a more granular entry or exit within the scope of other TAS Indicators.
TAS Ratio is useful in confirming when price may be at an area of divergence to locate and target higher probability entries and exits.
In general, price should move freely in the same direction of the indicator and in a proportionate range of movement.
When price fails to move proportionately, as much as TAS Ratio moves or stalls, this divergence alerts you to focus on immediate areas of support and resistance.
When price stalls and TAS Ratio does not stall, this is an indication to seek confirmation for a valid counter-trend trading opportunity.
Pay attention to TAS Ratio (orange line) crossovers above and below the Moving Average line (purple line), but also observe the trajectory and whether the Ratio line is pulling away and creating greater distance from the Moving Average line. Increasing distance is a sign of strength of move in that direction.
∟ ABOUT TAS YIELD ZONES:
TAS Yield Zones provides a valuable visual warning via a yellow background color when TAS Navigator and/or TAS Ratio indicators are exceeding specific overbought or oversold threshold lines dictated by the user. The indicator is visible in the same bottom pane as these two indicators. The user controls how extreme of the overbought or oversold condition they mandate in order to trigger the “Yield Zone” warning for each indicator based on the inputs for the TAS Yield Zones threshold lines.
INPUT SETTINGS FOR TAS YIELD ZONES:
Within the Input settings, you can activate or deactivate the visibility of TAS Yield Zones for TAS Navigator or TAS Ratio. By default, both will be visible. There are 4 inputs for TAS Yield Zones and below you’ll find the default settings:
Yield Zones Nav Overbought Line: 40 (red line by default)
Yield Zones Nav Oversold Line: -40 (green line by default)
Yield Zones Ratio Overbought Line: 40 (gray line by default)
Yield Zones Ratio Oversold Line: -40 (gray line by default)
The farther away the Inputs are from the 0 line, the stronger the move must be bullish or bearish in order to get to the threshold lines. For instance, Inputs of 50/-50 would require a more substantial move than 30/-30 settings. Additionally, the user can adjust the coloring of the TAS Yield Zones inside the Style settings.
TAS Yield Zones are best used in conjunction with TAS Navigator and TAS Ratio so the user can visually see when the threshold lines are near being approached and exceeded. When all three indicators are visible on the pane, you can see when there is a confluence of overbought or oversold conditions simultaneously on both TAS Navigator and TAS Ratio indicators and when exhaustion warning conditions are present. When these three conditions occur, there is a likelihood that a move in the opposite direction (or at a minimum a sideways condition) may be near.
Trade Well My Friends,
TAS Boxes + TAS Vega + TAS Compass [TASMarketProfile]This bundle of 3 TAS Market Profile indicators provides a shaded background that reveals directional bias, colored price bars show clearly when breakout conditions are bullish (green) or bearish (red) as well as 3 real-time dotted lines that show developing commercial balance areas known as “value areas.” These TAS Boxes 3 lines are calculated in real-time and leveraged to identify trade entry zones, trailing stops and targets. The 3 indicators can be activated and applied to a chart simultaneously (as shown) or individually in the Inputs settings tab. This description contains descriptions for all 3 indicators in the order of TAS Boxes, TAS Vega and TAS Compass so you’ll need to scroll below to get to the one you want insight.
∟ ABOUT TAS BOXES:
TAS Boxes (also known as TAS Dynamic Profile) offers a dynamic representation of developing commercial balance areas known as “value areas” and are depicted with 3 colored horizontal dotted lines. Note that the thickness of the dotted lines may be adjusted in the Style settings.
Red Line- Supply / High Value Area (HVA) / Resistance
Cyan Line- Point of Control (POC)
Green Line- Demand / Low Value Area (LVA) / Support
The TAS Boxes calculate and display in real-time intrabar and are finalized at the close of the bar. The levels may dynamically update intrabar and move and this is viewed as foreshadowing of where new value areas may be attempting to appear next. When the market is between the top and bottom lines, the market is considered “in value” or “in balance.” When the market closes outside the top or bottom lines, the market is considered out of value/unbalanced and in breakout mode in that direction.
INPUT SETTINGS FOR TAS BOXES:
There are 3 inputs for TAS Boxes and below you’ll find the default settings:
MinSignal_123: 2 (only options are 1, 2, or 3)
Length: 7
MapLength: 7
MinSignal_123 -- Measures how established the commercial interest creating the balance area must be to create a new TAS Box. In other words, this input is a measure of the strength of the box.
Length –- Takes into consideration the relative “momentum” behind the move and how extended the move must be before the formation of new TAS Box levels.
MapLength –- Specifies the number of bars of data used to create the parameters of the TAS Box.
In summary, the first two inputs determine how often a new TAS Box will appear. The higher the input numbers the less often and harder it is to establish a new TAS Box, and vice versa. The last input simply determines how much data is included in the calculation of the new TAS Box.
While we recommend the default 2-7-7 as standard inputs for most traders as they work well with any tradable instrument with sufficient liquidity, other input combinations can be explored per the user’s preferences for varying sensitivity to market conditions and how recent of market conditions. Other settings to consider are 2-14-7 or 3-4-50. We invite the user to explore the cause and effect of changing the settings but doing so only after they have mastered an understanding of the strategy deployment with the defaults. The vast majority of users do not change the default settings.
WHAT MARKETS AND TIMEFRAMES CAN BE TRADED?
TAS Boxes can be displayed on Stocks, ETFs, futures, Forex and digital currencies. TAS Boxes can be applied to a chart of any time frame (e.g. 1-minute, 5-minute, 20-minute, daily, weekly, etc.) and will also function with many other style charts such as Range and Renko. Boxes displayed on longer time frames designate more significant balance areas and can be used to locate higher probability entries. Boxes on shorter time frames can be used to identify if the tradable instrument is currently in balance or breaking out, and pinpoint entries accordingly.
INTERPRETATION AND BASIC RULES:
HEIGHT OF BOXES: The height of the TAS Boxes from top line to bottom line is a measure of volatility. When taller Boxes are present and subsequent Boxes expand, this means the volatility of the market has increased. When the height of the Boxes is smaller or contracting, then we are experiencing a market in decreasing volatility or consolidating.
WIDTH OF BOXES: The width of the TAS Boxes are a measure of significance. The longer TAS Boxes have remained at the same levels, the higher the impact they will generally have as support or resistance levels, and in the instances they are breached the market may experience fast and vertical movement.
The TAS Boxes are used to identify high-probability zones for trading both inside the range of the Boxes and also when in breakout mode outside the Boxes:
>>> When price is trading within the boundaries of a normal to wide range commercial
balance area, we can consider trades within the range of the Boxes and should look for entries around the support (green line) or resistance (red line) areas with profit targets around the POC (cyan line) or opposite boundary.
>>> When taking trades near both the upper and lower boundaries, we like to see the POC
near the middle of the box’s range. This is known as a “symmetrical box” as pictured below.
>>> If the POC is plotted tightly close to or at the same price level as the green or red line, we refer to this as forming a “wall” or "plywood" and anticipate stronger commercial interest providing support or resistance in those areas.
>>> When trading above or below the current box, price is said to be in breakout/breakdown mode. During these modes, one should be getting out of any opposing positions that are not in the direction of the breakout. Not all breakout/breakdowns are created equal. Moves outside of TAS Boxes when the vertical distance from Top to Bottom is minimal will tend to have more powerful moves, especially in instances when there are recent long-range bars in the direction of the break.
>>> When markets are breaking out or down outside of Boxes, if there is sizeable space before you encounter recent historal TAS Boxes levels that is favorable for good follow through of the move. Prior TAS Boxes levels do serve as as areas the market may encounter friction and go sideways for a period of time.
MANAGING RISK WITH STOP LOSSES:
We highly recommend the use of stop losses when trading. You can place stop losses outside of the 3 lines of TAS Boxes and trail them behind the market as new Boxes appear in the direction of the trade. You may also move trailing stops among the 3 levels to suit your risk tolerance (e.g. when market is in breakout mode, trailing it from out the Boxes to outside the POC level or opposing level). You can start your initial stop outside the opposite of all 3 lines or on the other side of the POC for lower risk.
∟ ABOUT TAS VEGA:
TAS Vega changes the coloring of the price bars to provide a more meaningful interpretation of when markets are in balance (based on TAS Boxes) or in bullish/bearish breakout mode. There are four colors generated for TAS Vega:
GREEN – Bullish breakout / Don’t be short
RED – Bearish breakdown / Don’t be long
ORANGE – 1st bar back inside TAS Boxes after prior move outside.
GRAY – Balanced, each subsequent bar after the 1st bar closes inside Boxes.
INTERPRETATION AND BASIC RULES:
WHEN VEGA IS GREEN:
Don’t be short.
Consider longs only or retain existing long positions.
Entering on the bar close above the Boxes is higher probability than intrabar entry.
Many consecutive bar closes above Boxes increases probability of eventual move higher.
WHEN VEGA IS RED:
Don’t be long.
Consider shorts only or retain existing short positions.
Entering on the bar close below the Boxes is higher probability than intrabar entry.
Many consecutive bar closes below Boxes increases probability of eventual move lower.
WHEN VEGA IS ORANGE:
If orange due to closing back inside Boxes of your initial entry Box, hold.
If orange due to closing inside a new Box appearing in the direction of your trade (higher Boxes for longs, lower Boxes for short) consider this a potential 1st tier profit-taking opportunity for multi-lot/shares positions. If single units, exit is at the trader's discretion contingent on the extent of the move.
It is prudent risk management to also use the appearance of orange closed bars as a reminder to trail your stop loss behind the new TAS Boxes levels.
Many times you may see many orange bars over a series of bars (not consecutive, however) and this means the market continues to explore both sides of TAS Boxes and is indecisive about intentions. Be cautious at these times.
WHEN VEGA IS GRAY:
Gray bars simply means the bar has closed in balance within the value area of TAS Boxes.
Gray bars are not a cue to exit a position necessarily. It is just a visual that the bar has closed in the value area. Often a trending move will have many periods that the market closes back inside new Boxes that are appearing in the direction of the trend and your largest trades will require that you simply adjust your trailing stop rather than exit with gray bars.
It is prudent risk management to also use the appearance of orange closed bars as a reminder to trail your stop loss behind the new TAS Boxes levels.
Many times you may see many orange bars over a series of bars (not consecutive, however) and this means the market continues to explore both sides of TAS Boxes and is indecisive about intentions. Be cautious at these times.
The user can adjust the coloring of the TAS Vega bars in Style settings.
∟ ABOUT TAS COMPASS:
TAS Compass changes the background color of the chart to reveal the directional bias of the market. It may be applied to charts in any timeframe for stocks, ETFs, futures, Forex and digital currencies.
There are two colors generated for TAS Compass:
GREEN – Bullish directional bias
RED – Bearish directional bias
INTERPRETATION AND BASIC RULES:
The directional bias is established (or changes) when a bar closes outside of TAS Boxes levels. When a market closes above the TAS Boxes, it will establish a bullish bias (green background) and this will remain intact until there is a close below the TAS Boxes. At the time there is a bar close below the TAS Boxes, then the TAS Compass bias changes to bearish bias (red background). This sequence continues back and forth indefinitely. When using TAS Compass, one should still follow the prudent rules and best practices of TAS Boxes as there may be opportunities to exit a losing position sooner by doing so even in the instance a TAS Compass directional bias has not changed.
TAS Compass can be used as a stand-alone visual cue on a chart, but will have accentuated value when used in conjunction with TAS Boxes and TAS Vega indicators included within this bundle.
Below is an example showing TAS Compass with TAS Boxes in order to show how the closes outside of TAS Boxes is the trigger to the background color change logic.
Trade Well My Friends,

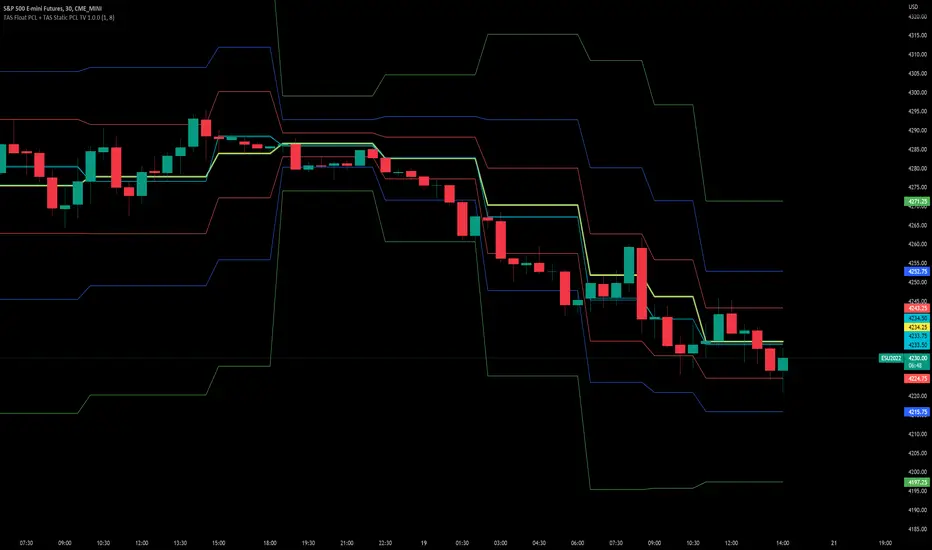
TAS Float PCL + TAS Static PCL [TASMarketProfile]TAS PRICE COMPRESSION LEVELS (PCLs) includes 2 distinct indicators that use volume at price analysis, volume aggregation and multi-timeframe confluence to calculate and display significant levels of commercial interest above and below the market. These levels reveal reliable trading levels which can be leveraged for enhanced trade entries, trailing stops and targets.
THERE ARE TWO TYPES OF TAS PCLs:
TAS Float PCLs - These levels take into account new data flow throughout the trading session and expands or contracts the levels dynamically in accordance with changing market conditions. These are often referred to by traders as “Floaters” or “Dynamic PCLs.”
TAS Static PCLs - These levels are set upon the start of the trading session and remain intact throughout the duration of the session. Many traders These are often referred to by traders as “Statics.”
Both TAS Floaters and TAS Statics have up to 10 horizontal lines available to display. The four center lines are referred to as Points of Control (POC). Three of these lines are colored cyan and one is yellow. The yellow line is more prominent and referred to as the Master Point of Control (MPOC) of the Price Compression Levels on display. The first area of commercial suppor t and resistance are plotted with red lines on both sides of the POC lines and commonly referred to as S1 and R1 levels. The next level of support and resistance areas are designated by blue lines (S2 and R2 levels) and then lastly the farthest from the POC lines are the green lines (S3 and R3 levels). By default, typically the green lines are not displayed but can be activated on an “as needed” basis within the indicator Style settings.
EXAMPLE OF TAS FLOAT PCLs:
ABOUT TAS FLOAT PCLs:
The TAS Dynamic PCLs (Floaters) reveal the price areas that attract commercial interest based on the current market conditions.
How the PCLs are plotted can be adjusted with two inputs controlled by the user.
----------1) MinSignal_123: This setting controls the sensitivity of the calculations. The default is set to 1 and this represents the most sensitive input that makes it easiest for market conditions to trigger new PCL levels. A setting of 2 is considered “medium” sensitivity and lastly a setting of 3 would require the most substantial change in conditions to trigger an adjustment of PCLs on the chart.
----------2) Length: This input setting determines the number of bars of data included in the calculation for new TAS Float PCLs to be adjusted on the chart. The default is set to 8.
MORE ON INPUT SETTINGS:
Using higher values in both inputs will display more significant areas of commercial interest for higher probability support and resistance levels around PCLs. These are referred to as “slow” Floaters.
Using lower value inputs will create Floaters that are more responsive to market conditions. These are referred to as “fast” Floaters.
When fast Floaters are contracted (cover a narrow range of prices) the market is tightly balanced and can easily enter into breakout conditions, if price closes outside of the TAS Float PCLs.
Expanded Floaters that are wider apart provide for greater rotational range trading conditions.
BELOW ARE THE RECOMMENDED INPUT SETTINGS COMBINATIONS THAT WILL DICTATE HOW RESPONSIVE THE PCLs WILL REACT TO CONDITIONS:
FAST (default): 1 - 8
MEDIUM: 2 - 14
SLOW: 3 - 34
The user will typically choose to have either Statics or Float PCLs active on the chart at a time, but not both as you'll have up to 20 levels on your chart (too many). You can, however, put them on different panes. Visit the INPUT settings of the indicator to select which one you want active.
The user can change the coloring, line type and thickness in the STYLE settings.
ABOUT TAS STATIC PCLs:
Many traders opt for TAS Static PCLs because they prefer to know the significant commercial interest price areas before they trade.
Unlike Floaters, TAS Static levels will not change throughout the trading session and are only affected if the user changes the opening and closing time parameters for the trading session displayed. By default, Static levels will recalculate and display new levels upon the reopen of the next session.
Tightly compacted POC lines designate an area of particularly strong commercial interest that provides higher probability, lower risk entries for extended directional moves. These areas are often referred to as “walls.”
If the POC lines are spread out over a wider range, a trader should be on the lookout for a more rotational trading session.
Periodically, one of the POC lines may be plotted outside of a red line (S1 or R1). In this case, the market may be biased in the same direction that the POC line is in relation to the red line.
TAS PRICE COMPRESSION LEVELS can be used as a stand-alone trading guidance system or in conjunction with other popular TASMarketProfile indicators.
Trade Well My Friends!
Volume with forceThis indicator shows the classic stock volume chart with a plottable 20 periods SMA line. Along with this, it shows to the top right of the pane a percent, showing the current "volume force".
This force is calculated as the SMA of the last 3 volume candles excluded the current candle (only counts finished candles) and then compare it with the standard 20 periods volume SMA.
Some examples for a better understanding:
A value of 200% means that the SMA of last 3 candles is equals to 2 times of the 20 periods volume SMA
A value of 100% means that the SMA of last 3 candles is equals to the 20 periods volume SMA
A value of 50% means that the SMA of last 3 candles is equals to 1/2 of the 20 periods volume SMA
A value of 25% means that the SMA of last 3 candles is equals to 1/4 of the 20 periods volume SMA
If the value is above 100%, the background will be green, red otherwise. A green value means that the symbol is having a nice volume income.
Customizable settings
Timeframe: the main TF to plot volume and calculate force
MA Length: the length of the standard volume SMA to plot (and to compare for the force calculation)
Diff force length: the length of the last candles (excluded the current candle) to compare with the standard volume SMA
Show moving average: if checked, plots the standard SMA
Show volume force: if checked, shows to the top right the volume force

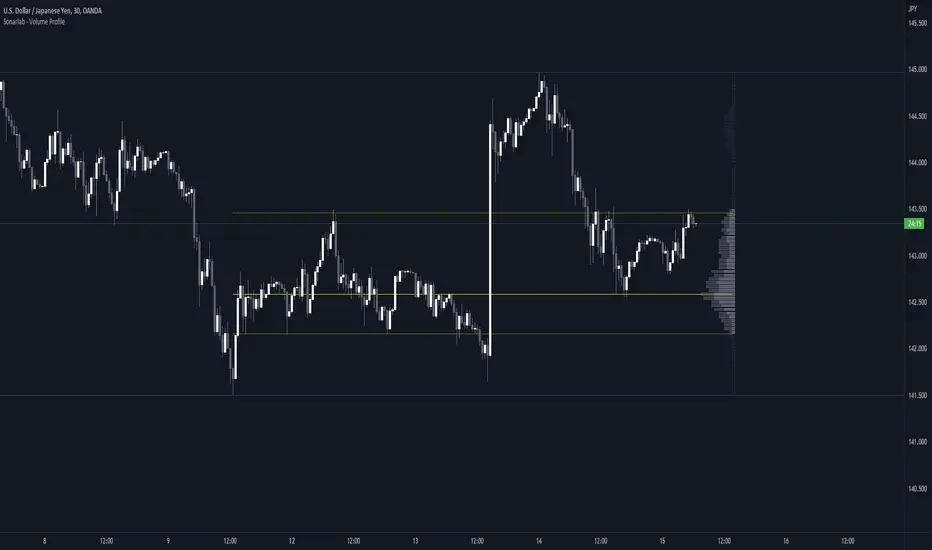
Sonarlab - Volume ProfileThis Volume Profile is a charting tool that traders use to show the traded volume amount over a given time period. The reason we build this volume profile indicator is to confirm S&D zones and show where the most volume is resting in a specific given time.
Settings
- Auto Placement: Option to have the Volume Profile automatically placed
- Manual Placement: Able to place and move the Volume Profile anywhere of your choosing
- Bull vs. Bear Candle Style
- Up/Down Candle Style
- Highlight Point of Control (PoC)
Usage:
Focused on combining with SMC:
When trading SMC, normal volume profiles can be confusing and hard to trade - since it will catch the volume on the overall chart you're on. When trading SMC, we are interested in catching specific parts in a range which defines supply or demand.
What makes this volume profile different?
The Sonarlab Volume Profile is focused on combining with SMC, integrated with Smart Money Concepts (SMC) levels, such as the Swing High and Low levels. The Indicator will automatically find the most applicable position using our custom Swing Levels to provide users with maximum utility with zero effort. Where other volume profiles are more focused on overall volume, this volume profile is focused on volume in a specific range on automation using swing points in the market.
As in this example, the high volume areas are matching with traditional supply and demand zones. The price level with the most volume is highlighted by the "point of control" (POC), displayed by the yellow line. We can consider price will react from those "high volume" areas and trade more easily through "low volume" areas.
Overnight inventoryThe indicator is dedicated for market / volume profile traders. It presents overnight inventory as a yellow number next to the indicator name on your charts. It does not plot anything.
If the number is positive then the inventory is net long and vice versa.
It is calibrated for US indicies, so it makes sense to use it only on US futures.

Volume Profile, Pivot Anchored by DGTVolume Profile (also known as Price by Volume ) is an charting study that displays trading activity over a specified time period at specific price levels. It is plotted as a horizontal histogram on the finacial isntrumnet's chart that highlights the trader's interest at specific price levels. Specified time period with Pivots Anchored Volume Profile is determined by the Pivot Levels, where the Pivot Points High Low indicator is used and presented with this Custom indicator
Finally, Volume Weighted Colored Bars indicator is presneted with the study
Different perspective of Volume Profile applications;
Anchored to Session, Week, Month etc : Anchored-Volume-Profile
Custom Range, Interactive : Volume-Profile-Custom-Range
Fixed Range with Volume Indicator : Volume-Profile-Fixed-Range
Combined with Support and Resistance Indicator : Price-Action-Support-Resistance and Volume-Profile
Combined with Supply and Demand Zones, Interactive : Supply-Demand-and-Equilibrium-Zones
Disclaimer : Trading success is all about following your trading strategy and the indicators should fit within your trading strategy, and not to be traded upon solely
The script is for informational and educational purposes only. Use of the script does not constitutes professional and/or financial advice. You alone the sole responsibility of evaluating the script output and risks associated with the use of the script. In exchange for using the script, you agree not to hold dgtrd TradingView user liable for any possible claim for damages arising from any decision you make based on use of the script

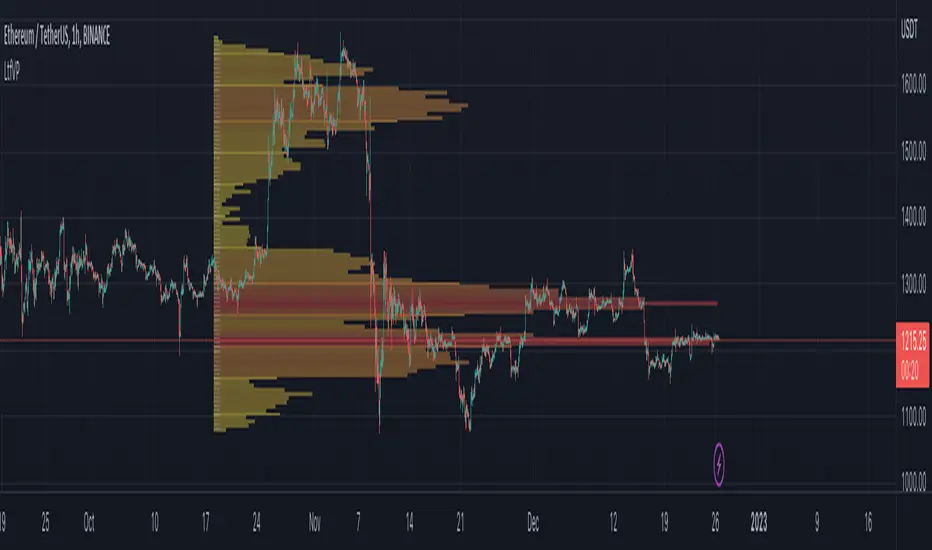
Volume Profile PremiumHello, my friends, this is a new fine-grained volume profile indicator. As is known to all, the volume profile indicator is a charting tool that shows how much volume has occurred at each price throughout the trading session. The volume profile indicates the prices favored by the market or those ignored by the market, which can give traders clues as to where prices are likely to go shortly.
(1) Indicator description
This indicator is based on the function "request.security_lower_tf". See the related usage note for details if you need it.
Support for obtaining volume from a lower timeframe than the current chart and calculating a more fine-grained volume distribution
Due to the increased complexity of the calculation, you need to set a reasonable timeframe to avoid calculation timeout.
(2) Key parameters
- Support/Resistance Clustering
Max of Lookback Forward: The maximum number of historical K-lines
Min Resolution (Minute): lower timeframe, unit: minute
Display Volume Profile: ways to display volume profile
Rows of Volume Profile: rows of volume profile
Placement of Volume Profile: location of volume profile
Width of Volume Profile: width of volume profile
Horizontal Offset: horizontal offset of volume profile
Happy trading, and enjoy your life!
————————————————————————————————————————
各位朋友大家好,这是一个具有更高细粒度的成交量分布指标。众所周知,成交量分布是一种图表分析工具(或指标),它显示了在整个交易时段内每个价格上发生了多少成交量。 成交量分布指出了受到市场青睐的价格以及被市场忽略的价格,这可以为交易者提供有关近期价格可能走向何方的线索。
(1) 指标说明
该指标基于 request.security_lower_tf 函数,详情可以查看相关使用说明
支持从比当前图表分辨率更低的时间周期获取成交量,并计算更加细粒度的成交量分布
由于增加了计算复杂度,您需要设置合理的时间周期以避免计算超时
(2) 关键参数
- Volume Profile Parameters
Max of Lookback Forward: 用于统计成交量分布的最大回顾的K线数量
Min Resolution (Minute): 细粒度的时间周期
Display Volume Profile: 展示成交量分布的方式
Rows of Volume Profile: 成交量分布的行数
Placement of Volume Profile: 成交量分布的位置
Width of Volume Profile: 成交量分布的宽度
Horizontal Offset: 成交量分布的水平偏移
祝大家交易愉快

Interactive Volume Profile - Based on LTF volumeHere is my first attempt on defining volume profile. In this script, I am using new feature of pine security_lower_tf
Upon loading the script, it will ask users to select Time range to show the volume profile. Once you select the time range, confirmation input will popup. Upon confirming the inputs, you will be able to view the volume profile
Settings are pretty simple. Some of them appear as part of confirmation.
Limitation due to availability of LTF bars
security_lower_tf can only fetch upto 100k bars, Hence, if we move the starting point beyond that, we will only see volume profile from the bar where LTF volume data is available. Increasing lower timeframe resolution will also increase the available range of volume profile. Option also available to use max range instead of time based range. If max bar range is selected, then volume profile is drawn based on all the bars for which LTF volume is available.
An example of all combinations are show below.
Selecting the granularity of volume profile
Number of levels can be set from settings which impacts the granularity of volume profile. Below is the example of how different values for number of levels behave.
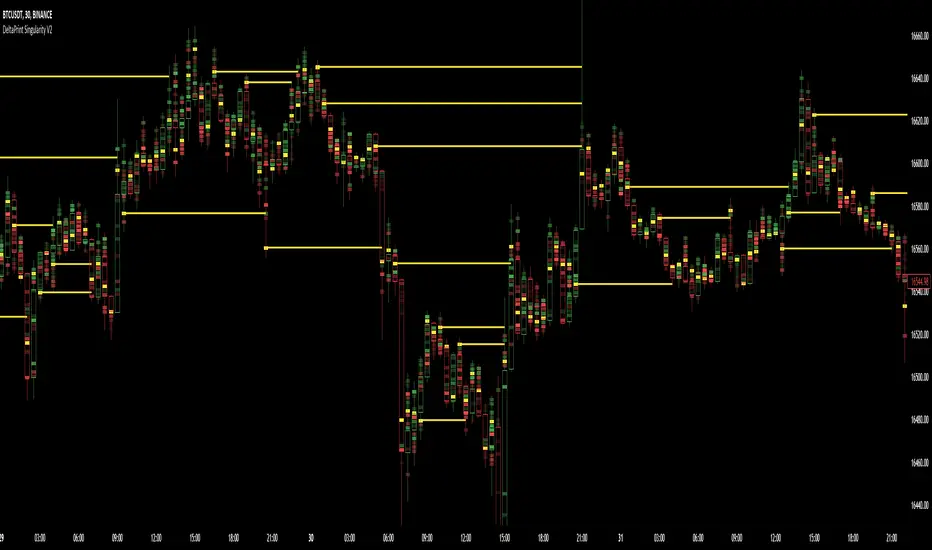
DeltaPrint SingularityDeltaPrint Singularity
DeltaPrint Singularity is a method of bringing a previous DeltaPrint Candles with less granularity but greater historical reference.
The advantages is the ease of use with existing charts and indicators without adjusting for low tf chart for UI Space this is all handled on the same timeframe using intrabar data.
The benefit of such candles is providing users additional data as to location of potentially trapped traders via late entry into positions e.g. late longing a range high or VAH.
Or to provide credence to traders who look for momentum plays seeing momentum drop off likely leading to a period of consolidation or pull back.
The logic used here is different to the previous rendition of the indicator but works well with any and all charts that allow some reference to volume.
This indicator aims to provide users the insight into how traders are positioning and where they are positioning. The indicator comes with a few initial features:
Singular Coloring
Delta Coloring
POC Highlighting
Singular Coloring is useful by providing a minimalist view into volume execution points.
Delta Coloring breaks this down further by providing an estimate into ask:bid (although delta print will be stronger at this)
POC highlighting provides only the volume POC and not Delta POC.
Planned Updates
Delta Weighting
POC Level Extensions
Alerts
MACD Volume S2 By Gammaprod>> How to use this indicator :
1. Set your teadingview theme to dark theme.
2. My indicator is valid for forex, stock and but more valid for crypto.
3. Use three timeframe for more validation (choose between those, that fit to your trading style) :
- Timeframe 1m, 5m, and 15m for Scalping
- Timeframe 30m, 1h and 4h for Intraday
- Timeframe 4h, 1D and 1W for Swing Trading
4 . Always use THREE INDICATORS FROM GAMMAPROD, those three indicators is back to back each other, by the way, I only made those three indicators only (for now) :
- Trendlines Boll Ichi Crypto by Gammaprod
- Stoch RSI Divs Zone Crypto by Gammaprod
- MACD Volume Crypto by Gammaprod
>> How to setting :
1. Trendlines Boll Ichi Crypto by Gammaprod
A. Support and Resistence
- Well if you familiar with this indicator you can add it, but recommended for Timeframe 30m or more
B. Trendlines Primary or Trendlines Secondary
- Timeframe 1m you DON'T NEED Trendlines Primary or Trendlines Secondary
- Timeframe 5m you DON'T NEED Trendlines Secondary, but you CAN ADD Trendlines Primary if you fell it helpful (for me, it is helpful to find where the candles start or the end trend or a consolidation or where the candles will surpass a resistance or a support).
- Timeframe 15m you DON'T NEED Trendlines Secondary, DEFENITELY add Trendlines Primary it will help to find where the candles stop or a consolidation or where the candles will surpass a resistance or a support).
- Timeframe 30m or more, DEFENITELY NEED BOTH Trendlines Primary and Secondary Trendlines, it will help to find where the candle stop or consolidation or where the candle will surpass a resistance or support).
C. Bolinger, Ichimoku Cloud and Lagging Span
- Please DON'T CHANGE IT at all, it's really helpful to know when and where to make an entry decesion or a trend or a consolidation, if you don't understand how to read it, you better to learn it first (on "how to read" section and "How to OPEN position" the section below)
2. Stoch RSI Divs Zone Crypto by Gammaprod (DON'T CHANGE IT)
3. MACD Volume Crypto by Gammaprod (DON'T CHANGE IT)
>> How to read :
1. Sell or Buy Priority :
A. Buy Priority
- Color background on macd and stoch rsi is pink or purple sell is the priority, (if you're not sure to buy, just wait until the best moment to sell)
B. Buy Priority
- Color background on macd and stoch rsi Teal or light green buy is the priority, (if you're not sure to sell, just wait until the best moment to buy)
C. Indecision / Golden Moment
- Color background on stoch rsi yellow is indecision / golden moment of reversal pattern (wait until it formed background only on Stoch RSI), please becareful at this moment.
2. Trend / Consolidation :
A. BULLISH trend
- When Stoch RSI and MACD have teal or light green background that's means BULLISH trend, better to confirm by the candle is above green cloud and lagging span (red line) is also above the candle.
B. BEARISH trend
- When Stoch RSI and MACD have the Pink or purple background that's means BEARISH trend, better to confirm by the candle is above purple cloud and lagging span (red line) is also below the candle.
C. CONSOLIDATION
- When Stoch RSI have the mix background that's means CONSOLIDATION, better to confirm by the candle is in or near to green / purple cloud and lagging span (red line) is also on the candle.
3. Special Mark
A. Ideal Bullish :
- Near line 20 and green / teal background = When Stoch RSI have the char R / H on lime color label, that's means divergence or hidden divergence for buy position, if you not see this label that's means just a standard confirmation for buy
B. Not an Ideal Bullish :
- Near line 80 and green / teal background = if this happens make sure you know what happen, it could be a false signal or bullish continual pattern
C. Ideal Bearish :
- Near line 80 and pink / purple background = When Stoch RSI have the char R / H on lime color label, that's means divergence or hidden divergence for buy position, if you not see this label that's means just a standard confirmation for sell position.
D. Not an Ideal Bearish:
- Near line 20 and pink / purple background = if this happens make sure you know what happen, it could be a false signal or bearish continual pattern
E. The Beginning of Reversal (from BEARISH to BULLISH) :
- When Stoch RSI line shaping GREEN position is near 20.
- MACD lines still PINK, position lines is UNDER the HISTOGRAM, but the HISTOGRAM start to SHAPE FALL PINK (light pink) and the BACKGROUND still PINK / PURPLE.
- Position CANDLES NEAR BLUE line, NEAR PURPLE CLOUD, and lagging span (red line) STILL ON the area candle. (it used to be confirmed with the golden moment).
F. The Beginning of Reversal (from BULLISH to BEARISH) :
- When Stoch RSI line shaping PINK position is near 80.
- MACD lines still GREEN, position lines is ABOVE the HISTOGRAM, but the HISTOGRAM start to SHAPE FALL GREEN (light green) and the BACKGROUND still TEAL / GREEN.
- Position CANDLES NEAR WHITE line, NEAR TEAL CLOUD, and lagging span (red line) STILL ON the area candle. (it used to be confirmed with the golden moment).
G. False Signals, or It could be a Golden Moment (better to see it on TF 15 or bigger):
- Near line 20 or 80 and yellow background = When Stoch RSI have the char R / H on color label, that's means divergence or hidden divergence for buy / sell position, if you not see this label that's means just a standard confirmation for buy / sell depends on where the Stoch RSI line if near 20 that's means buy, near 80 means sell
>> How to OPEN position:
A. Bullish
1. Trendlines Boll Ichi Crypto by Gammaprod
- The candles above the green cloud.
- Lagging span (red line) above the candles.
- then open buy near yellow line (the first option) / blue line (the second option) (always confirm the position with two other indicators below).
2. Stoch RSI Divs Zone Crypto by Gammaprod
- Teal or Green background.
- The lines is shaping green.
- Better if on the bottom (at a range 20).
3. MACD Volume Crypto by Gammaprod
- Teal or Green background.
- The lines is shaped or shaping green.
- Better if at the green histogram.
B. Bearish
1. Trendlines Boll Ichi Crypto by Gammaprod
- The candles below the purple cloud.
- Lagging span (red line) below the candles.
- then open buy near yellow line (the first option) / white line (the second option) (always confirm the position with two other indicators below).
2. Stoch RSI Divs Zone Crypto by Gammaprod
- Pink or purple background.
- The lines are shaping pink.
- Better if the line on the top (at a range 80).
3. MACD Volume Crypto by Gammaprod
- Pink or purple background.
- The lines are shaped or shaping green.
- Better if at the pink histogram.
C. Consolidation
1. Trendlines Boll Ichi Crypto by Gammaprod
- The candles on the cloud (green or purple).
- Lagging span (red line) on the candles.
- then open buy near the white or blue line (always confirm the position with two other indicators below).
2. Stoch RSI Divs Zone Crypto by Gammaprod
- Mix background specially on a timeframe 15m or more.
- The line move fast up and down.
- Better if on the bottom or the top of the lines (at a range 20 or 80).
3. MACD Volume Crypto by Gammaprod
- Changing the background.
- The line is near the middle line.
- Have small Histogram.
>> The secret ingridient is comparing the timeframe :
The example scalping (Timeframe 1m, 5m and 15m)
- TF 1m is for making an open position.
- TF 5m is for making a judgement of the trend market.
- TF 15m is to confirm that judgement from TF 5m, be careful if it not similar then it used to be a consolidation or the beginning of the reversal.
There's a lot a way to open the position than above information that i gave it to you, but consider there are a limit char on this column, I hope it will help your trading and make a more profit on it.

[VC] Effort & Result Index V1.0V.C. Effort & Result Index draws the Price change, Volume, Delta & Delta % as a histogram. On the positive side of the histogram, it marks the price change & on the negative side of the histogram, it marks volume, delta & delta %. And the best part of the indicator is that it allows you to see all the mentioned data types simultaneously.
See the below chart for a comprehensive understanding.
Before moving further, understand the below analogy first.
Volume & Delta = Fule or Effort
Price Movement = Result
Think of Volume & Delta as FULE or EFFORT and Price Movement as Result.
If the price travels a significant distance with less fule & effort, it indicates that no barriers or inverse forces are stopping the price movement.
On the other hand, if the price is travelling a less distance & consuming comparatively more fule & effort, it indicates some barriers or inverse forces stopping the price movement.
V.C. Effort & Result Index empowers you to read, compare & analyse Volume, Delta & Price effortlessly. It helps to measure the relative price change in different combinations. Such as, you can compare the price change with total volume, delta volume & delta percentage.
See the below relative comparison analysis by using Price Change, Volume Change & Delta Change.
In the above example, you can see that on candle A, there is a very significant price move with a small volume & delta. But on the next candle B, there is a minor price move compared to the previous candle A, but the volume is relatively high & delta is almost the same. In simple words, the same effort was applied to candle B but got fewer results than candle A. It indicates that buyers applied the same effort but failed to get the same results. It reveals that sellers are taking control, leading to a trend reversal.
This comparative analysis method & approach can add an extra edge to your analysis spacially on key levels & breakouts.
V.C Effort & Result Index Settings & Inputs
Price Change:
Allow you to show/hide the price change bars on the positive side of the histogram.
Volume:
Allow you to show/hide the total volume on the negative side of the histogram.
Delta%:
Allow you to show/hide the delta % on the negative side of the histogram.
Delta:
Allow you to show/hide the delta on the negative side of the histogram.
Style Settings
The Style section allows you to change the colors & the view format of all data types.
Disclaimer Note:
V.C Effort & Result Index is not a BUY/SELL signal based indicator or a holy grail trading system.
It is purely Volume, Delta, Demand & Supply imbalance and comparative analysis based tool kit. Before applying this indicator to your analysis, you should know about Volume, Delta & Spread, and Demand & Supply.
Some basic understanding of Sir Richerd Wyckoff's Theory can also be helpful.

[VC] Box Chart Index V1.0The ''V.C Box Chart Index'' shows the shortest possible wave. It graphically shows the continuous up movement or continuous down movement in the form of a box. As soon as the direction changes, the box changes as well.
It is an effortless way to show the price change that occurred in the box visually. It also correlates to what Wyckoff said about as the buying waves increase in volume, time, and length & the selling waves shorten, lookout for a change in the prevailing trend.
The example below shows more big green boxes than red, and the price change caused by the green box has made the uptrend.
Important Note:
V.C Box Chart Index also correlates to another indicator named V.C Box Chart Histogram
V.C Box Chart Histogram draws the cumulative delta based on each box as a histogram. Combining these two indicators empowers you to see the cumulative demand & supply and buying & selling quantity of each box.
See the Example Blow:
The above example shows that supply is decreasing on down boxes, indicating that fewer sellers are left to pull the market down.
On the other hand, demand increases on the up boxes, indicating that more buyers are coming into the market. As a result, every green box is breaking the previous high & price is moving upside.
For a more comprehensive understanding of the co-relation of these two indicators, read the description from the link below.
V.C Box Chart Index Settings & Properties Explained
Border of Box:
Allow you to show/hide the border of the box
Positive Box & Negative Box Borders:
Allow you to change the border color & opacity
Positive Box & Negative Box:
Allow you to change the color & opacity of the box
Disclaimer Note:
V.C Box Chart Index is not a BUY/SELL signal based indicator or a holy grail trading system.
It is purely Volume, Delta, Orderflow, Demand & Supply imbalance and comparative analysis based indicator tool kit. Before applying this indicator to your analysis, you should know about Volume, Delta & Spread, and Demand & Supply.
Some basic understanding of Sir Richerd Wyckoff's Theory can also be helpful.

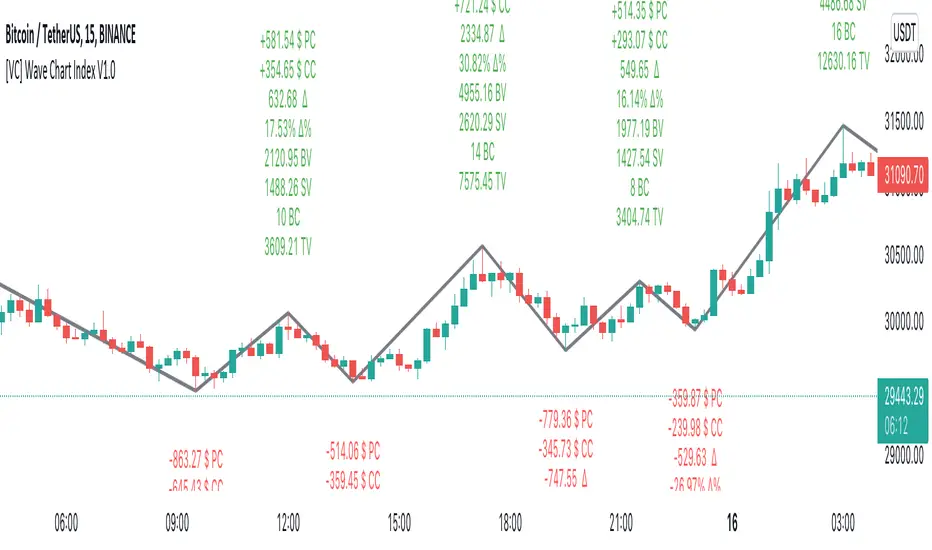
[VC] Wave Chart Index V1.0V.C Wave Chart Index
Richard D. Wyckoff created the first wave chart, and he instructed students to think in waves. He was an early 20th-century pioneer in the technical approach to studying the stock market and is considered one of the five "titans" of technical analysis, along with Dow, Gann, Elliott and Merrill.
V.C Wave Chart Index is the most comprehensive version of Wyckoff's theory. It is used to measure the strength & weakness of each market move by comparative data analysis. It draws waves on the chart based on Gann Swing theory. At the end of each wave, a label shows all the cumulative data & information of the wave.
With the help of this indicator, You can measure each swing or high/low movement of the market by comparing it with previous high/low price movements. The comparison can be made by using the following data of each wave.
Price Change
Volume Change
Delta Change
Delta % Change
Buy Volume
Sell Volume
Time Spent (Bar Counter)
V.C Wave Chart Index is not only an indicator but itself a unique & comprehensive tool kit to measure & compare each move of the market. This tool enables you to see deep inside each movement of the market. It allows you to observe the nitty-gritty data of each wave at the micro-level with your nacked eyes. With the help of Delta & (C.C) Close to Close Price Change, it is now easy to apply effort & result and cause & effect theory to your analysis. (total volume, buy volume, sell volume & delta % can also be used for comparative analysis)
V.C Wave Chart Index Properties
Price Change or (P.C): Shows the price Change of the Wave
Buy Volume (B.V): Shows the Cumulative Buy Volume of the Wave
Sell Volume (S.V): Shows the Cumulative Sell Volume of the Wave
Delta Volume (∆): Shows the Cumulative Buy - Sell Volume of the Wave
Delta % ∆ : Shows the Cumulative Delta % of the wave
Total Volume (T.V): Shows the Cumulative Total Volume of the Wave
Bar Count (B.C): Shows how much time it took to Complete the Wave
Swing Price: Shows the Reversal Price of the Wave
V.C Wave Chart Index Settings & Inputs Explained
Sensitivity (%): This input helps you adjust to the wave's steepness. 0.001 is my recommended value for all time frames.
Cumulation: This input helps you to control the length & formation of the wave: ( the fewer values = more wave formations & vice versa)
Wave Color: Allow you to change the color of the wave
Draw to Latest Candle: Allow you to show/hide the latest or real-time wave & data.
Divisor: Allow you to divide extensive numeric data into small numbers to read it easily.
Align Text: Allow you to align the text.
Size Text: Allow you to change the size of the text.
Display Toal Delta: Allow you to show or hide total Delta (∆).
Display Percentage Delta (%): Allow you to show or hide Delta (∆) %.
Color Wave Buy: Allow you to change the color.
Color Wave Sell: Allow you to change the color.
Display Total Volume (T.V): Allow you to show/hide total volume
Display Buy Volume (B.V): Allow you to show/hide buy volume
Display Sell Volume (S.V): Allow you to show/hide sell volume
Display Swing Price: Allow you to show/hide swing price
Display Swing Price Change (P.C): Allow you to show/hide price change
Display Close to Close Price Change (C.C): Allow you to show/hide close to close price changes. (previous wave close to current wave close) (recommended for comparative analysis)
P.C Format: Allow you to select the price formate
C.C Format: Allow you to select the price formate
Display Bar Counter (B.C): Allow you to show/hide the bar counter
Comparative Data Analysis Example in the light of Effort & Result Theory
A short explanation of the above analysis
On Wave A , the close to close price change (C.C) is $354 . (its the distance of price that price travelled from the low of the previous wave)
and price travelled this distance with 632 Delta (Delta is an effort which is used to travel the price)
On Wave B , close to close price change (C.C) is -$359 , almost the same distance as the previous wave. But for this distance price used 47% more Delta than the last wave. ( previous Delta is 632 , but current Delta is 931 that is 47% extra)
It indicates that sellers have put more effort in Wave B than Wave A . However, they got similar results as the previous wave. In other words
More Effort & Less Result = Reversal Sign
(that's why in the above example price reversed from a support level)
* Notice that Wave B is also on a key support area/level. And on key support or resistance area, this kind of comparative analysis can give an extra edge in your analysis.
Disclaimer Note:
V.C Wave Chart Index is not a BUY/SELL signal based indicator or a holy grail trading system.
It is purely Volume, Delta and comparative analysis based indicator. Before applying this indicator to your analysis, you should know about V.S.A, Volume, Delta & Spread.
Some basic understanding of Sir Richerd Wyckoff's Theory can also be helpful.
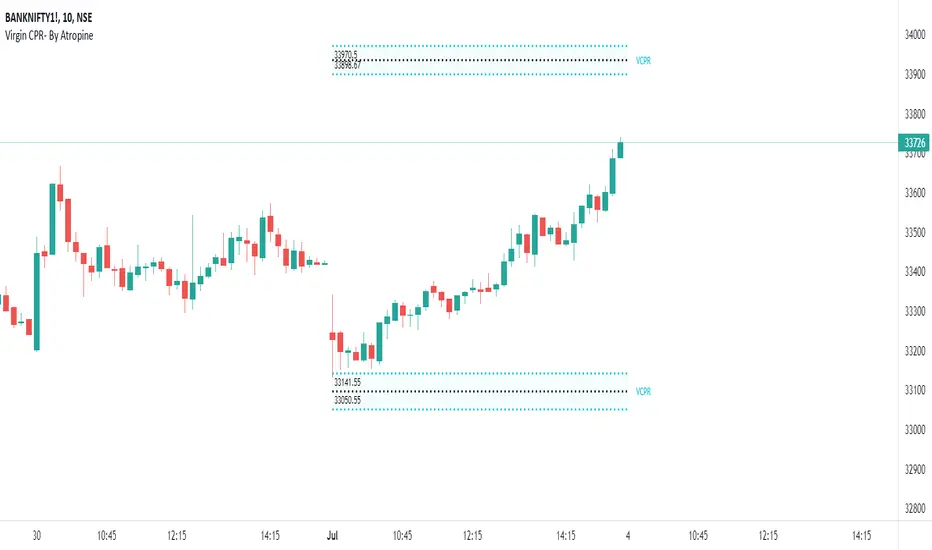
Virgin CPRAbout Virgin CPR-
If the price levels for a particular timeframe do not touch the CPR levels of the same timeframe, then that CPR is known as Virgin CPR .
There are a variety of ways you can use CPR indicator for your trading decisions.
1. CPR Breakout
2. CPR Width
3. CPR as Support and Resistance
4.Interpreting overall trend through CPR
About this Indicator-
• This Indicator Automatically plots Previous 30 / 60 days Virgin CPR and shift them for todays session.
• Gives Option to change Color, Style & Thickness of CPR lines and color of Background of CPR.
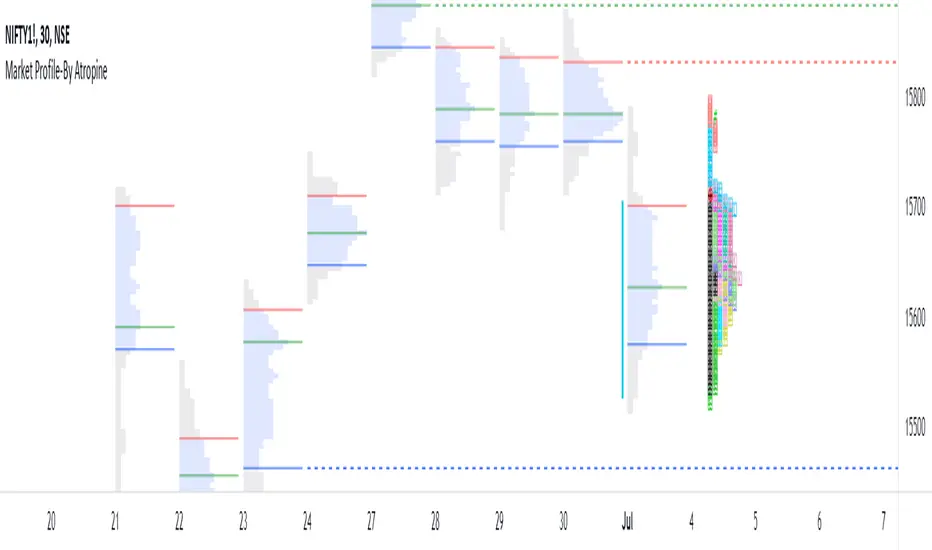
Market Profile-By AtropineWhat is Market profile ?
Market profile is a style of plotting "Price" on the Y-axis and "Time" on the X-axis, which most of the time form a bell-shaped image as the body of the profile.
It helps day traders identify Other Timeframe Participants (Big players) who have money and information power. short-term traders have to follow these big sharks which give direction to markets.
It provides an X-ray vision about the market as Value Area represents 70% of the day’s activity and this will give a clear picture of the current state of the market as it unfolds.
It works in all market conditions. Usually, a trading system or indicator works in certain market conditions like a trending or sideways market. There is no such restriction to Market Profile as it clearly shows the balanced and imbalanced market conditions in both directions all the time.
How does this Market Profile Indicator Works ?
Automatically plots TPO's for Each half an hour(30min) of the trading day, it is designated by a letter, which is also called Time Price Opportunity(TPO) for the current day. Indicator provides Option to Change TPO Text.
First 30 min range denoted with the letter ‘A,’ next 30 min range with the letter ‘B’ ,this two TPO are black colored which Indicates IB (Initial Balance) Range. IB Range is the first one-hour range in the market created by retail traders (most of the time).
Indicator plots TPO continue until the last range of the market, hence the last range is denoted with ‘M’ as the Indian markets currently trade from 9.15 am to 3.30 pm with the last session ‘M” is for only 15 minutes from 3.15 pm to 3.30 pm.
Letter ‘O’ indicates the open price level, which is red colored and Letter ‘#’ indicates the closing price level which is green in colored.
This Indicator gives you an Option to choose the color of each TPO's.
Two Methods of Market Profile one is ‘Split’ profile, and another is ‘Un-Split’ profile, Indicator gives Option to Split or Unsplit the last day profile.
This Indicator gives you an Options to extend Untested Lines(POC,VAH,VAL)The Price level in which maximum time was spent or maximum trading activity happened is called as Point of Control (POC).Value Area (VA) is the 70% price range around POC. It is the fair price of the Instrument on the particular day.
Retail traders can only provide market depth and liquidity, but they fail to give magnitude and direction to the price.
By the end of every trading day, the market profile chart shows not only what happened on that day, but also who is responsible and when it happened.