Pressure Zones with MA [SYNC & TRADE]Description:
The "Pressure Zones with MA " indicator is designed to analyze the pressure of buyers and sellers on the market, as well as to identify areas of increased activity. When designing it, the main task was to see manipulations on the market, when the power of sellers or the power of buyers is in a sideways trend or falling, and the opposite is growing.
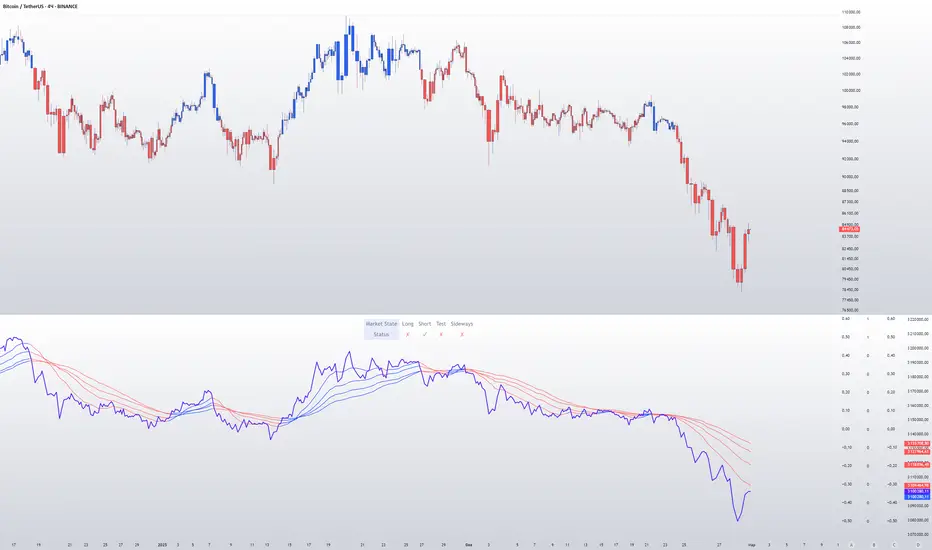
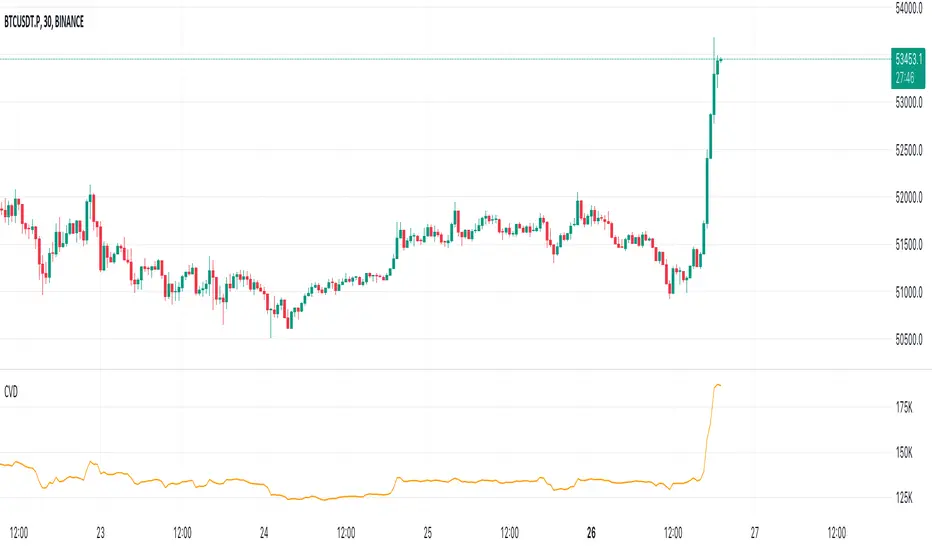
Here is a good example. The power of sellers is in a narrow sideways trend, and sales are increasing very aggressively. The power of buyers is in a gray block with the inscription "range". Then we see the fading of the power of sellers and buyers furiously pounce on the asset that has fallen in price.
Here are the main aspects of its operation and use:
First, turn off the moving averages in the indicator settings, on the "style" tab. Choose your favorite asset, which you understand well and know all its ups and downs. I want you to see a clean chart, so that you can be imbued with a new idea, you need to watch it. This is a proprietary indicator and I understand that it does not have the inscription “buy” / “sell”, but believe me, if you pay attention, you will see its strength. I usually add functionality later, but the light code and visualization remain preferable in the first version.
Purpose:
The indicator helps to determine the strength of buyers and sellers in the market.
It visualizes zones where the pressure of buyers or sellers prevails.
Additionally displays moving averages (MA) for data smoothing.
Main components:
Buyer strength chart (blue line)
Seller strength chart (red line)
Moving averages for buyer and seller strength
Threshold line for defining zones
Indicator settings:
Period: defines the base period for calculations (default 89)
Threshold: sets the level for defining pressure zones (from 0 to 2, default 0.8)
MA type for purchases and sales: select the type of moving average (SMA, EMA, RMA, WMA, VWMA, HMA)
MA length for purchases and sales: period for calculating moving averages
Colors for uptrends and downtrends of MA
Moving averages:
Help smooth out data and identify trends
The direction of the MA (up or down) further confirms the current trend
The color of the MA changes depending on the direction (blue for up, red for down)
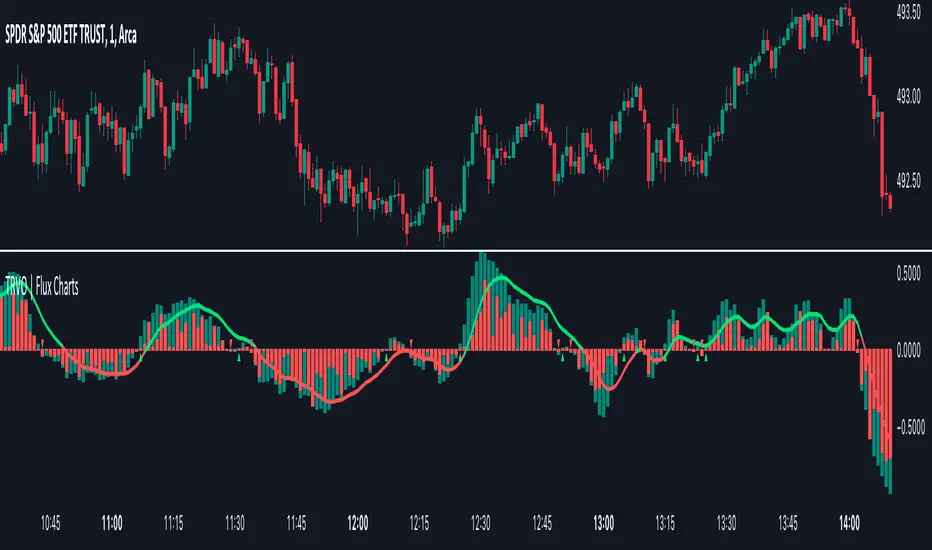
Now you can turn them on and see how they help in understanding where one or another force is weakening. It is in this case that we see the intersection of forces and the sellers' force is moving aggressively upward. Also, according to the moving average, we see the weakening of the sellers' force. The buyers' force was in the sideways range and then switched on to buy out and also according to the moving average, it is clear where the main interest in purchases disappeared.
Use:
Observe the strength of buyers and sellers relative to each other. They can move simultaneously in one direction, this is regarded as balance
can move in different directions and this will strengthen the upward force of sellers or buyers
You may also notice that the movement of one of the forces will be in a narrow range and the second will grow strongly - this is manipulation or trading without resistance.
You can also play with the threshold line, but it is not the main thing here. I disabled this function in the code.
// Display zones
//bgcolor(buy_zone ? color.new(color.blue, 90) : na)
//bgcolor(sell_zone ? color.new(color.red, 90) : na)
If you want to enable it, copy it instead
// Display zones
bgcolor(buy_zone ? color.new(color.blue, 90) : na)
bgcolor(sell_zone ? color.new(color.red, 90) : na)
Pay attention to the intersection of forces.
Use crossovers of force lines and their moving averages as potential signals
Combine the indicator signals with other technical analysis tools for confirmation
Limitations:
Requires customization of parameters for a specific trading instrument and timeframe
The indicator should not be used as the only tool for making trading decisions
Remember that this indicator provides additional information for market analysis, but is not a guarantee of successful trades. Always combine it with other analysis methods and follow risk management rules.
Описание:
Индикатор "Pressure Zones with MA " предназначен для анализа давления покупателей и продавцов на рынке, а также для определения зон повышенной активности. При его проектировании основная задача была увидеть манипуляции на рынке, когда сила продавцов или сила покупателей стоит в боковике или падает, а противоположная растет.
Вот хороший пример. Сила продавцов стоит в узком боковике, а продажи очень агрессивно усиливаются. Сила покупателей в сером блоке с надписью “range”. Потом мы видим затухание силы продавцов и покупателей яростно накидываются на подешевевший актив.
Вот основные аспекты его работы и использования:
Для начала отключите средние скользящие в настройках индикатора, на закладке “стиль”. Выберите свой любимый актив, в котором вы хорошо разбираетесь и знаете его все взлеты и падения. Я хочу чтобы вы увидели чистый график, для того чтобы вы могли проникнутся новой идеей нужно понаблюдать за ним. Это авторский индикатор и я понимаю что на нем нет надписи “купить” / “продать”, но поверьте уделив свое внимание вы увидите его силу. Я обычно потом добавляю функционал но легкий код и визуализация, в первом варианте остается предпочтительней.
Назначение:
Индикатор помогает определить силу покупателей и продавцов на рынке.
Он визуализирует зоны, где преобладает давление покупателей или продавцов.
Дополнительно отображает скользящие средние (MA) для сглаживания данных.
Основные компоненты:
График силы покупателей (синяя линия)
График силы продавцов (красная линия)
Скользящие средние для силы покупателей и продавцов
Пороговая линия для определения зон
Настройки индикатора:
Период (Period): определяет базовый период для расчетов (по умолчанию 89)
Порог (Threshold): устанавливает уровень для определения зон давления (от 0 до 2, по умолчанию 0.8)
Тип MA для покупок и продаж: выбор типа скользящей средней (SMA, EMA, RMA, WMA, VWMA, HMA)
Длина MA для покупок и продаж: период для расчета скользящих средних
Цвета для восходящего и нисходящего трендов MA
Скользящие средние:
Помогают сглаживать данные и выявлять тренды
Направление MA (вверх или вниз) дополнительно подтверждает текущий тренд
Цвет MA меняется в зависимости от направления (синий для восходящего, красный для нисходящего)
Теперь вы можете их включить и посмотреть как они помогают в понимании где ослабевает та или иная сила. Именно в этом случае мы видим пересечение сил и сила продавцов идет агрессивно вверх. Также по средней скользящей мы видим затухание силы продавцов. Сила покупателей стояла в боковике потом включилась на откуп и также по средней скользящей видно где пропал основной интерес к покупкам.
Использование:
Наблюдайте за силой покупателей и продавцов относительно друг друга. Они могут двигаться одновременно в одном направлении это расценивается как баланс
могут двигаться в разных направлениях и это будет усиливать восходящую силу продавцов или покупателей
также возможно вы заметите что движение одной из силы будет в узком диапазоне а вторая будет сильно расти - это манипуляция или торговля без сопротивления.
Также можете поиграть с пороговой линией, но она совершенно не главная здесь. В коде я отключил эту функцию.
// Display zones
//bgcolor(buy_zone ? color.new(color.blue, 90) : na)
//bgcolor(sell_zone ? color.new(color.red, 90) : na)
Если захотите включить скопируйте вместо нее
// Display zones
bgcolor(buy_zone ? color.new(color.blue, 90) : na)
bgcolor(sell_zone ? color.new(color.red, 90) : na)
Обращайте внимание на пересечение сил.
Используйте пересечения линий силы и их скользящих средних как потенциальные сигналы
Комбинируйте сигналы индикатора с другими инструментами технического анализа для подтверждения
Ограничения:
Требуется настройка параметров под конкретный торговый инструмент и таймфрейм
Не следует использовать индикатор как единственный инструмент для принятия торговых решений
Помните, что этот индикатор предоставляет дополнительную информацию для анализа рынка, но не является гарантией успешных сделок. Всегда сочетайте его с другими методами анализа и соблюдайте правила управления рисками.
Pine Script® göstergesi