Haos Visual Divergence + Volume Analysis█ OVERVIEW
The Haos Visual Oscillators is a trend indicator that combines two William % indicators with different periods , to show Over Sold and Over Bought signals.
I have added Divergences and a volume indicator to check if buying or selling pressure is exhausted or showing divergences
this can help spot trend reversals
code taken from:
www.prorealcode.com
█ DESCRIPTION
Divergences:
• checks up to 20 pivot points to look for Divergences
• Divergences require single candle confirmation
• Divergences are only confirmed if oscillator pivot is of close proximity of a price pivot
Volume Indicator:
• checks for volume divergences or exhaustion
This is done by comparing relative change in price to the relative change in volume when oscillator is at over bought or over sold levels
indicator Columns:
• Yellow => divergence has been spotted
• Dim Yellow => divergence was spotted on the previous candle
• Blue => volume exhaustion was spotted
• Dim Blue => volume exhaustion was spotted on the previous candle
• Green => OverSold
• Red => OverBought
OB/OS:
• OverBough t => above 30
• OverSold => below -30
Alerts:
• Regular Bullish Divs
• Hidden Bullish Divs
• Regular Bearish Divs
• Hidden Bearish Divs
- if you realized that I posted 2 versions of the indicator :
• its because I named the first version wrongly on the publishing name and cant change it
Hacim Göstergesi

Haus Visual Divergence + Volume Analysis█ OVERVIEW
The Haos Visual Oscillators is a trend indicator that combines two William % indicators with different periods , to show Over Sold and Over Bought signals.
I have added Divergences and a volume indicator to check if buying or selling pressure is exhausted or showing divergences
this can help spot trend reversals
code taken from:
www.prorealcode.com
█ DESCRIPTION
Divergences:
• checks up to 20 pivot points to look for Divergences
• Divergences require single candle confirmation
• Divergences are only confirmed if oscillator pivot is of close proximity of a price pivot
Volume Indicator:
• checks for volume divergences or exhaustion
This is done by comparing relative change in price to the relative change in volume when oscillator is at over bought or over sold levels
indicator Columns:
• Yellow => divergence has been spotted
• Dim Yellow => divergence was spotted on the previous candle
• Blue => volume exhaustion was spotted
• Dim Blue => volume exhaustion was spotted on the previous candle
• Green => OverSold
• Red => OverBought
OB/OS:
• OverBought => above 30
• OverSold => below -30
Alerts:
• Regular Bullish Divs
• Hidden Bullish Divs
• Regular Bearish Divs
• Hidden Bearish Divs

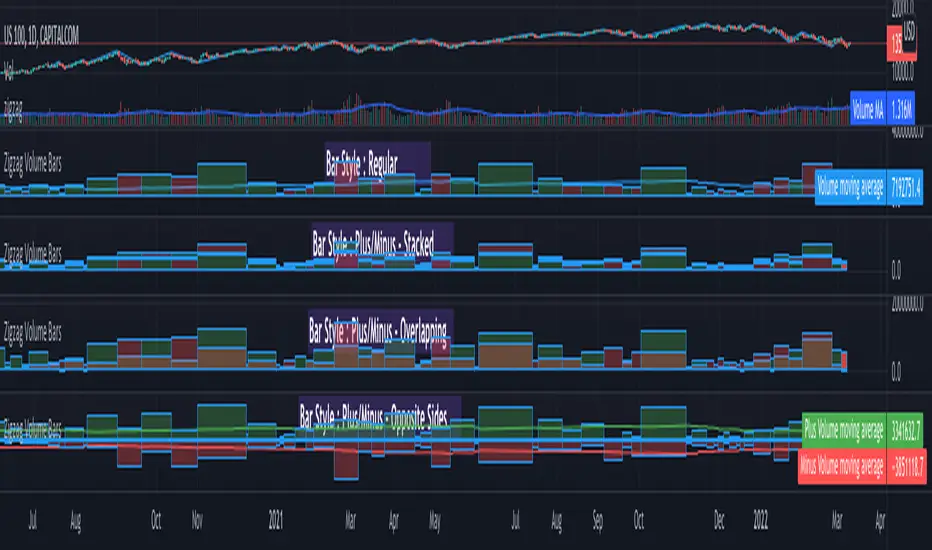
Zigzag Volume BarsBack to my favourite topic - Zigzags.
Here is an indicator which can help you visualise volume data on Zigzag swing highs and lows.
Settings are pretty simple and provides variety of display options
Display options are as demonstrated in the chart has following main types.
Regular
Plus/Minus - Stacked
Plus/Minus - Overlapping
Plus/Minus - Opposite Sides
Apart from the main display types, stacked display has several sub-types which determine whether to place green bar below red or the other way around.
Snapshot below shows example of each type.
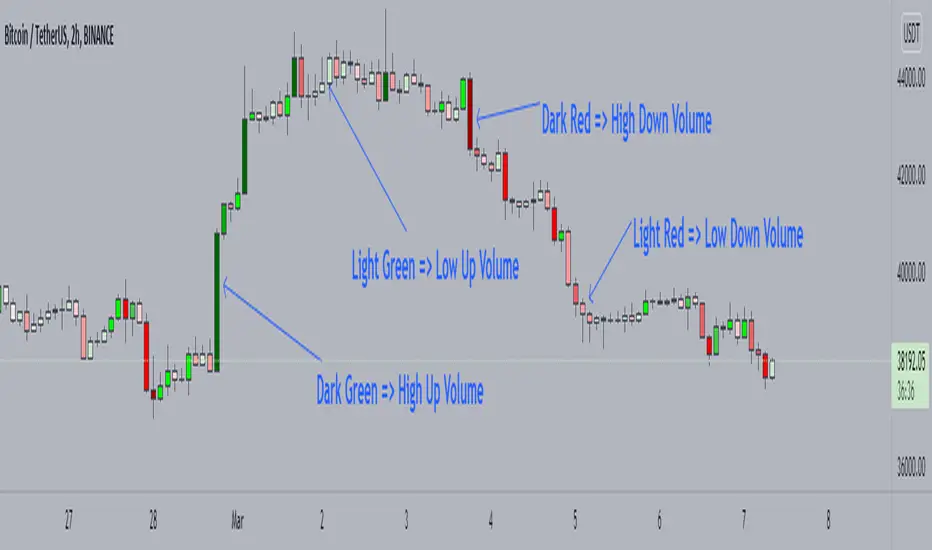
Candle Color by VolumeA simple but effective indicator that paints candles with different shades of colors based on the volume transacted.
-> Supports 6 levels of sensitivity at present. Might enhance the granularity later.
-> Darkest indicates the most volume transacted. Lightest, the least. Change it around however you see fit and based on your theme.
-> Use it for your Volume Spread Analysis and/or in conjunction with any other strategies that you employ.
-> Note that the volume ratio is calculated relative to the average volume of the last n candles ( EMA 20 by default).
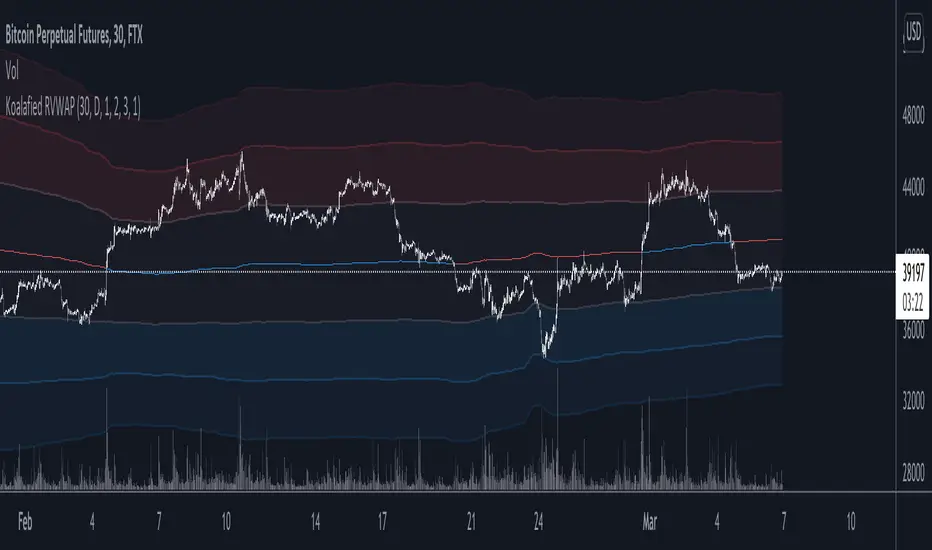
Koalafied RVWAPThis indicator shows both the Rolling VWAP and Standard Deviations as set by the user. The Rolling VWAP calculation is similar to the standard VWAP although it calculates the volume weighted average price over the specified period of time (lookback), resetting for each subsequent bar.
The unique aspect of this indicator is that instead of calculating the RVWAP over the current timeframes lookback period, the option is available to select a High-Time-Frame setting instead.
This has two different methods of calculation
1 - Based on HTF security requests (both repainting and non-repainting)
2 - Automatic calculation of number of current timeframe bars that make up the HTF lookback period (smoother and non-repainting plot)
Additionally a smooth function is included for the HTF input setting.
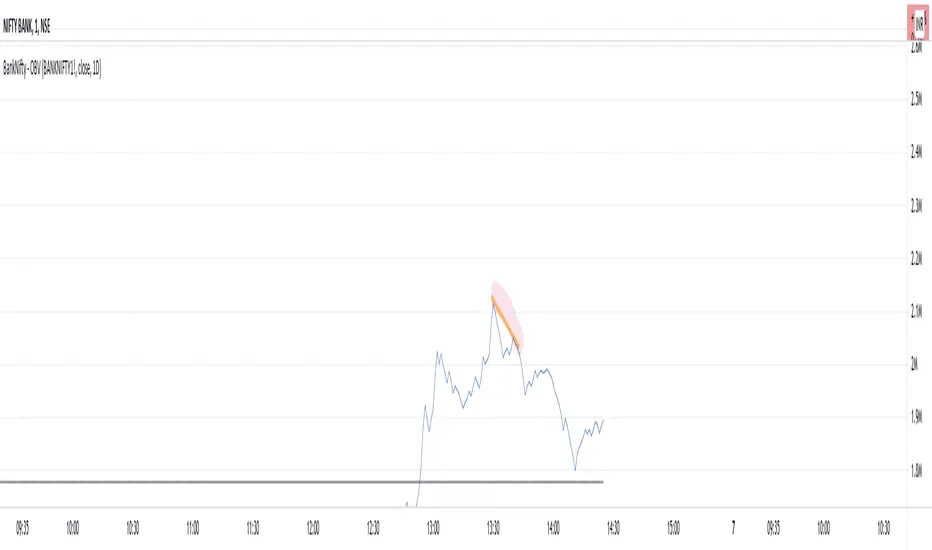
BankNifty - OBVThis script tries to draw OBV for BankNifty using Futures Volume along with Average OBV. For Nifty50 just change the Futures Volume symbol in settings. Look at devations in Price vs OBV or Average OBV breakout.
NSE:NIFTY
NSE:BANKNIFTY
Customizable Volume DetailsThis script allows you to gain insight into volume such as differentiating between buy and sell volume, 30 day average, 30 bar average, and more.

Volume Surge indicatorThis indicator highlight candles when Volume surge "X" times in compare of last "n" candle.
It helps you to find moments of market which Volatility and Position volumes raise significantly.
In other words, It shows footstep of "Big Banks" or "Whales" or other Giants ;)
- default value highlight candles when Volume is 2 time more than average of last 30 candle. But you can modify both values in your favor.
* You can set Alarm for notifying in advance when Volume surge happened on any chart.
I hope you guys find it helpful and handy

Heatmap WatchlistThis is a Heatmap for custom watchlist tickers. Similar to S&P500 Heatmap .
Add up to 20 tickers.
Check higher timeframe from a lower timeframe.
Check previous candle for any timeframe.
Switch on/off "Price%" and/or "Volume%" heatmap.

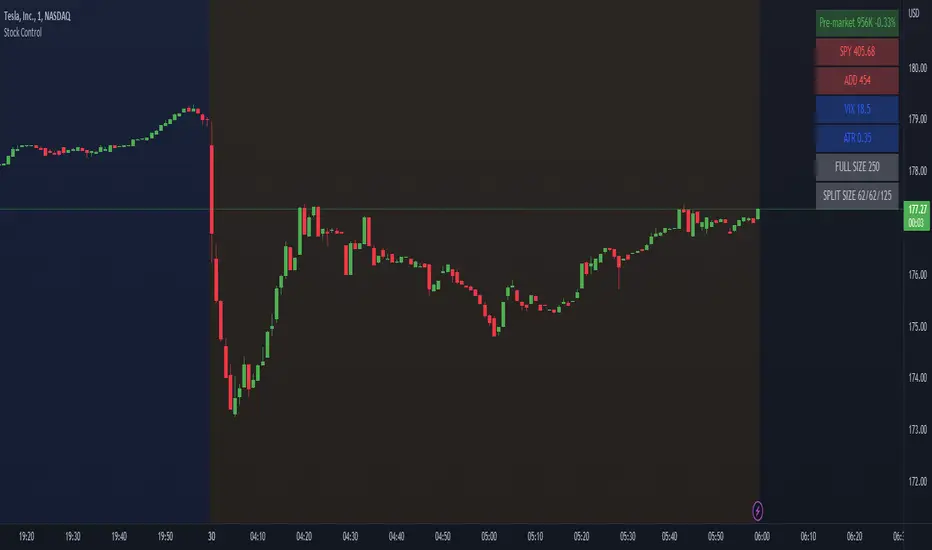
Stock ControlThis indicator shows the following values:
Pre-market volume
SPY
ADD
VIX
For each value the background will be colored based on specific internal parameters which can be customized.
The indicator is highly customizable. Here are some of the settings:
Compact view
Text size
Pre-market thresholds
SPY MACD parameters
ADD MACD parameters
VIX Bollinger parameters
[DisDev] Market Maker - High Volume RecoveryThis indicator has many components; below, each component is explained and how it can be used as a trading tool.
The indicator analyzes past volume movements, allowing you to visualize selected volume percentages above and below candles and to visualize live recovery of High-Volume Candles.
1) The High-Volume Candles project to the current time to show how much of the High-Volume Candle has been recovered and how much remains unrecovered.
a. The indicator can be customized to a user-defined volume percentage; this allows you to focus on candles with volume over a given percentage (e.g., 500%.)
b. You can customize the candle colors and volume percentage thresholds.
2) You can select the option to display percentages above the candles, allowing you to research and back-test theories.
a. For example, the chart below shows High-Volume Candles above 500%. Throughout 2021, 92% of the 500%-plus candles have been recovered, leaving only four high volume zones yet to be recovered, one below and three above the current price.
For a further breakdown of the statistics click on the below chart image.
3) There is also the option to show the volume percentage within the unrecovered High-Volume Zone.
a. This allows you to instantly assess how strong the price movement was of that particular High-Volume Zone.
4) Lookback periods can also be adjusted to fine-tune the indicator.
Below is the indicator in full operation.
DISCLAIMER
When pressing the play button in the chart above it does not display the recovery. A TV "HOW TO" idea will be published soon, to demonstrate the indicator in full action or for more info please read "Author's instructions".

Koalafied EdgesIndicator based on user selected periods 'edges' (highs/lows). Includes One-Time-Framing and sweeps of levels.
User selection of previous Session/Day/Week highs and lows. These will plot over the relevant period once it has completed. Intra-day there are three periods that can be plotted.
For now these are most relevant to crypto. It can be useful to think of previous levels being locations that are likely to contain liquidity that the market might sweep in the future,
as much like pivot points, traders stop orders can be found there. Session breaks are included to allow for clear delineation between user selected periods. Additionally the option
to colour the background of a specific period is given to the user, this can be useful as an aid for visual analysis of session behaviour over time.
Untapped Levels
Previous Levels (Highs/Lows) that price has not re-tested will remain on the chart. These are typically the levels that are swept for liquidity in future periods.
Sweeps
Sweeps are formed when a candle opens above/below a previous periods level, crosses it and closes back on the side of the open. Often can mark important
pivots in the market and potential reversals. Useful if you think of stop liquidity resting outside previous periods highs/lows. Market 'sweeps' the level,
taking liquidity and reverses. Alerts for these are included.
One-Time-Framing
Indicator shows One-Time-Framing (OTF) for user selection of Candle, Session, Day, and Weekly timeframes. The background between the periods highs and lows (or candle colour)
will display the OTF state. This is a Market Profile concept that isn't typically found in Tradingview Scripts.
OTF is a sequence of days or time period where you don’t get a break of the previous candles low (OTF Up) or high (OTF Down). Typically shows a market
that is trending in one direction. If it's an outside day then no OTF status, if it's an inside day then the previous period high or low hasn't been
breached so OTF status stays same.
Candle colouring. I've included the option to switch between OTF coloured candles or my Volume Extension candles. I find the Volume Extension Candles invaluable
in showing areas of high market participation and can be quite informative at significant levels often showing exhaustion at support/resistance or market strength on breakouts.
Candles not supported by rising volume are coloured black while those that are retain their colouring.
Important to note that this indicator plots prior levels only when the selected period has ended. So at the start of a new period, the high/low of the previous
period will be plotted, with untapped lines extended into the future. The indicator is designed to show you what 'has' happened and to provide areas
of interest where you may wish to initiate trades. The sweep signals are the only real-time plots.

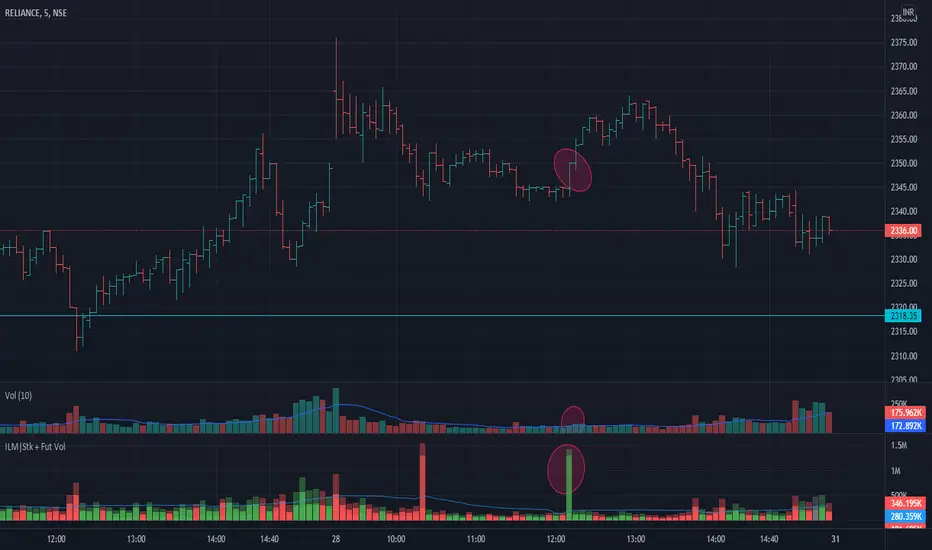
Volume Indicator NSE + BSE + Future Current & Next MonthThis indicator combines all the volumes from both the NSE & BSE exchanges as well as Future volumes ( Current Month & Next Month) if the symbol is available in FnO
Indicator shows 3 volumes
Total Volume = NSE + BSE + Current Month + Next Month
Stock Volume = NSE + BSE
Future volume = Current Month + Next Month
Benefits
As shown in the chart above, price shot up as the volume appeared in BSE but not NSE. These conditions can be caught easily and right decisions can be made
Since Future volumes are also combined, it gives an accurate picture of volumes on any given instrument during last of week of monthly expiries when contract rollovers happen
Price weighted volumeSimple script that displays volume relative to current price to mitigate the seemingly declining volume over time as prices increase.
Goethe B - Mutiple Leading Indicator PackageGoethe B is an Indicator Package that contains multiple leading and lagging indicators.
The background is that shows the local trend is calculated by either two Moving Averages or by a Kumo Cloud. By default the Kumo Cloud calculation is used.
What is the main oscillator?
- The main oscillator is TSV, or time segmented volume. It is one of the more interesting leading indicators.
What is the top bar?
-The top bar shows a trend confirmation based on the wolfpack ID indicator.
What are those circles on the second top bar?
-Those are Divergences of an internally calculated PVT oscillator. Red for Regular-Bearish, Green for Regular-Bullish.
What are those circles on the main oscillator?
-These are Divergences. Red for Regular-Bearish. Orange for Hidden-Bearish. Green for Regular-Bullish. Aqua for Hidden-Bullish.
What are those circles on the second lower bar?
-Those are Divergences of an internally calculated CCI indicator. Red for Regular-Bearish, Green for Regular-Bullish.
What is the lower bar?
-The lower bar shows a trend confirmation based on the Acceleration Oscillator, in best case it showes how far in the trend the current price action is.
What are those orange or aqua squares?
- These are TSI (true strength indicator) entry signals . They are calculated by the TSI entry signal, the TSI oscillator threshold.
Most settings of the indicator package can be modified to your liking and based on your chosen strategy might have to be modified. Please keep in mind that this indicator is a tool and not a strategy, do not blindly trade signals, do your own research first! Use this indicator in conjunction with other indicators to get multiple confirmations.

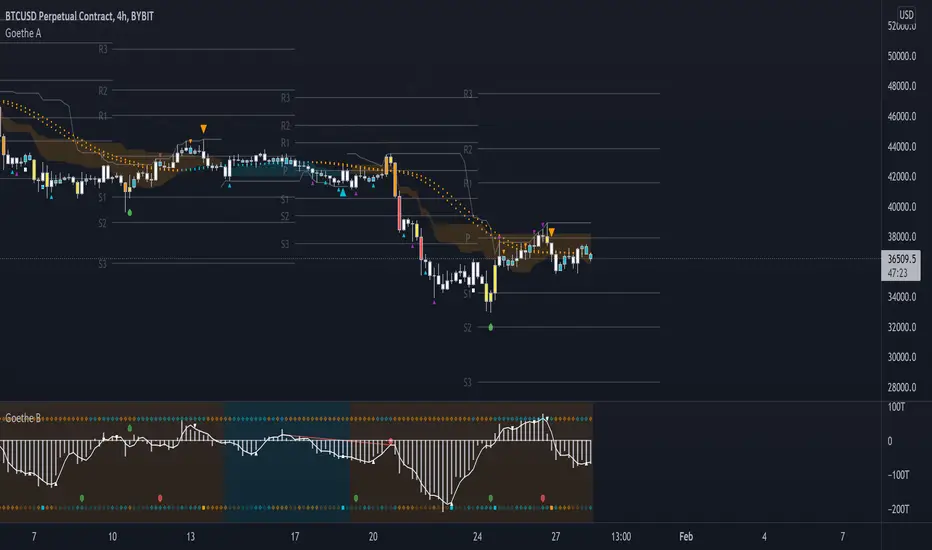
Goethe A - Multiple Leading Indicator PackageGoethe A is an Indicator Package that contains multiple leading and lagging indicators.
The background is that shows the local trend is calculated by either two Moving Averages or by a Kumo Cloud. By default the Kumo Cloud calculation is used.
What are those circles?
-These are OBV (or VPT, can be set in the options) Divergences. Red for Regular-Bearish. Orange for Hidden-Bearish. Green for Regular-Bullish. Aqua for Hidden-Bullish.
What this middle line?
-The middle line is calculated by a smoothed Heikin-Ashi indicator. I can be used as a dynamic zone of support and resistance. Many times this indicator is used as entry signal giver in trend following strategies.
What are those background lines?
-The background contains a simple Daily Pivots indicator. This indicator can be read as zones of Support and Resistance that updated based on the used timeframe.
What is this smaller thin grey line?
-This is a very simple Stoploss indicator based on Donchian Channels. The trade direction is based and calculated by the local trend (background color)
What are those small orange or aqua triangles?
- These are Pivots . They show when the OBV or wolfpack oscillators (or a double confirmation of both) might reverse, this is important to know because many times the price action follows this move.
What are those purple triangles?
- These are Pivots . They show when the PVT oscillator might reverse, this is important to know because many times the price action follows this move.
What are those big orange or aqua triangles?
- These are TSI (true strength indicator) entry signals . They are calculated by the TSI entry signal, the TSI oscillator treshold and in conjunction with the overall local trend (background color).
What are those white squares?
- These are Overbought or Oversold regions of the build-in RSI bands indicator. Every time the price crosses one of the RSI bands those squares are printed. Most of the time this happens after a move and indicates that this strong move has come to an end.
Most settings of the indicator package can be modified to your liking and based on your chosen strategy might have to be modified. Please keep in mind that this indicator is a tool and not a strategy, do not blindly trade signals, do your own research first! Use this indicator in conjunction with other indicators to get multiple confirmations.
Weekly Volume HeatmapThis tool is designed to visualize how the trading volume of each asset changes during the week.
How to use
This tool can help us better understand the market and answer many questions, such as:
◽ How to avoid getting stop hunted?
Typically, trading volume decreases at certain times of the week, which is the best time for large holders to manipulate the market. Low volume means there is less liquidity in the market. Large transactions in an illiquid market can cause large price changes.
Large holders (whales) have enough capital to push the price in the desired direction to trigger a cascade of stop-loss orders which can move the price further.
After a stop hunt, the market typically reverses, leaving stop hunted traders behind.
It is best to avoid using stop-loss orders and leveraged trading during these hours of the week.
◽ When’s the best time to make decisions
During some hours of the week the trading volume usually decreases; at these times, most traders are inactive and do not participate in transactions.
Therefore, the price changes that occur during these times lack conviction.
It is better to make decisions when there are more active traders in the market. At these periods, a relatively high trading volume is usually observed.
How it works
First, it calculates the average traded volume of each period (for example Monday 9:00 AM) from the first bar to the last bar. It then calculates the ratio of the average traded volume in each period to the average traded volume per week. Finally, the result is displayed as a percentage in each cell.
Different values are distinguished by different background colors. Light colors are used for low values and dark colors are used for high values.
Limits
It only works in the 1 hour time frame.
Samples
Stock => AAPL
Futures => ES1!
Forex => EURUSD

WhaleCrew VolumeThis indicator aims to provide a deeper insight into market events by using volume data.
Features
Aggregating volume data across multiple exchanges (only for built-in crypto pairs, e.g. BTC and ETH)
Detection of volume spikes (customizable size)
Alerts for volume spikes (breakouts/mass liquidation events)
Configurable moving average type
Custom moving average multiplier
Usage
The composition of the aggregated volume data can be visualized to show the respective volume of each exchange.
Identify which exchanges (and their traders) fueled price movement. Was their share in the total aggregated volume higher/lower than previously?
Pay attention to exchanges that are notorious for a lot of beginner/retail traders to make more informed decisions.
The volume spike detection is ideal for getting alerted whenever a breakout (in price action and/or volume) or mass liquidation takes place.
(Spikes are detected relative to the set moving average.)
Access to this indicator can be obtained through our website.

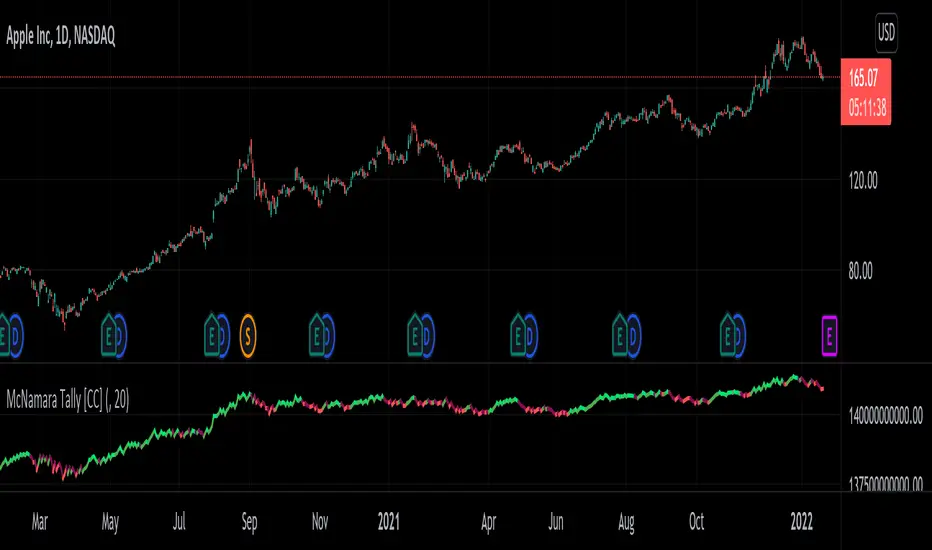
McNamara Tally [CC]The McNamara's Tally was created by Nolan McNamara (Stocks and Commodities Feb 2022 pgs 44-45) and this aims to fix the issues with both the On Balance Volume and the Accumulation/Distribution Line by using a variation of Wilder's True Range to keep track of volume flow to better differentiate between bullish volume and bearish volume. I added a signal line to this indicator to provide clear buy and sell signals since the original didn't' have any so feel free to experiment and see if you come up with a better signal system. Buy when the indicator line turns green and sell when it turns red. I have included strong buy and sell signals in addition to normal ones so stronger signals are darker in color and normal signals are lighter in color.
Let me know if there are any other indicators or scripts you would like to see me publish!
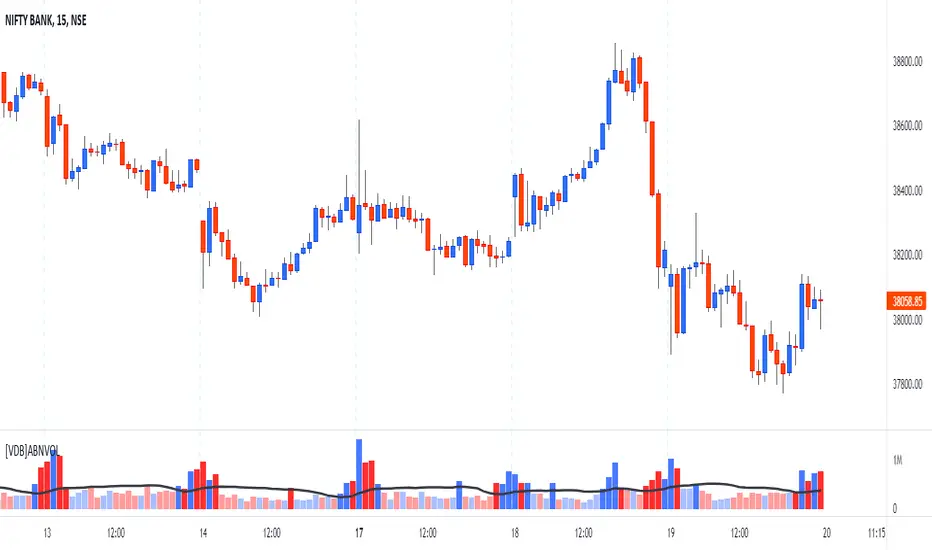
[VDB]Advanced BankNifty VolumeNSE:BANKNIFTY Index is traded significantly along with NIFTY and having a VOLUME indicator is very helpful for those who follow it extensively as it is used to measure the relative significance of a price move. Given TradingView doesn’t provide the VOLUME on Index chart, many end up using BANKNIFTY FUTURE chart for volume information. This indicator helps providing that VOLUME information.
Get VOLUME You Prefer –
FUTURE : This extracts VOLUME data from BANKNIFTY FUTURE chart.
INDEX : VOLUME is calculated by the weighted sum (Composite method) of underlying stock’s spot volume for all the 12 stocks of the Bank Nifty Index.
INPUTS :
Volume Moving Average in added to show the LINE and also used in calculation to change volume bars color if that input is selected.
Color Bars Based on Average VOLUME : Selecting this helps changing the Color of VOLUME bars to lighter color if volume < average volume.
Color Bars Based on Previous Close : Selecting this input changes the Color of VOLUME bars based on “Previous Close” than “Current Open”.
BANKS & WEIGHTAGE : Here all 12 underlying banking stocks of Bank Nifty Index are listed along with their weightage in the index.
IMPORTANT NOTE : Changing any settings of the indicator leads to its complete recalculation. The result may differ from the expected one. Weightage of each stock changes by end of every month. Always to refer NSE NIFTY BANK composition and weightage from NSE website.
DISCLAIMER : This indicator has been created for educational reference only and do not constitute investment advice. This indicator should not be relied upon as a substitute for extensive independent market research before making your actual trading decisions. Market data or any other content is subject to change at any time without notice. Liability for any loss or damage, including without limitation any loss of profit, which may arise directly or indirectly from use of this indicator is accountability of user.
Range Volume ChangeI was looking for a way to see if today's premarket volume is higher or lower than the previous day's premarket, but did not find any, hence, I made my own which I share with you now.
I call it 'Range Volume Change' or just RVC.
RVC will show the percentage of change between the selected time range and the previous day for the same time range.
This will allow us to see if the volume is increasing or decreasing today compared to the previous day by a specific time range that we set in PVC settings. It can do more than just premarket, you can use it for any time range of your interest which will work on 24hours assets like crypto and forex.
RVC visualizes the incremental of the volume using increasing size columns giving you a better view of how the volume changes compared to the past. The column shows the accumulated volume from when the time range started.
As an extra feature, it will also show the volume percentage of change outside the time range (can be disabled from settings).
In addition, RVC is also designed to work on real-time data.
Example of BTCUSDT (24-hour asset) with volume 'outside the time range', enabled (purple columns):
Follow for more awesome indicators/strategies: www.tradingview.com

RSI true swingsRelative Strength Index (RSI) is being used by majority of the traders to get benefitted based on the swings. But these swings are hard to Identify.
This Indicator uses 4 major factors for finding the potential reversal points:
RSI Crossover or crossunder
Relative volume
Overall volume against the moving average volume
Relative closing of the candles
Size of the bars
Please read Instructions carefully before using this indicator
Recommended entry is the OHLC4 of the signal bars.
If signal bar is too large, try to enter in the retracement when another signal comes either through indicator or through types of bars
when signals comes opposite to the trend, then try to wait for the next signal of same type. This creates a RSI-price divergence in confirmation by volume price action
Timeframe can be of your choice
Recommended stoploss should be swing highs or lows

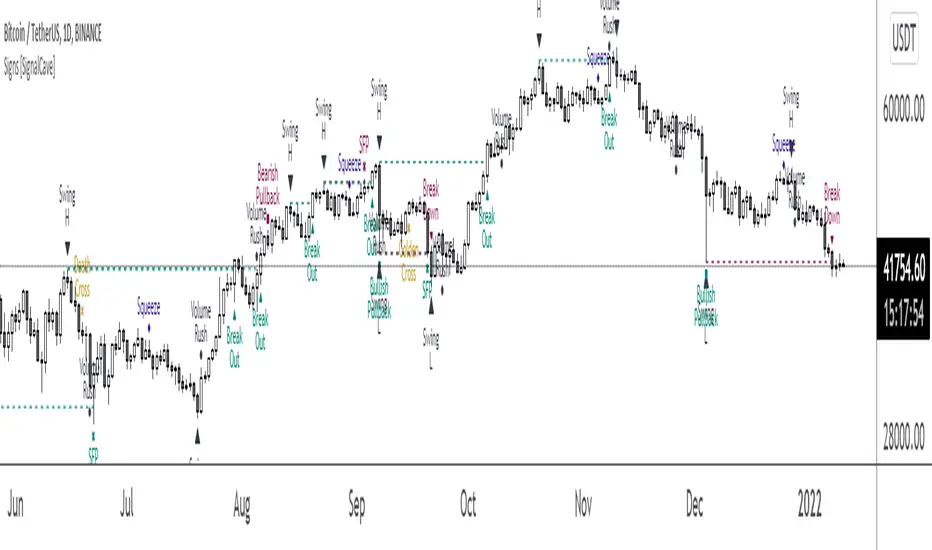
Signs [SignalCave]Swings, Engulfs, Golden & Death Crosses, Price Squeezes, Pullbacks, Breakout & Breakdowns, Volume Rushes
A swing low is when price makes a low and is immediately followed by consecutive higher lows. Likewise, a swing high is when price makes a high and is followed by consecutive lower highs.
Swing Failure Pattern (SFP) is a type of reversal pattern that can be used as buy or sell signals.
Engulfing candles tend to signal a reversal of the current trend in the market. This specific pattern involves two candles with the latter candle 'engulfing' the entire body of the candle before it.
On this indicator, bullish engulfs visible only on downtrend and oversold conditions. Bearish engulfs visible only on uptrend and overbought conditions.
The death cross and golden cross are technical analysis terms for when a moving average (MA) intersects with another from either above or below.
The cross, depending on which it is, can signal the start of a new trend or the end of one.
Squeeze signs signifies low volatility, market preparing itself for an explosive move up or down direction.
Bullish Pullbacks are widely seen as buying opportunities after an asset has experienced a large upward price movement. Most pullbacks involve an asset's price moving to an area of technical support , such as a moving average, before resuming their uptrend.
Bearish Pullbacks are widely seen as selling opportunities after an asset has experienced a large downward price movement. Most pullbacks involve an asset's price moving to an area of technical resistance , such as a moving average, before resuming their downtrend.
A breakout refers to when the price of an asset moves above a resistance area, breakdown refers to when the price of an asset moves below a support area.
Breakouts/breakdowns indicate the potential for the price to start trending in the breakout direction.
For example, a breakout to the upside from a chart pattern could indicate the price will start trending higher.
Volume rush signs appears when the trading volume increases more then a usual period. It can be useful with combining breakout signals as a confirmation.
Alerts are available for various conditions such as "Bullish/Bearish SFP, New Swing High/Low, Breakout/Breakdown, Bullish/Bearish Engulf, Golden & Death Cross, Bullish/Bearish Pullbacks, Squeeze, Volume Rush"
Type asset name on symbol search area.
Adjust your timeframe that you wish to track.
Click "Create Alert" .
Select one of the condition that you wish to get inform from create alert panel.
Select "Once Per Bar Close" option.
Click "Create" .