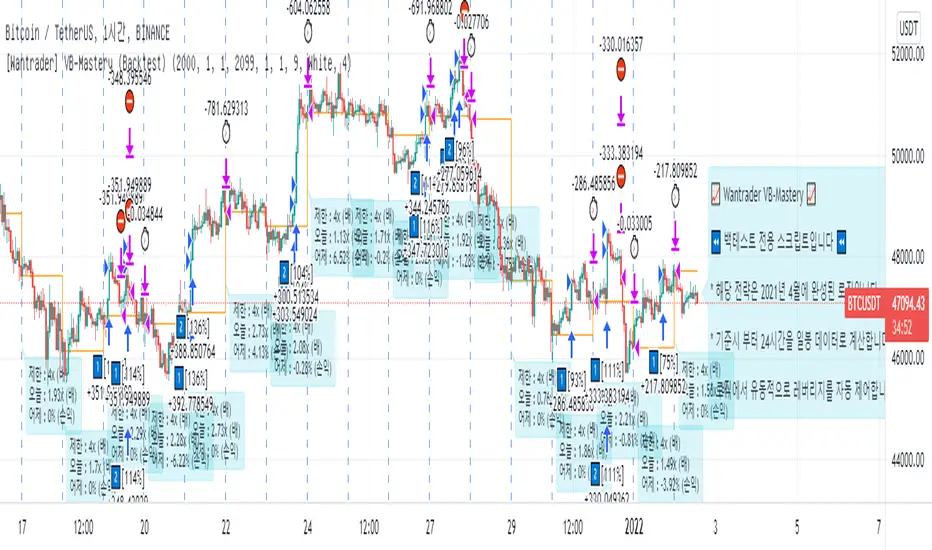
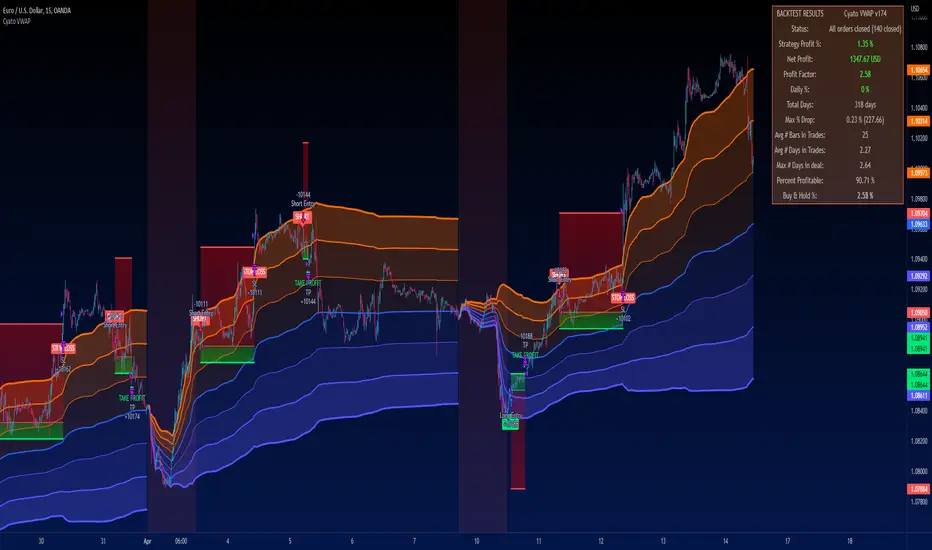
[Wantrader] Volatility Breakout Strategy - Mastery (Backtest)This is the Wantrader's volatility breakthrough version 9,
which developed Larry Williams' volatility breakthrough strategy.
It has been 4 months of development and 8 months of practice.
It's the best strategy for and .
Please choose 1H time frame.
If the date is the future than today, only show you until yesterday.
No repaint.
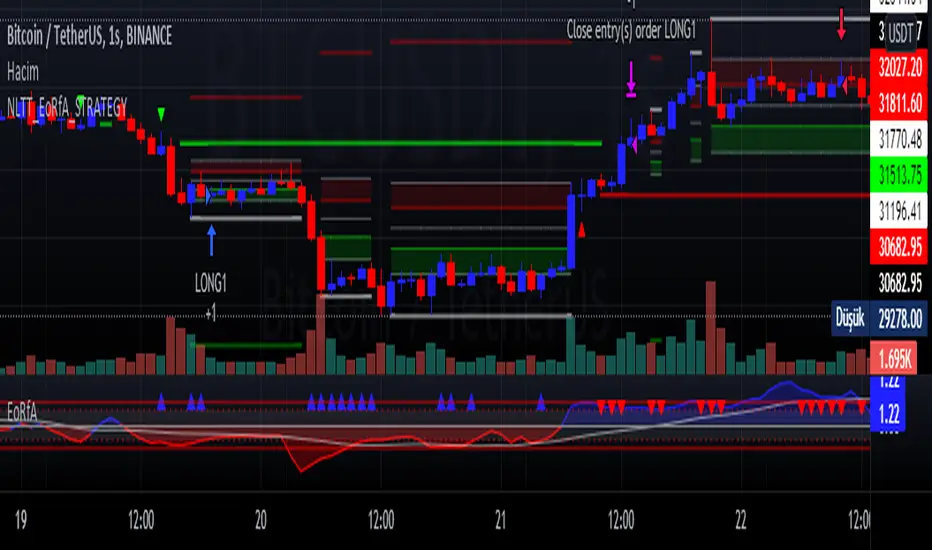
"As a long-only day trend strategy, we pursue profits in the downward / transverse / rising market."
- It will be exited based on the closing price of the day as a strategy to take only the day trend.
- It's a long-only strategy without short trade.
- It has high market adaptability in response to market volatility.
- We have minimized over-optimization factors so that they can work well in the future.
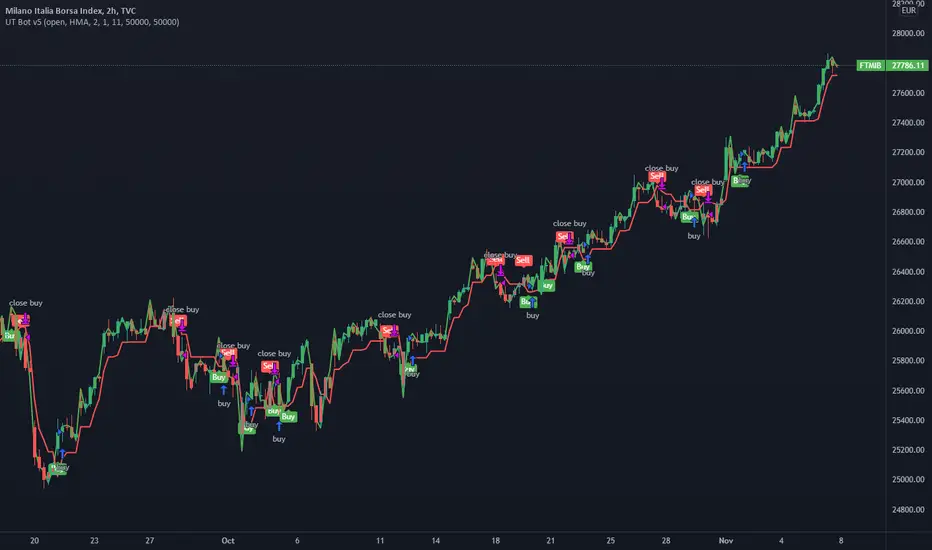
"The efficiency has been increased by delicate control of entry volume."
- Control losses by managing funds in line with market changes.
- Calculate the leverage on the day automatically.
- It goes in more when it's advantageous and less when it's disadvantageous
- It's a welfare strategy that works against assets
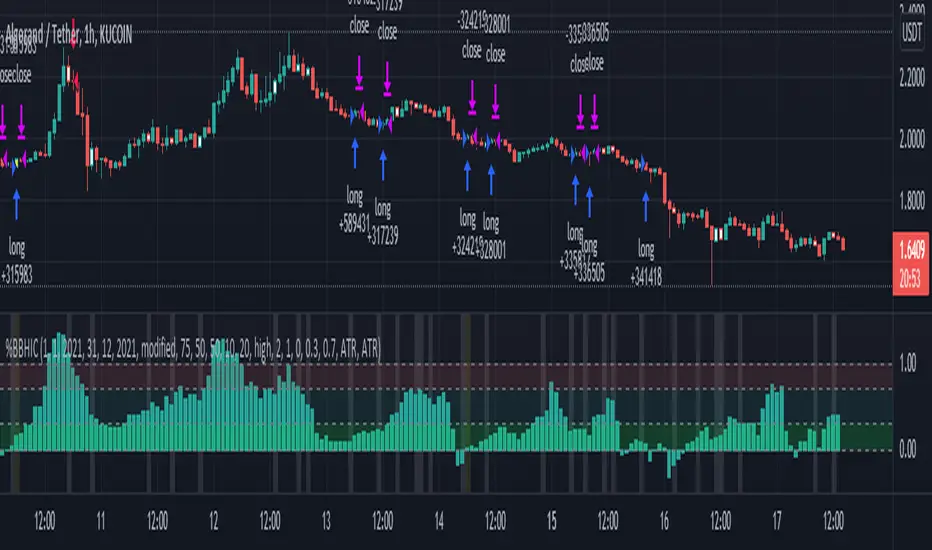
"We further lowered the risk by cutting off and buying in installments."
- If you judge that the trend has declined on the day, you will break off and respond to a sharp drop.
- It was purchased in installments twice, increasing the confidence of entry
========================================================================================
래리윌리엄스의 변동성돌파전략을 발전시킨
원트레이더 변동성돌파 버전9 입니다.
2021년 1월부터 4개월 동안 개발하여
2021년 4월 부터 '8개월 간의 실전테스트 기간을 가졌습니다.'
비트코인, 이더리움 에 가장 잘 맞는 전략이며
1H 타임프레임으로 선택해주세요
백테스트 버전은 전일까지만 확인 가능합니다. (당일 진입 확인 불가)
리페인트는 발생하지 않습니다.
롱 온리 당일 추세 전략으로 하락/횡보/상승 장에서 수익을 추구합니다.
- 당일 추세만 취하는 전략으로 일봉 종가 기준 청산됩니다.
- 숏은 없는 롱 온리 전략입니다.
- 시장 변동성에 따라 대응하여 시장 적응력이 높습니다.
- 과최적화 요소를 최소화 하여 미래에도 잘 작동 할 수 있도록 만들었습니다.
섬세한 진입 물량 제어로 효율을 높였습니다.
- 시장 변화에 맞춰 자금관리를 하여 손실을 제어합니다.
- 당일 레버리지를 매일 자동으로 계산합니다.
- 유리할때 더 들어가고, 불리할때 적게 들어갑니다.
- 자산대비로 작동하는 복리 전략입니다.
손절과 분할매수로 리스크를 더욱 낮췄습니다.
- 당일 추세가 꺾였다고 판단하면 손절하여, 급락에 대응합니다.
- 2회에 걸쳐서 분할매수 하여, 진입 확신도를 높였습니다.
Pine Script® stratejisi