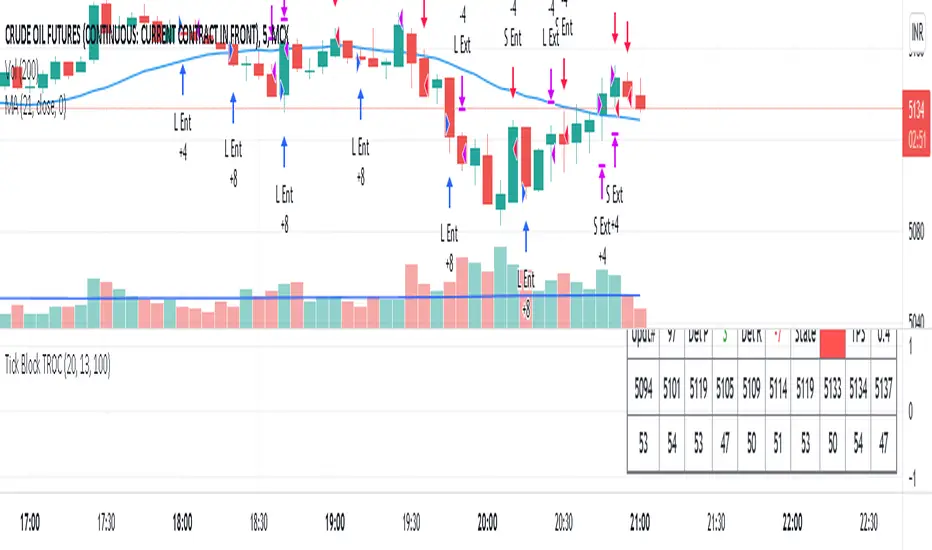
Up Down RatioWORKS ONLY IN LIVE MARKET. NO BACK TESTING POSSIBLE.
A Tick block is defined as a set of last 'n' ticks. 'n' is user specified and default is 100.
Script calculates the ratio of upticks to downticks in every tick block. This is called UDR (up down ratio)
It also calculates the lowest price in the tick block.
The price lows (in each block) are matched with UDR and looks for convergence or divergence.
Script generates entry and exit signals based on convergence/ divergence.
Profit and loss can be user defined.
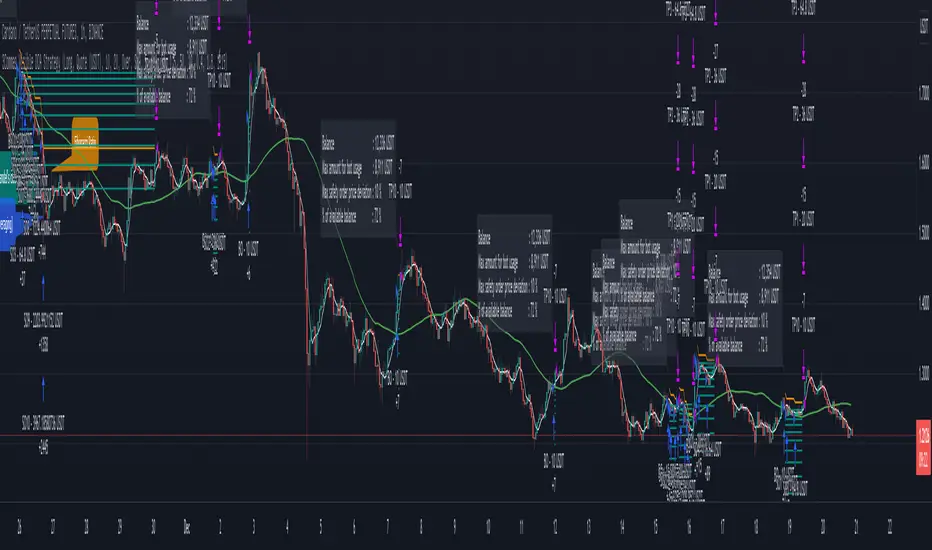
Default settings work for CRUDE OIL (Indian Rupee)
Convergence is Bullish
Divergence is Bearish.
Ticks per second for the last tick block is displayed as TPS.
TPS may be used to gauge activity level and co-relates largely with volume acceleration.
Pine Script® stratejisi