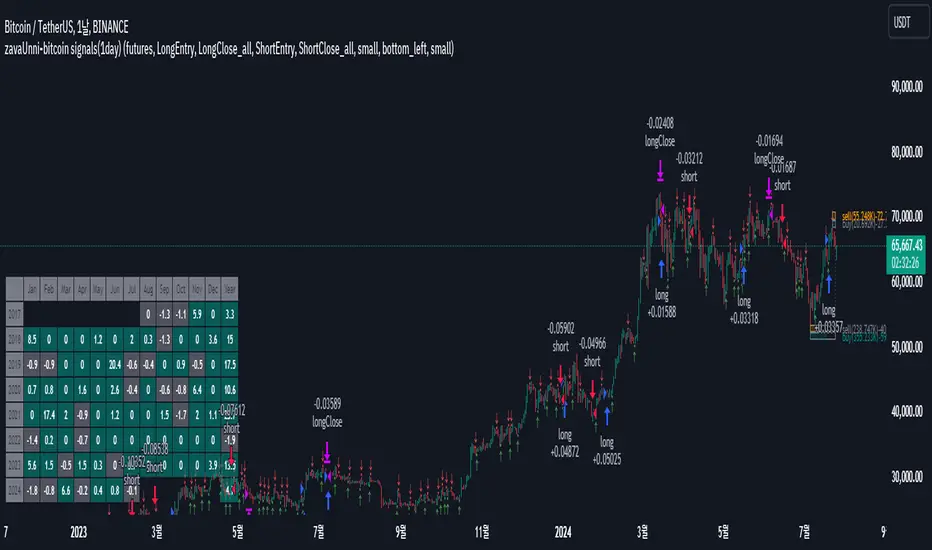
zavaUnni-bitcoin signals(1day)
📌 This strategy predicts price movements based on trading volume and enters positions accordingly. It calculates the expected price increase based on bullish volume and the expected price decrease based on bearish volume to determine the direction of the position.
Top predicted price based on declining bullish volume: top_ifpricebull
Bottom predicted price based on declining bearish volume: top_ifpricebear
Top predicted price based on increasing bullish volume: bot_ifpricebull
Bottom predicted price based on increasing bearish volume: bot_ifpricebear
Using these four values, the strategy calculates the final maxprice and minprice based on volume. If the price settles above the max value, it indicates an upward trend; if it settles below the min value, it indicates a downward trend.
📌 The indicator does not solely rely on the maxprice and minprice conditions. It incorporates complex and sophisticated analysis by considering average volume and candle size.
During a decline, if the average volume and spread of bullish candles exceed those of bearish candles and the price settles above the max value, a long position is entered.
During a rise, if the average volume and spread of bearish candles exceed those of bullish candles and the price settles below the min value, a short position is entered.
Even if the above conditions are met, if the buying pressure significantly outweighs the selling pressure, the position will be closed, but a reverse position will not be entered.
Reviewing historical data shows that while there are instances where the position switches from long to short immediately, there are also cases where the position is closed and re-entered after a few candles.
📌 Trading volume is one of the most traditional yet essential indicators, accurately reflecting price direction. This strategy, which simultaneously predicts fundamental trading volume and price changes, consistently achieves a profit factor above 3.
Characteristics and Historical Data of the Strategy
🔴 Short position entry: April 11, 2022
🟢 Long position entry after closing short: January 11, 2023
⚫ Short position holding period: 270 days
🟢 Long position entry: October 9, 2020
🔵 Long position exit: November 30, 2019
⚫ Long position holding period: 52 days
🟢 Long position entry: November 30, 2019
🔵 Long position exit: February 22, 2021
⚫ Long position holding period: 84 days
Settings Explanation
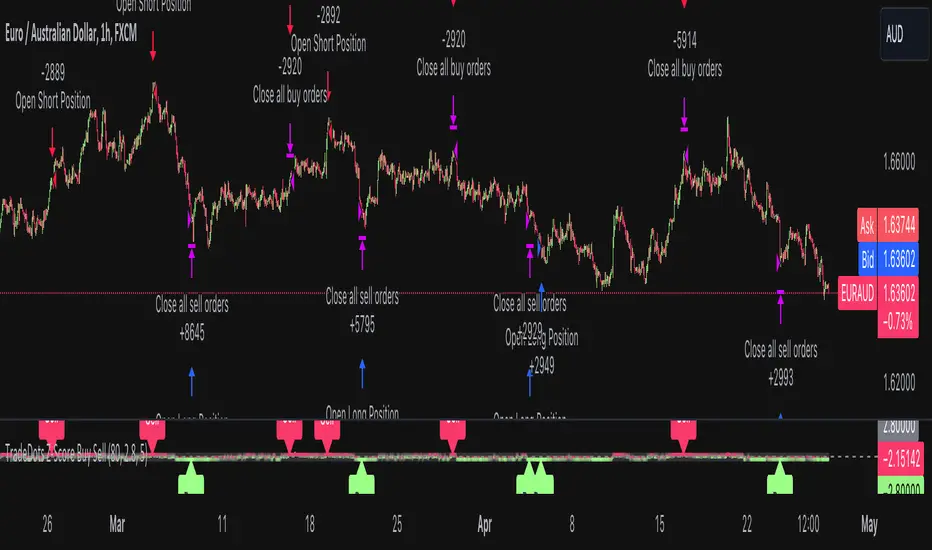
🛠️ In the input, you can choose between spot and futures. Buy and sell signals are generated in spot trading, while long and short signals are generated in futures trading.
🌈 You can configure the screen view.
Fibonacci Trend
Falling Fibonacci levels from the top: 382 and 618 levels (Red lines)
Rising Fibonacci levels from the bottom: 382 and 618 levels (Green lines)
When the price stays within the 382 and 618 levels of the falling Fibonacci, the background turns red; when it stays within the 382 and 618 levels of the rising Fibonacci, the background turns green.
Real-time Volume Strength of Bullish and Bearish Candles
Red arrow: Appears when the strength of bearish candles increases
Green arrow: Appears when the strength of bullish candles increases
Cumulative Volume of Bullish and Bearish Candles during the Trend
Cumulative data of falling bullish and bearish candles from the top
Cumulative data of rising bullish and bearish candles from the bottom
Profit Table
Provides annual and monthly profit tables.
Setting Options
You can change the options in the attributes to test different configurations.
📌 Trading Data
Although Binance data starts from 2017, limiting the number of trades to 60 as of July 2024, this does not undermine the validity of the strategy. Binance provides reliable volume data, which is crucial for evaluating the strategy's performance. In contrast, exchanges like Bitstamp may have longer trading histories but insufficient volume to properly assess the strategy's actual performance. A volume-based strategy cannot be reliably tested on an exchange with low trading volume. Therefore, despite the limited number of trades on Binance, its reliable volume data justifies its use for this strategy.
► Backtesting Details:
Timeframe: 1D / Bitcoin / TetherUS
Initial Balance: $50,000 (Enter the initial capital you will invest)
Order Size: 10% (Enter the percentage of your account balance you will trade)
Commission: 0.04% (Enter the trading commission)
Slippage: 10 ticks (Enter the slippage you want to test)
When using the strategy:
📢 Timeframe: While the strategy performs well on timeframes lower than daily, it is particularly profitable on the daily timeframe.
📢 Exchange: It is recommended to use Binance due to its reliable volume data.
📢 This strategy is suitable for traders who have the patience to hold positions for extended periods, as it calculates the size of bullish and bearish candles carefully and does not change positions easily.
📢 Spot trading is recommended over futures, and if using futures, leverage should be limited to a maximum of 2x.
Pine Script® stratejisi