Relative Strength vs SPX
This indicator calculates the ratio of the current chart's price to the S&P 500 Index (SPX), providing a measure of the stock's relative strength compared to the broader market.
Key Features:
Dynamic High/Low Detection: Highlights periods when the ratio makes a new high (green) or a new low (red) based on a user-defined lookback period.
Customizable Lookback: The lookback period for detecting highs and lows can be adjusted in the settings for tailored analysis.
Visual Overlay: The ratio is plotted in a separate pane, allowing easy comparison of relative strength trends.
This tool is useful for identifying stocks outperforming or underperforming the S&P 500 over specific timeframes.
Trend

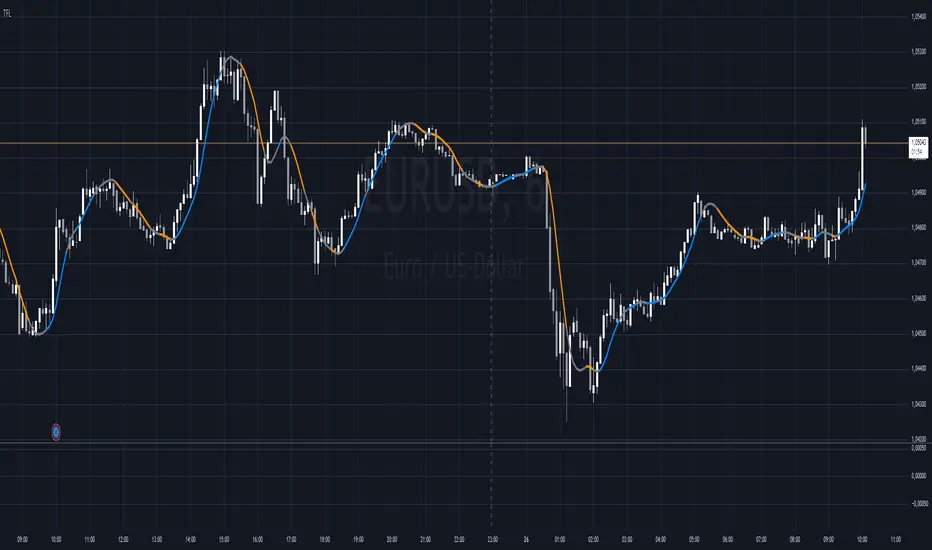
Trend Flow Line (TFL)The Trend Flow Line (TFL) is a versatile moving average indicator that dynamically adjusts to trends using a combination of Hull and Weighted Moving Averages, with optional color coding for bullish and bearish trends.
Introduction
The Trend Flow Line (TFL) is a powerful indicator designed to help traders identify and follow market trends with precision. It combines multiple moving average techniques to create a responsive yet smooth trendline. Whether you're a beginner or an experienced trader, the TFL can enhance your chart analysis by highlighting key price movements and trends.
Detailed Description
The Trend Flow Line (TFL) goes beyond traditional moving averages by leveraging a hybrid approach to calculate trends.
Here's how it works:
.........
Combination of Hull and Weighted Moving Averages
The TFL integrates the Hull Moving Average (HMA), known for its fast responsiveness, and the Double Weighted Moving Average (DWMA), which offers smooth transitions.
The HMA is adjusted dynamically based on the user-defined length, ensuring adaptability to various trading styles and timeframes.
.....
Dynamic Smoothing
The TFL calculates its value by averaging the HMA and DWMA, creating a balanced line that responds to market fluctuations without excessive noise.
This balance makes it ideal for identifying both short-term reversals and long-term trends.
.....
Customizable Features
Timeframe: Analyze the indicator on custom timeframes, independent of the chart's current timeframe.
Color Coding: Optional color settings visually differentiate bullish (uptrend) and bearish (downtrend) phases.
Line Width: Adjust the line thickness to suit your chart preferences.
Color Smoothness: Fine-tune how quickly the color changes to reflect trend shifts, providing a visual cue for potential reversals.
The TFL's algorithm ensures a blend of precision and adaptability, making it suitable for any market or trading strategy.
.........
The Trend Flow Line (TFL) is an essential tool for traders looking to stay ahead of market trends while maintaining a clear and visually intuitive charting experience. It combines HMA and DWMA for trend sensitivity and smoothness.
Daily PlayDaily Play Indicator
The Daily Play Indicator is a clean and versatile tool designed to help traders organize and execute their daily trading plan directly on their charts. This indicator simplifies your workflow by visually displaying key inputs like market trend, directional bias, and key levels, making it easier to focus on your trading strategy.
Features
Dropdown Selection for Trend and Bias:
• Set the overall market trend (Bullish, Bearish, or Neutral) and your directional bias (Long, Short, or Neutral) using intuitive dropdown menus. No more manual typing or guesswork!
Key Levels:
Quickly input and display the Previous Day High and Previous Day Low. These levels are essential for many trading strategies, such as breakouts.
Real-Time News Notes:
Add a quick note about impactful news or market events (e.g., “Fed meeting today” or “Earnings season”) to keep contextual awareness while trading.
Simple On-Chart Display:
The indicator creates a “table-like” structure on the chart, aligning your inputs in an easy-to-read format. The data is positioned dynamically so it doesn’t obstruct the price action.
Customisable Visual Style:
Simple labels with clear text to ensure that your chart remains neat and tidy.
----
Use Case
The Daily Play Indicator is ideal for:
• Day traders and scalpers who rely on precise planning and real-time execution.
• Swing traders looking to mark critical levels and develop a trade plan before the session begins.
• Anyone who needs a structured way to stay focused and disciplined during volatile market conditions.
By integrating this tool into your workflow, you can easily align your daily preparation with live market action.
----
How to Use
Open the indicator settings to configure your inputs:
• Trend: Use the dropdown to choose between Bullish, Bearish, or Neutral.
• Bias: Select Long, Short, or Neutral to align your personal bias with the market.
• Previous Day Levels: Enter the High and Low of the previous trading session for key reference points.
• News: Add a short description of any relevant market-moving events.

Heikin Ashi Processed Generalized Smooth StepDisclaimer : This is my attempt of smoothing and improving @tarasenko_ script. Find the originial author here :
Overview:
The Smooth Step Heikin Ashi Indicator is an enhanced version of the original script developed by tarasenko_. This advanced TradingView tool integrates Heikin Ashi candlestick calculations with a sophisticated smoothing oscillator, offering traders improved trend visualization and dynamic alert capabilities.
Key Enhancements:
Refined Heikin Ashi Calculations: The indicator computes smoothed Open, High, Low, and Close (OHLC) values with adjustable factors, allowing for more precise trend analysis. It also includes an optional second-level modified Heikin Ashi calculation for additional smoothing.
Advanced Smooth Step Oscillator: Utilizing Pascal’s triangle, this oscillator provides a visual representation of price momentum. Traders can configure the lookback period, equation order, and threshold to tailor the oscillator to specific trading strategies.
Enhanced Customization Options: Users can toggle between standard and Heikin Ashi candles, adjust smoothing parameters, and set display preferences to align with their analytical needs.
Noise Reduction: Smoothes out market fluctuations using customizable Heikin Ashi factors. Introduces a second-level smoothing option for even greater noise reduction, allowing traders to focus on the core trend.
Original Indicator :
Heikin Ashi processed version :
Visualization Features:
Heikin Ashi Candles: Displays candles with customizable colors and visibility settings, aiding in clearer trend identification.
Smooth Step Oscillator Line: Plots a line that reflects trend strength and momentum, assisting traders in making informed decisions.
Threshold Line: Provides a visual reference point to facilitate quick assessments of market conditions.
Conclusion:
Building upon tarasenko_'s original work, the Smooth Step Heikin Ashi Indicator delivers a robust tool for traders seeking refined market analysis. Its combination of advanced smoothing techniques and dynamic alert features makes it a valuable addition to any trader's toolkit.

SynthesisDeFi - Anchored TWAPA simple Anchored TWAP created by Oliver Fujimori
Key Concept
TWAP is calculated by taking the average of multiple asset prices at regular time intervals across a set period. By averaging out these prices, TWAP helps smooth out short-term fluctuations, providing a more stable price representation over time.
Advantages of TWAP
Simplicity: The TWAP calculation is straightforward and computationally light, making it practical for on-chain calculations in DeFi.
Protection Against Flash Loan Attacks: By averaging prices over time, TWAP offers some protection against temporary price manipulations commonly seen with flash loans.
Uses and Benefits of TWAP
Reducing Market Impact for Large Orders: TWAP is used as a strategy for executing large orders by breaking them into smaller parts over a period, ensuring that the average execution price is close to the TWAP value, reducing the risk of price manipulation.
Minimizing Slippage: In DeFi, TWAP provides a stable price reference by averaging prices over time, making it less susceptible to sudden price changes (slippage) that can occur in highly volatile markets.
Protection Against Manipulation: TWAP prices are less vulnerable to flash loan attacks and sudden price spikes since they rely on multiple price points over a period rather than a single spot price.

Samih Signal AV V2The Samih Signal VA indicator is built for traders who prioritize technical analysis to determine market entry and exit points. It combines signals based on volume, moving averages, the Volume Weighted Average Price (VWAP), and identifies specific candlestick patterns, such as the Pin Bar and Inside Bar. This indicator assists in spotting optimal moments to buy or sell by analyzing trends, volume activity, and nearby liquidity zones.
Parameters and Features:
Simple Moving Average (MA) and VWAP:
Samih Signal VA uses a 50-period simple moving average for trend identification, paired with VWAP to refine price analysis with volume-weighted data.
Together, these components reveal whether the market is trending upward or downward, strengthening the reliability of entry and exit signals.
Volume Threshold:
A volume filter is applied by calculating a 20-period moving average, then setting a threshold at 1.2 times this average volume. This filter helps prevent false signals, focusing only on periods of increased market interest.
Candlestick Pattern Recognition:
Pin Bar: Detects this popular reversal/continuation pattern in both bullish and bearish scenarios, indicating potential entry or exit points.
Inside Bar: Identifies this pattern, which represents a moment of price compression and indecision, often preceding a breakout.
Trend Identification:
The indicator defines an uptrend when the price remains above both the MA and VWAP. A downtrend is confirmed when the price stays below these indicators.
Liquidity Zone Detection:
Samih Signal VA includes a feature to approximate liquidity zones, identifying recent support and resistance levels. Recognizing when prices approach these areas enhances the accuracy of buy or sell signals.
Buy and Sell Signal Logic:
Buy Signal: Triggered when a bullish Pin Bar or Inside Bar appears in an uptrend with high volume and proximity to a liquidity zone.
Sell Signal: Generated when a bearish Pin Bar or Inside Bar is detected in a downtrend with high volume, near a liquidity zone.
Signal Display on the Chart:
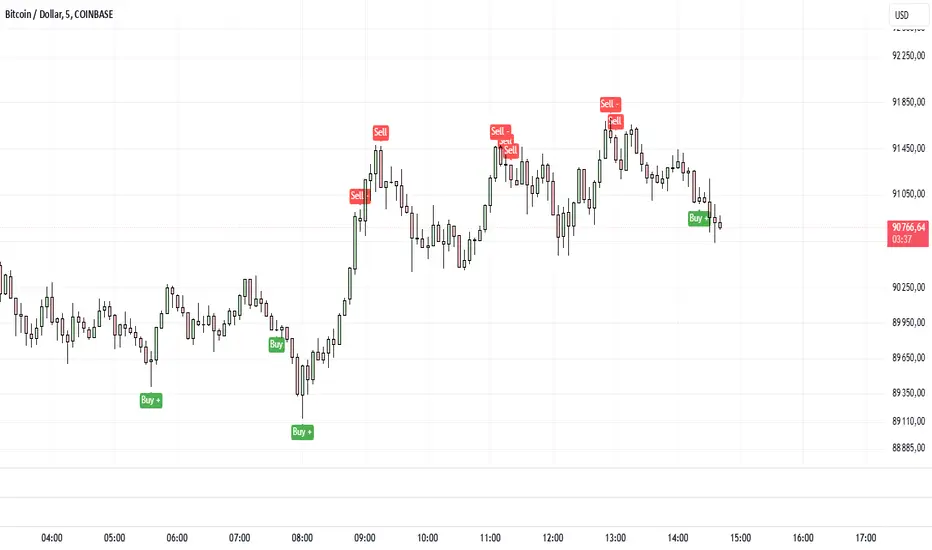
The indicator marks buy signals with a green “BUY” label below the bar, and sell signals with a red “SELL” label above the bar, directly on the chart for immediate clarity.
Summary:
The Samih Signal VA is suited for traders focused on precise entries and exits, integrating trend analysis, volume metrics, and candlestick patterns. By identifying liquidity zones, this indicator reduces the likelihood of false signals and provides clear buy and sell alerts.
This description can be easily added to TradingView to help users understand the features and decision-making logic of the Samih Signal VA indicator. Let me know if you’d like any additional adjustments!
Adaptive Kalman filter - Trend Strength Oscillator (Zeiierman)█ Overview
The Adaptive Kalman Filter - Trend Strength Oscillator by Zeiierman is a sophisticated trend-following indicator that uses advanced mathematical techniques, including vector and matrix operations, to decompose price movements into trend and oscillatory components. Unlike standard indicators, this model assumes that price is driven by two latent (unobservable) factors: a long-term trend and localized oscillations around that trend. Through a dynamic "predict and update" process, the Kalman Filter leverages vectors to adaptively separate these components, extracting a clearer view of market direction and strength.
█ How It Works
This indicator operates on a trend + local change Kalman Filter model. It assumes that price movements consist of two underlying components: a core trend and an oscillatory term, representing smaller price fluctuations around that trend. The Kalman Filter adaptively separates these components by observing the price series over time and performing real-time updates as new data arrives.
Predict and Update Procedure: The Kalman Filter uses an adaptive predict-update cycle to estimate both components. This cycle allows the filter to adjust dynamically as the market evolves, providing a smooth yet responsive signal. The trend component extracted from this process is plotted directly, giving a clear view of the prevailing direction. The oscillatory component indicates the tendency or strength of the trend, reflected in the green/red coloration of the oscillator line.
Trend Strength Calculation: Trend strength is calculated by comparing the current oscillatory value against a configurable number of past values.
█ Three Kalman filter Models
This indicator offers three distinct Kalman filter models, each designed to handle different market conditions:
Standard Model: This is a conventional Kalman Filter, balancing responsiveness and smoothness. It works well across general market conditions.
Volume-Adjusted Model: In this model, the filter’s measurement noise automatically adjusts based on trading volume. Higher volumes indicate more informative price movements, which the filter treats with higher confidence. Conversely, low-volume movements are treated as less informative, adding robustness during low-activity periods.
Parkinson-Adjusted Model: This model adjusts measurement noise based on price volatility. It uses the price range (high-low) to determine the filter’s sensitivity, making it ideal for handling markets with frequent gaps or spikes. The model responds with higher confidence in low-volatility periods and adapts to high-volatility scenarios by treating them with more caution.
█ How to Use
Trend Detection: The oscillator oscillates around zero, with positive values indicating a bullish trend and negative values indicating a bearish trend. The further the oscillator moves from zero, the stronger the trend. The Kalman filter trend line on the chart can be used in conjunction with the oscillator to determine the market's trend direction.
Trend Reversals: The blue areas in the oscillator suggest potential trend reversals, helping traders identify emerging market shifts. These areas can also indicate a potential pullback within the prevailing trend.
Overbought/Oversold: The thresholds, such as 70 and -70, help identify extreme conditions. When the oscillator reaches these levels, it suggests that the trend may be overextended, possibly signaling an upcoming reversal.
█ Settings
Process Noise 1: Controls the primary level of uncertainty in the Kalman filter model. Higher values make the filter more responsive to recent price changes, but may also increase susceptibility to random noise.
Process Noise 2: This secondary noise setting works with Process Noise 1 to adjust the model's adaptability. Together, these settings manage the uncertainty in the filter's internal model, allowing for finely-tuned adjustments to smoothness versus responsiveness.
Measurement Noise: Sets the uncertainty in the observed price data. Increasing this value makes the filter rely more on historical data, resulting in smoother but less reactive filtering. Lower values make the filter more responsive but potentially more prone to noise.
O sc Smoothness: Controls the level of smoothing applied to the trend strength oscillator. Higher values result in a smoother oscillator, which may cause slight delays in response. Lower values make the oscillator more reactive to trend changes, useful for capturing quick reversals or volatility within the trend.
Kalman Filter Model: Choose between Standard, Volume-Adjusted, and Parkinson-Adjusted models. Each model adapts the Kalman filter for specific conditions, whether balancing general market data, adjusting based on volume, or refining based on volatility.
Trend Lookback: Defines how far back to look when calculating the trend strength, which impacts the indicator's sensitivity to changes in trend strength. Shorter values make the oscillator more reactive to recent trends, while longer values provide a smoother reading.
Strength Smoothness: Adjusts the level of smoothing applied to the trend strength oscillator. Higher values create a more gradual response, while lower values make the oscillator more sensitive to recent changes.
-----------------
Disclaimer
The information contained in my Scripts/Indicators/Ideas/Algos/Systems does not constitute financial advice or a solicitation to buy or sell any securities of any type. I will not accept liability for any loss or damage, including without limitation any loss of profit, which may arise directly or indirectly from the use of or reliance on such information.
All investments involve risk, and the past performance of a security, industry, sector, market, financial product, trading strategy, backtest, or individual's trading does not guarantee future results or returns. Investors are fully responsible for any investment decisions they make. Such decisions should be based solely on an evaluation of their financial circumstances, investment objectives, risk tolerance, and liquidity needs.
My Scripts/Indicators/Ideas/Algos/Systems are only for educational purposes!

Dynamic Time Period CandlesThis indicator gives the dynamic history of the current price over various time frames as a series of candles on the right of the display, with optional lines on the chart, so that you can assess the current trend more easily.
In the library I found lots of indicators that looked at the previous xx time period candle, but they then immediately switched to the new xx time candle when it started to be formed. This indicator looks back at the rolling previous time period. With this indicator, you can clearly see how price has been behaving over time.
IMPORTANT SETUP INFO:
Initially, you must go into the settings and select the timeframe (in minutes) that your chart is displaying. If you don't do this then the indicator will look back the wrong number of candles and give you totally wrong results.
You can then setup how high you want the candle labels to be on the chart.
Then you can select settings for each candle that you want displayed. Anywhere between 1 and 5 different timeframes can be displayed on the chart at once.
I initially published an indicator called 'Dynamic 4-Hour Candle (Accurate Highs and Lows)', but this new indicator is so different that it needs to be forked and published as a separate indicator. The reasons for this are below:
The original indicator only looked at the previous 4 hour time period. This indicator allows the user to select any time period that they choose.
The original indicator only looked at one time period. This indicator allows to select between one and five time periods on the chart at once.
The original indicator did not put lines on the chart to show the lookback period and the highs and lows of that time period. This indicator does both those things.
The name of the original indicator in no way now describes what this new indicator is capable of, and would be very misleading to anyone who came across it. This new indicator has a name that much more accurately reflects what its' purpose and functionality is.

Trend Trader-RemasteredThe script was originally coded in 2018 with Pine Script version 3, and it was in invite only status. It has been updated and optimised for Pine Script v5 and made completely open source.
Overview
The Trend Trader-Remastered is a refined and highly sophisticated implementation of the Parabolic SAR designed to create strategic buy and sell entry signals, alongside precision take profit and re-entry signals based on marked Bill Williams (BW) fractals. Built with a deep emphasis on clarity and accuracy, this indicator ensures that only relevant and meaningful signals are generated, eliminating any unnecessary entries or exits.
Key Features
1) Parabolic SAR-Based Entry Signals:
This indicator leverages an advanced implementation of the Parabolic SAR to create clear buy and sell position entry signals.
The Parabolic SAR detects potential trend shifts, helping traders make timely entries in trending markets.
These entries are strategically aligned to maximise trend-following opportunities and minimise whipsaw trades, providing an effective approach for trend traders.
2) Take Profit and Re-Entry Signals with BW Fractals:
The indicator goes beyond simple entry and exit signals by integrating BW Fractal-based take profit and re-entry signals.
Relevant Signal Generation: The indicator maintains strict criteria for signal relevance, ensuring that a re-entry signal is only generated if there has been a preceding take profit signal in the respective position. This prevents any misleading or premature re-entry signals.
Progressive Take Profit Signals: The script generates multiple take profit signals sequentially in alignment with prior take profit levels. For instance, in a buy position initiated at a price of 100, the first take profit might occur at 110. Any subsequent take profit signals will then occur at prices greater than 110, ensuring they are "in favour" of the original position's trajectory and previous take profits.
3) Consistent Trend-Following Structure:
This design allows the Trend Trader-Remastered to continue signaling take profit opportunities as the trend advances. The indicator only generates take profit signals in alignment with previous ones, supporting a systematic and profit-maximising strategy.
This structure helps traders maintain positions effectively, securing incremental profits as the trend progresses.
4) Customisability and Usability:
Adjustable Parameters: Users can configure key settings, including sensitivity to the Parabolic SAR and fractal identification. This allows flexibility to fine-tune the indicator according to different market conditions or trading styles.
User-Friendly Alerts: The indicator provides clear visual signals on the chart, along with optional alerts to notify traders of new buy, sell, take profit, or re-entry opportunities in real-time.

Nami Bands with Future Projection [FXSMARTLAB]The Nami Bands ( Inspired by "Nami", meaning "wave" in Japanese) are two dynamic bands around price data: an upper band and a lower band. These bands are calculated based on an Asymmetric Linear Weighted Moving Average of price and a similarly asymmetric weighted standard deviation. This weighting method emphasizes recent data without overreacting to short-term price changes, thus smoothing the bands in line with prevailing market conditions.
Advantages and Benefits of Using the Indicator
* Volatility Analysis: The bands expand and contract with market volatility, helping traders assess periods of high and low volatility. Narrow bands indicate low volatility and potential consolidation, while wide bands suggest increased volatility and potential price movement.
* Dynamic Support and Resistance Levels: By adapting to recent trends, the bands serve as dynamic support (lower band) and resistance (upper band) levels, which traders can use for entry and exit signals.
* Overbought and Oversold Conditions: When prices reach or cross the bands’ outer limits, it may signal overbought (upper band) or oversold (lower band) conditions, suggesting possible reversals or trend slowdowns.
* Trend Confirmation and Continuation: The slope of the central moving average confirms trend direction. An upward slope generally indicates a bullish trend, while a downward slope suggests a bearish trend.
* Anticipating Breakouts and Reversals: The projected bands help identify where price movements may head, allowing traders to anticipate potential breakouts or reversals based on projected support and resistance.
Indicator Parameters
Source (src): The price data used for calculations, by default set to the average of high, low, and close (hlc3).
Length: The period over which calculations are made, defaulted to 50 periods.
Projection Length: The length for future band projection, defaulted to 20 periods.
StdDev Multiplier (mult): A multiplier for the standard deviation, defaulted to 2.0.
Internal Calculations
1. Asymmetric Linear Weighted Moving Average of Price
The indicator uses an Asymmetric Linear Weighted Moving Average (ALWMA) to calculate a central value for the price.
Asymmetric Weighting: This weighting technique assigns the highest weight to the most recent value, with weights decreasing linearly as the data points become older. This structure provides a nuanced focus on recent price trends, while still reflecting historical price levels.
2. Asymmetric Weighted Standard Deviation
The standard deviation in this indicator is also calculated using asymmetric weighting:
Purpose of Asymmetric Weighted Standard Deviation: Rather than aiming for high sensitivity to recent data, this standard deviation measure smooths out volatility by integrating weighted values across the length period, stabilizing the overall measurement of price variability.
This approach yields a balanced view of volatility, capturing broader market trends without being overly reactive to short-lived changes.
3. Upper and Lower Bands
The upper and lower bands are created by adding and subtracting the asymmetric weighted standard deviation from the asymmetric weighted average of price. This creates a dynamic envelope that adjusts to both recent price trends and the smoothed volatility measure:
These bands represent adaptable support and resistance levels that shift with recent market volatility.
Future Band Projection
The indicator provides a projection of the bands based on their current slope.
1. Calculating the Slope of the Bands
The slope for each band is derived from the difference between the current and previous values of each band.
2. Projecting the Bands into the Future
For each period into the future, up to the defined Projection Length, the bands are projected using the current slope.
This feature offers an anticipated view of where support and resistance levels may move, providing insight for future market behavior based on current trends.

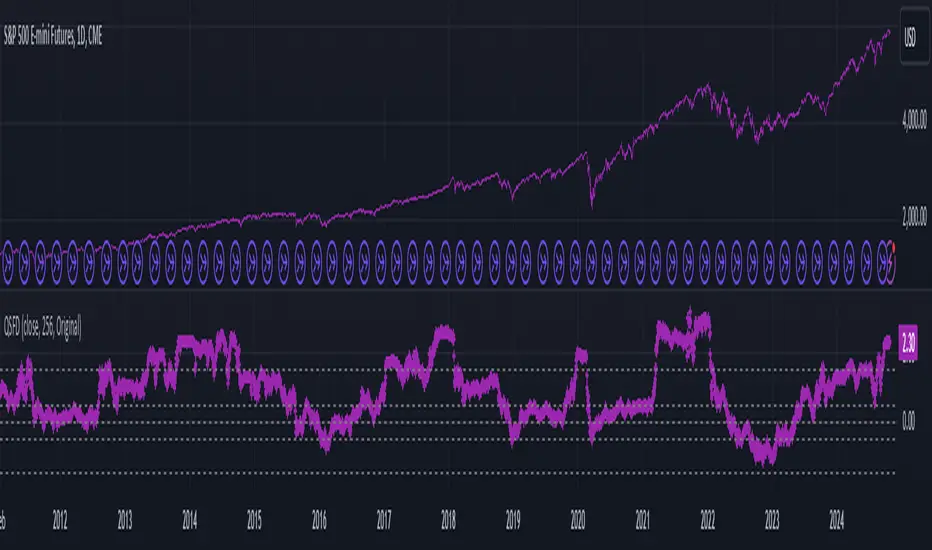
Universal Trend and Valuation System [QuantAlgo]Universal Trend and Valuation System 📊🧬
The Universal Trend and Valuation System by QuantAlgo is an advanced indicator designed to assess asset valuation and trends across various timeframes and asset classes. This system integrates multiple advanced statistical indicators and techniques with Z-score calculations to help traders and investors identify overbought/sell and oversold/buy signals. By evaluating valuation and trend strength together, this tool empowers users to make data-driven decisions, whether they aim to follow trends, accumulate long-term positions, or identify turning points in mean-reverting markets.
💫 Conceptual Foundation and Innovation
The Universal Trend and Valuation System by QuantAlgo provides a unique framework for assessing market valuation and trend dynamics through a blend of Z-score analysis and trend-following algorithm. Unlike traditional indicators that only reflect price direction, this system incorporates multi-layered data to reveal the relative value of an asset, helping users determine whether it’s overvalued, undervalued, or approaching a trend reversal. By combining high quality trend-following tools, such as Dynamic Score Supertrend, DEMA RSI, and EWMA, it evaluates trend stability and momentum quality, while Z-scores of performance ratios like Sharpe, Sortino, and Omega standardize deviations from historical trends, enabling traders and investors to spot extreme conditions. This dual approach allows users to better identify accumulation (undervaluation) and distribution (overvaluation) phases, enhancing strategies like Dollar Cost Averaging (DCA) and overall timing for entries and exits.
📊 Technical Composition and Calculation
The Universal Trend-Following Valuation System is composed of several trend-following and valuation indicators that create a dynamic dual scoring model:
Risk-Adjusted Ratios (Sharpe, Sortino, Omega): These ratios assess trend quality by analyzing an asset’s risk-adjusted performance. Sharpe and Sortino provide insight into trend consistency and risk/reward, while Omega evaluates profitability potential, helping traders and investors assess how favorable a trend or an asset is relative to its associated risk.
Dynamic Z-Scores: Z-scores are applied to various metrics like Price, RSI, and RoC, helping to identify statistical deviations from the mean, which indicate potential extremes in valuation. By combining these Z-scores, the system produces a cumulative score that highlights when an asset may be overbought or oversold.
Aggregated Trend-Following Indicators: The model consolidates multiple high quality indicators to highlight probable trend shifts. This helps confirm the direction and strength of market moves, allowing users to spot reversals or entry points with greater clarity.
📈 Key Indicators and Features
The Universal Trend and Valuation System combines various technical and statistical tools to deliver a well-rounded analysis of market trends and valuation:
The indicator utilizes trend-following indicators like RSI with DEMA smoothing and Dynamic Score Supertrend to minimize market noise, providing clearer and more stable trend signals. Sharpe, Sortino, and Omega ratios are calculated to assess risk-adjusted performance and volatility, adding a layer of analysis for evaluating trend quality. Z-scores are applied to these ratios, as well as Price and Rate of Change (RoC), to detect deviations from historical trends, highlighting extreme valuation levels.
The system also incorporates multi-layered visualization with gradient color coding to signal valuation states across different market conditions. These adaptive visual cues, combined with threshold-based alerts for overbought and oversold zones, help traders and investors track probable trend reversals or continuations and identify accumulation or distribution zones, adding reliability to both trend-following and mean-reversion strategies.
⚡️ Practical Applications and Examples
✅ Add the Indicator: Add the Universal Trend-Following Valuation System to your favourites and to your chart.
👀 Monitor Trend Shifts and Valuation Levels: Watch the average Z score, trend probability state and gradient colors to identify overbought and oversold conditions. During undervaluation, consider using a DCA strategy to gradually accumulate positions (buy), while overvaluation may signal distribution or profit-taking phases (sell).
🔔 Set Alerts: Configure alerts for significant trend or valuation changes, ensuring you can act on market movements promptly, even when you’re not actively monitoring the charts.
🌟 Summary and Usage Tips
The Universal Trend and Valuation System by QuantAlgo is a highly adaptable tool, designed to support both trend-following and valuation analysis across different market environments. By combining valuation metrics with high quality trend-following indicators, it helps traders and investors identify the relative value of an asset based on historical norms, providing more reliable overbought/sell and oversold/buy signals. The tool’s flexibility across asset types and timeframes makes it ideal for both short-term trading and long-term investment strategies like DCA, allowing users to capture meaningful trends while minimizing noise.

Trend Continuation RatioThis TradingView indicator calculates the likelihood of consecutive bullish or bearish days over a specified period, giving insights into day-to-day continuation patterns within the market.
How It Works
Period Length Input:
The user sets the period length (e.g., 20 days) to analyze.
After each period, the counts reset, allowing fresh data for each new interval.
Bullish and Bearish Day Definitions:
A day is considered bullish if the closing price is higher than the opening price.
A day is considered bearish if the closing price is lower than the opening price.
Count Tracking:
Within each specified period, the indicator tracks:
Total Bullish Days: The number of days where the close is greater than the open.
Total Bearish Days: The number of days where the close is less than the open.
Bullish to Bullish Continuations: Counts each instance where a bullish day is followed by another bullish day.
Bearish to Bearish Continuations: Counts each instance where a bearish day is followed by another bearish day.
Calculating Continuation Ratios:
The Bullish Continuation Ratio is calculated as the percentage of bullish days that were followed by another bullish day:
Bullish Continuation Ratio = (Bullish to Bullish Continuations /Total Bullish Days)×100
Bullish Continuation Ratio=( Total Bullish Days/Bullish to Bullish Continuations )×100
The Bearish Continuation Ratio is the percentage of bearish days followed by another bearish day:
Bearish Continuation Ratio = (Bearish to Bearish Continuations/Total Bearish Days)×100
Bearish Continuation Ratio=( Total Bearish Days/Bearish to Bearish Continuations )×100
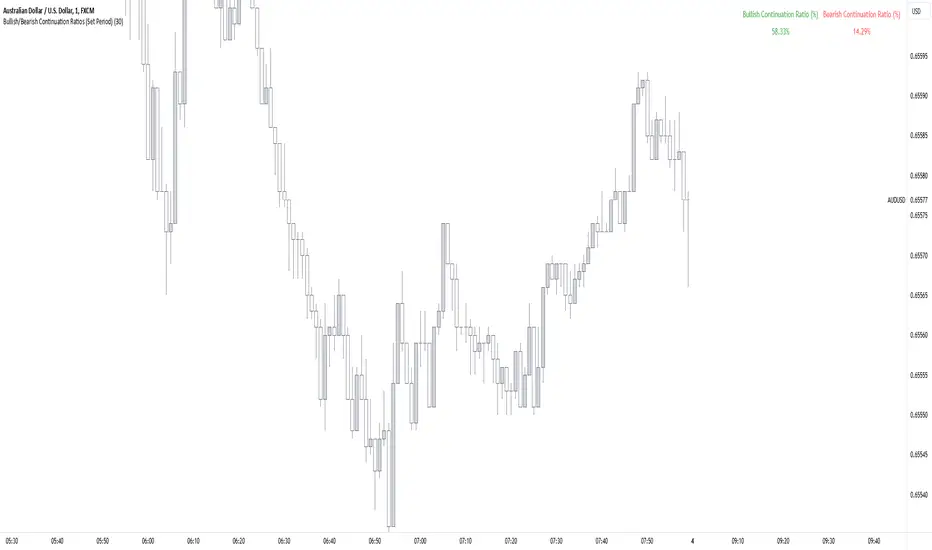
Display on Chart:
The indicator displays a table in the top-right corner of the chart with:
Bullish Continuation Ratio (%): Percentage of bullish days that led to another bullish day within the period.
Bearish Continuation Ratio (%): Percentage of bearish days that led to another bearish day within the period.
Usage Insights
High Ratios: If the bullish or bearish continuation ratio is high, it suggests a trend where bullish/bearish days often lead to similar days, indicating possible momentum.
Low Ratios: Low continuation ratios indicate frequent reversals, which could suggest a range-bound or volatile market.
This indicator is helpful for assessing short-term trend continuation tendencies, allowing traders to gauge whether they are more likely to see follow-through on bullish or bearish days within a chosen timeframe.
Future Trend Channel [ChartPrime]The Future Trend Channel indicator is a dynamic tool for identifying trends and projecting future prices based on channel formations. The indicator uses SMA (Simple Moving Average) and volatility calculations to plot channels that visually represent trends. It also detects moments of lower momentum, indicated by neutral color changes in the channels, and projects future price levels for up to 50 bars ahead.
⯁ KEY FEATURES AND HOW TO USE
⯌ Dynamic Trend Channels :
The indicator draws channels when a trend is identified. It uses a combination of SMA and volatility to determine the direction and strength of the trend. Each channel is visualized with a specific color, where green indicates an uptrend and orange represents a downtrend.
Example of channels during uptrend and downtrend:
⯌ Momentum-Based Color Shifts :
The indicator adapts its channel colors based on momentum changes. When the starting point (Y1) of a channel is higher than its ending point (Y2) during an uptrend, the channel turns neutral, indicating lower momentum and a possible ranging market. The same applies in a downtrend, where the channel turns neutral if Y1 is lower than Y2.
Example of neutral momentum channels:
⯌ Future Price Projection :
At the end of each channel, the indicator generates a projected future price based on the midpoint of the channel. By default, this projection is made 50 bars into the future, but users can adjust the number of bars to their preference.
Example of future price projection:
⯌ Diamond Signals for Valid Trends :
Lime-colored diamonds appear when an uptrend channel is confirmed, while orange diamonds indicate valid downtrend channels. These signals confirm the presence of a strong trend and help identify valid entry and exit points. Neutral channels, which indicate lower momentum, do not show diamond signals.
Example of trend confirmation signals:
⯌ Customizable Settings :
Users can adjust the channel length (how far back the trend is analyzed) and the width (which determines the channel boundaries based on volatility). The future price projection can also be customized to forecast further or fewer bars into the future.
⯁ USER INPUTS
Trend Length : Sets the number of bars used to calculate the trend channels.
Channel Width : Adjusts the width of the channels, based on volatility (ATR multiplier).
Up and Down Colors : Allows customization of the colors used for uptrend and downtrend channels.
Future Bars : Sets the number of bars used for future price projection.
⯁ CONCLUSION
The Future Trend Channel indicator is a versatile tool for identifying and trading trends. With its ability to detect momentum shifts and project future prices, it provides traders with key insights for making more informed decisions. The use of diamond signals for trend validation adds an extra layer of confirmation, helping traders act with greater confidence during volatile or trending markets.

Hodrick-Prescott Cycle Component (YavuzAkbay)The Hodrick-Prescott Cycle Component indicator in Pine Script™ is an advanced tool that helps traders isolate and analyze the cyclical deviations in asset prices from their underlying trend. This script calculates the cycle component of the price series using the Hodrick-Prescott (HP) filter, allowing traders to observe and interpret the short-term price movements around the long-term trend. By providing two views—Percentage and Price Difference—this indicator gives flexibility in how these cyclical movements are visualized and interpreted.
What This Script Does
This indicator focuses exclusively on the cycle component of the price, which is the deviation of the current price from the long-term trend calculated by the HP filter. This deviation (or "cycle") is what traders analyze for mean-reversion opportunities and overbought/oversold conditions. The script allows users to see this deviation in two ways:
Percentage Difference: Shows the deviation as a percentage of the trend, giving a normalized view of the price’s distance from its trend component.
Price Difference: Shows the deviation in absolute price terms, reflecting how many price units the price is above or below the trend.
How It Works
Trend Component Calculation with the HP Filter: Using the HP filter, the script isolates the trend component of the price. The smoothness of this trend is controlled by the smoothness parameter (λ), which can be adjusted by the user. A higher λ value results in a smoother trend, while a lower λ value makes it more responsive to short-term changes.
Cycle Component Calculation: Percentage Deviation (cycle_pct) calculated as the difference between the current price and the trend, divided by the trend, and then multiplied by 100. This metric shows how far the price deviates from the trend in relative terms. Price Difference (cycle_price) simply the difference between the current price and the trend component, displaying the deviation in absolute price units.
Conditional Plotting: The user can choose to view the cycle component as either a percentage or a price difference by selecting the Display Mode input. The indicator will plot the chosen mode in a separate pane, helping traders focus on the preferred measure of deviation.
How to Use This Indicator
Identify Overbought/Oversold Conditions: When the cycle component deviates significantly from the zero line (shown with a dashed horizontal line), it may indicate overbought or oversold conditions. For instance, a high positive cycle component suggests the price may be overbought relative to the trend, while a large negative cycle suggests potential oversold conditions.
Mean-Reversion Strategy: In mean-reverting markets, traders can use this indicator to spot potential reversal points. For example, if the cycle component shows an extreme deviation from zero, it could signal that the price is likely to revert to the trend. This can help traders with entry and exit points when the asset is expected to correct back toward its trend.
Trend Strength and Cycle Analysis: By comparing the magnitude and duration of deviations, traders can gauge the strength of cycles and assess if a new trend might be forming. If the cycle component remains consistently positive or negative, it may indicate a persistent market bias, even as prices fluctuate around the trend.
Percentage vs. Price Difference Views: Use the Percentage Difference mode to standardize deviations and compare across assets or different timeframes. This is especially helpful when analyzing assets with varying price levels. Use the Price Difference mode when an absolute deviation (price units) is more intuitive for spotting overbought/oversold levels based on the asset’s actual price.
Using with Hodrick-Prescott: You can also use Hodrick-Prescott, another indicator that I have adapted to the Tradingview platform, to see the trend on the chart, and you can also use this indicator to see how far the price is deviating from the trend. This gives you a multifaceted perspective on your trades.
Practical Tips for Traders
Set the Smoothness Parameter (λ): Adjust the λ parameter to match your trading timeframe and asset characteristics. Lower values make the trend more sensitive, which might suit short-term trading, while higher values smooth out the trend for long-term analysis.
Cycle Component as Confirmation: Combine this indicator with other momentum or trend indicators for confirmation of overbought/oversold signals. For example, use the cycle component with RSI or MACD to validate the likelihood of mean-reversion.
Observe Divergences: Divergences between price movements and the cycle component can indicate potential reversals. If the price hits a new high, but the cycle component shows a smaller deviation than previous highs, it could signal a weakening trend.

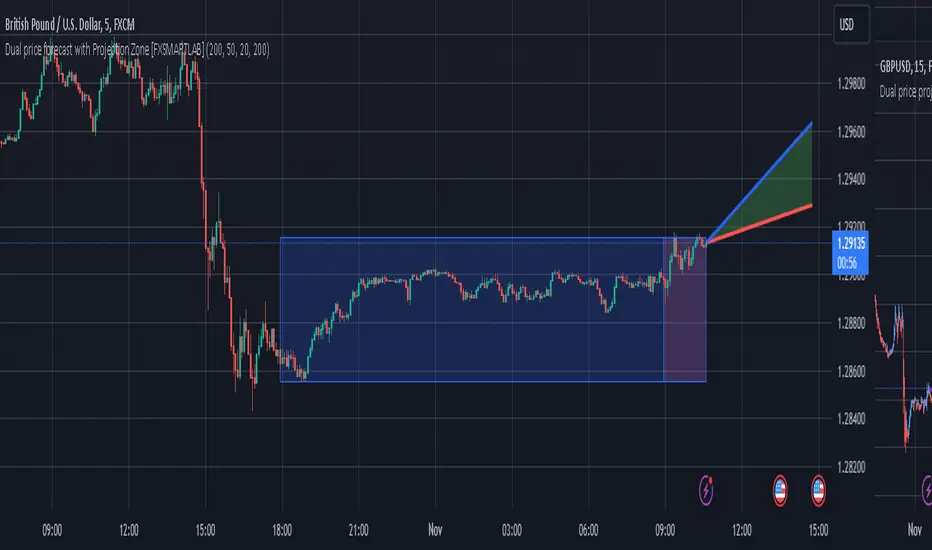
Dual price forecast with Projection Zone [FXSMARTLAB]The Dual Price Forecast with Projection Zone indicator is built to simulate potential future price paths based on historical price movements over two defined lookback periods. By running multiple trials (or simulations) on these historical price movements, the indicator achieves a more robust forecast, incorporating the inherent variability of price behavior.
Key Components and Calculation Details
1. Lookback Periods and Historical Price Movements
Lookback Period 1 and Lookback Period 2 specify the range of past data used to generate each projection. For each period, the indicator calculates the price variations (differences between the closing and opening prices) and stores these in arrays.
These historical price variations capture the volatility and price patterns within each period, serving as templates for future price behavior.
2. Trials: Purpose and Function
The trials are a critical element in the projection calculation. Each trial represents a single simulation of possible future price movements, derived from a random reordering of the historical price variations in each lookback period.
By running multiple trials , the indicator explores various sequences of historical movements, simulating different possible future paths. Each trial adds to the projection’s robustness by capturing a unique potential price path based on past behavior.
Running these multiple trials allows the indicator to account for randomness in price behavior, making the projections more comprehensive by covering a range of scenarios rather than relying on a single deterministic forecast.
3. Reverse Option
The reverse option allows the indicator to invert the direction of price movements within each lookback period. When enabled, historical uptrends are treated as downtrends, and vice versa.
This feature is particularly valuable in scenarios where traders expect a potential reversal in market direction. By enabling the reverse option, the indicator can simulate what might happen if past trends inverted, providing an alternative forecast path that considers possible market reversals.
This allows traders to assess both continuation and reversal scenarios, giving them a more balanced view of potential future price paths and helping them prepare for either market direction.
4. Generating the Average Projection Path
Once the trials are complete, the indicator calculates an average projected price path for each lookback period by averaging the results of all trials. This average represents the most likely price trend based on historical data and provides a smoothed projection that mitigates extreme outliers.
By averaging across all trial paths, the indicator generates a more reliable and balanced forecast line, smoothing out the fluctuations that might appear if only one trial or a small number of trials were used.
5. Projection Zone Visualization
The indicator plots the two average projection paths (one for each lookback period) as Projection 1 and Projection 2, each in a user-defined color.
The Projection Zone is the area between these two lines, filled with a semi-transparent color. This zone visually represents the potential range of future price movement, highlighting where prices are likely to oscillate if historical trends persist.
The Projection Zone effectively functions as a potential support and resistance boundary, providing traders with a visual reference for possible price fluctuations within a specific range.
6. Display of Lookback Zones
To give context to the projections, the indicator can also display colored lookback zones on the chart. These zones correspond to Lookback Period 1 and Lookback Period 2 and are color-coded to match their respective projection lines.
These zones allow traders to see the sections of historical data used in the calculation, helping them understand which past price behaviors influenced the current projections.
Benefits of the Indicator
The "Dual Price Forecast with Projection Zone" indicator provides a multi-scenario forecast based on past price dynamics. Its use of trials ensures that projections are not based on a single deterministic path but on a range of possible scenarios that better reflect the inherent randomness in financial markets.
By generating a probabilistic forecast within a defined zone, the indicator helps traders to:
Anticipate potential price ranges and areas of support/resistance based on historical trends.
Understand the influence of different timeframes (short-term and long-term lookbacks) on future price behavior.
Make informed decisions by visualizing the likely variability of future prices within a controlled projection zone.
Prepare for both continuation and reversal scenarios, thanks to the reverse option. This feature is especially useful in markets where trends may change direction, as it allows traders to explore what might happen
Linear Regression Channel UltimateKey Features and Benefits
Logarithmic scale option for improved analysis of long-term trends and volatile markets
Activity-based profiling using either touch count or volume data
Customizable channel width and number of profile fills
Adjustable number of most active levels displayed
Highly configurable visual settings for optimal chart readability
Why Logarithmic Scale Matters
The logarithmic scale option is a game-changer for analyzing assets with exponential growth or high volatility. Unlike linear scales, log scales represent percentage changes consistently across the price range. This allows for:
Better visualization of long-term trends
More accurate comparison of price movements across different price levels
Improved analysis of volatile assets or markets experiencing rapid growth
How It Works
The indicator calculates a linear regression line based on the specified period
Upper and lower channel lines are drawn at a customizable distance from the regression line
The space between the channel lines is divided into a user-defined number of levels
For each level, the indicator tracks either:
- The number of times price touches the level (touch count method)
- The total volume traded when price is at the level (volume method)
The most active levels are highlighted based on this activity data
Understanding Touch Count vs Volume
Touch count method: Useful for identifying key support/resistance levels based on price action alone
Volume method: Provides insight into levels where the most trading activity occurs, potentially indicating stronger support/resistance
Practical Applications
Trend identification and strength assessment
Support and resistance level discovery
Entry and exit point optimization
Volume profile analysis for improved market structure understanding
This Linear Regression Channel indicator combines powerful statistical analysis with flexible visualization options, making it an invaluable tool for traders and analysts across various timeframes and markets. Its unique features, especially the logarithmic scale and activity profiling, provide deeper insights into market behavior and potential turning points.

Quick scan for drift🙏🏻
ML based algorading is all about detecting any kind of non-randomness & exploiting it, kinda speculative stuff, not my way, but still...
Drift is one of the patterns that can be exploited, because pure random walks & noise aint got no drift.
This is an efficient method to quickly scan tons of timeseries on the go & detect the ones with drift by simply checking wherther drift < -0.5 or drift > 0.5. The code can be further optimized both in general and for specific needs, but I left it like dat for clarity so you can understand how it works in a minute not in an hour
^^ proving 0.5 and -0.5 are natural limits with no need to optimize anything, we simply put the metric on random noise and see it sits in between -0.5 and 0.5
You can simply take this one and never check anything again if you require numerous live scans on the go. The metric is purely geometrical, no connection to stats, TSA, DSA or whatever. I've tested numerous formulas involving other scaling techniques, drift estimates etc (even made a recursive algo that had a great potential to be written about in a paper, but not this time I gues lol), this one has the highest info gain aka info content.
The timeseries filtered by this lil metric can be further analyzed & modelled with more sophisticated tools.
Live Long and Prosper
P.S.: there's no such thing as polynomial trend/drift, it's alwasy linear, these curves you see are just really long cycles
P.S.: does cheer still work on TV? @admin
Trend Levels [ChartPrime]The Trend Levels indicator is designed to identify key trend levels (High, Mid, and Low) during market trends, based on real-time calculations of highest, lowest, and mid-level values over a customizable length. Additionally, the indicator calculates trend strength by measuring the ratio of candles closing above or below the midline, providing a clear view of the ongoing trend dynamics and strength.
⯁ KEY FEATURES AND HOW TO USE
⯌ Trend Shift Signals :
Trend shifts, based on highest and lowest values during input length. When high is == to highest it will change trend to up when low == lowest value it will be shift to down trend.
// Calculate highest and lowest over the specified length
h = ta.highest(length)
l = ta.lowest(length)
// Determine trend direction: if the current high is the highest value, set trend to true
if h == high
trend := true
// If the current low is the lowest value, set trend to false
if l == low
trend := false
Whenever the trend changes direction (from uptrend to downtrend or vice versa), the indicator provides visual cues in the form of arrows. This gives traders clear signals to identify potential trend reversals, enabling them to adjust their strategies accordingly.
⯌ Trend Level Calculation :
As soon as a trend is detected (uptrend or downtrend), the indicator starts calculating the highest, lowest, and mid-level values over the defined period. These levels are plotted on the chart as color-coded lines for easy visualization, allowing traders to quickly spot the key levels within a trend.
⯌ Midline Retests :
Throughout the trend, the mid-level line is often retested, acting as a potential zone for pullbacks or rejections. Traders can use these retests as opportunities for entering positions or confirming trend continuation. The chart shows how price frequently interacts with the midline, helping to identify important reaction levels.
⯌ Trend Strength Calculation :
The indicator measures the trend strength by calculating the delta between the number of candles closing above and below the midline. This percentage-based delta is displayed in real-time, providing a clear indication of whether the trend is gaining or losing momentum.
⯁ USER INPUTS
Length : Specifies the lookback period for calculating the highest and lowest values, which determines the key trend levels.
Candle Counting : Measures the number of candles closing above and below the midline to calculate the trend strength delta.
⯁ CONCLUSION
The Trend Levels indicator provides traders with a powerful tool for visualizing trend dynamics, key levels of support and resistance, and real-time trend strength. By identifying midline retests, tracking candle counts, and providing trend shift signals, this indicator can help traders make well-informed decisions during market trends.

Dynamic Score SMA [QuantAlgo]Dynamic Score SMA 📈🌊
The Dynamic Score SMA by QuantAlgo offers a powerful trend-following approach that combines the simplicity of the Simple Moving Average (SMA) with an innovative dynamic trend scoring technique . By continuously evaluating price movement relative to the SMA over a customizable window, this indicator adapts to varying market conditions, providing traders and investors with clearer, more adaptable trend signals. With this dynamic scoring approach, the Dynamic Score SMA helps identify trend shifts, allowing for more strategic decision-making.
🌟 Conceptual Foundation and Innovation
At the core of the Dynamic Score SMA is its dynamic trend score system , which assesses price movements by comparing them to the SMA over a series of historical data points. This technique goes beyond traditional SMA indicators by offering a dynamic, probabilistic evaluation of trend strength, delivering a more responsive and nuanced view of market direction. The integration of this scoring system enables traders and investors to navigate both trending and sideway markets with greater confidence and precision.
⚙️ Technical Composition and Calculation
The Dynamic Score SMA leverages the Simple Moving Average to establish a baseline trend, with customizable SMA length to control the indicator’s sensitivity. The dynamic trend scoring technique then evaluates price behavior relative to the SMA over a specified window, generating a trend score that reflects the current market bias.
When the score crosses the designated uptrend or downtrend thresholds, the indicator signals a potential trend shift. By adjusting the SMA length, window duration, and thresholds, users can refine the indicator’s responsiveness to match their preferred trading or investing strategy, making it suitable for both volatile and steady markets.
📈 Features and Practical Applications
Customizable SMA Length: Set the length of the SMA to control how sensitive the trend is to price changes. Longer lengths produce smoother trends, while shorter lengths increase responsiveness.
Window Length for Dynamic Scoring: Adjust the window length to determine how many data points are considered in the dynamic trend score calculation, allowing for more tailored analysis of recent versus long-term trends.
Uptrend/Downtrend Thresholds: Define thresholds for triggering trend signals. Higher thresholds reduce sensitivity, providing clearer signals in volatile markets, while lower thresholds capture shorter-term movements.
Bar and Background Coloring: Visual cues, including bar coloring and background fills, provide a quick reference for current trend direction, making it easier to monitor market conditions.
Trend Confirmation: The dynamic trend scoring system verifies trend strength, offering more reliable entry and exit points by filtering out potential false signals.
⚡️ How to Use
✅ Add the Indicator: Add the Dynamic Score SMA to your favourites, then apply it to your chart. Customize the SMA length, window size, and thresholds to match your trading or investing preferences.
👀 Monitor Trend Shifts: Observe the trend in relation to the SMA and watch for signals when the score crosses key thresholds. Bar and/or background coloring will help identify the current trend direction and any shifts in momentum.
🔔 Set Alerts: Configure alerts for significant trend crossovers and reversals, enabling you to act on market changes in real-time without needing constant chart observation.
💫 Summary and Usage Tips
The Dynamic Score SMA by QuantAlgo is a sophisticated trend-following indicator that combines the familiarity of the SMA with a dynamic trend scoring system, providing a more adaptable and probabilistic approach to trend analysis. By tailoring the SMA length, scoring window, and thresholds, traders and investors can fine-tune the indicator for both short-term adjustments and long-term trend following. For optimal use, adjust sensitivity based on market volatility, and rely on the visual cues for clear trend confirmation. Whether you’re navigating choppy markets or stable trends, the Dynamic Score SMA offers a refined approach to capturing market direction with enhanced precision.

Dynamic Score Supertrend [QuantAlgo]Dynamic Score Supertrend 📈🚀
The Dynamic Score Supertrend by QuantAlgo introduces a sophisticated trend-following tool that combines the well-known Supertrend indicator with an innovative dynamic trend scoring technique . By tracking market momentum through a scoring system that evaluates price behavior over a customizable window, this indicator adapts to changing market conditions. The result is a clearer, more adaptive tool that helps traders and investors detect and capitalize on trend shifts with greater precision.
💫 Conceptual Foundation and Innovation
At the core of the Dynamic Score Supertrend is the dynamic trend score system , which measures price movements relative to the Supertrend’s upper and lower bands. This scoring technique adds a layer of trend validation, assessing the strength of price trends over time. Unlike traditional Supertrend indicators that rely solely on ATR calculations, this system incorporates a scoring mechanism that provides more insight into trend direction, allowing traders and investors to navigate both trending and choppy markets with greater confidence.
✨ Technical Composition and Calculation
The Dynamic Score Supertrend utilizes the Average True Range (ATR) to calculate the upper and lower Supertrend bands. The dynamic trend scoring technique then compares the price to these bands over a customizable window, generating a trend score that reflects the current market direction.
When the score exceeds the uptrend or downtrend thresholds, it signals a possible shift in market direction. By adjusting the ATR settings and window length, the indicator becomes more adaptable to different market conditions, from steady trends to periods of higher volatility. This customization allows users to refine the Supertrend’s sensitivity and responsiveness based on their trading or investing style.
📈 Features and Practical Applications
Customizable ATR Settings: Adjust the ATR length and multiplier to control the sensitivity of the Supertrend bands. This allows the indicator to smooth out noise or react more quickly to price shifts, depending on market conditions.
Window Length for Dynamic Scoring: Modify the window length to adjust how many data points the scoring system considers, allowing you to tailor the indicator’s responsiveness to short-term or long-term trends.
Uptrend/Downtrend Thresholds: Set thresholds for identifying trend signals. Increase these thresholds for more reliable signals in choppy markets, or lower them for more aggressive entry points in trending markets.
Bar and Background Coloring: Visual cues such as bar coloring and background fills highlight the direction of the current trend, making it easier to spot potential reversals and trend shifts.
Trend Confirmation: The dynamic trend score system provides a clearer confirmation of trend strength, helping you identify strong, sustained movements while filtering out false signals.
⚡️ How to Use
✅ Add the Indicator: Add the Dynamic Score Supertrend to your favourites, then apply it to your chart. Adjust the ATR length, multiplier, and dynamic score settings to suit your trading or investing strategy.
👀 Monitor Trend Shifts: Track price movements relative to the Supertrend bands and use the dynamic trend score to confirm the strength of a trend. Bar and background colors make it easy to visualize key trend shifts.
🔔 Set Alerts: Configure alerts when the dynamic trend score crosses key thresholds, so you can act on significant trend changes without constantly monitoring the charts.
🌟 Summary and Usage Tips
The Dynamic Score Supertrend by QuantAlgo is a robust trend-following tool that combines the power of the Supertrend with an advanced dynamic scoring system. This approach provides more adaptable and reliable trend signals, helping traders and investors make informed decisions in trending markets. The customizable ATR settings and scoring thresholds make it versatile across various market conditions, allowing you to fine-tune the indicator for both short-term momentum and long-term trend following. To maximize its effectiveness, adjust the settings based on current market volatility and use the visual cues to confirm trend shifts. The Dynamic Score Supertrend offers a refined, probabilistic approach to trading and investing, making it a valuable addition to your toolkit.

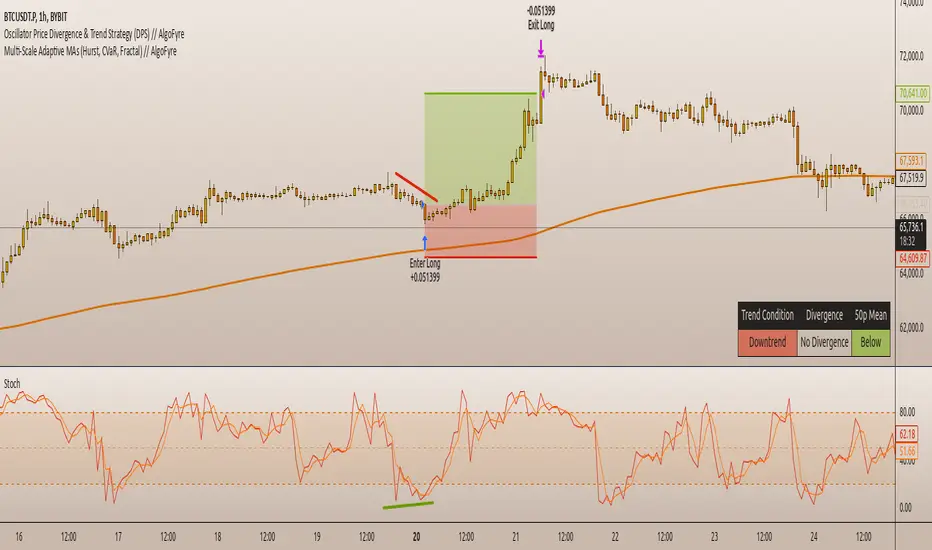
Oscillator Price Divergence & Trend Strategy (DPS) // AlgoFyreThe Oscillator Price Divergence & Trend Strategy (DPS) strategy combines price divergence and trend indicators for trend trading. It uses divergence conditions to identify entry points and a trend source for directional bias. The strategy incorporates risk management through dynamic position sizing based on a fixed risk amount. It allows for both long and short positions with customizable stop-loss and take-profit levels. The script includes visualization options for entry, stop-loss, and take-profit levels, enhancing trade analysis.
TABLE OF CONTENTS
🔶 ORIGINALITY
🔸Divergence-Trend Combination
🔸Dynamic Position Sizing
🔸Customizable Risk Management
🔶 FUNCTIONALITY
🔸Indicators
🞘 Trend Indicator
🞘 Oscillator Source
🔸Conditions
🞘 Long Entry
🞘 Short Entry
🞘 Take Profit
🞘 Stop Loss
🔶 INSTRUCTIONS
🔸Adding the Strategy to the Chart
🔸Configuring the Strategy
🔸Backtesting and Practice
🔸Market Awareness
🔸Visual Customization
🔶 CONCLUSION
▅▅▅▅▅▅▅▅▅▅▅▅▅▅▅▅▅▅▅▅▅▅▅▅▅▅▅▅▅▅▅▅▅▅▅▅▅▅▅▅▅▅▅▅▅
🔶 ORIGINALITY The Divergence Trend Trading with Dynamic Position Sizing strategy uniquely combines price divergence indicators with trend analysis to optimize entry and exit points. Unlike static trading strategies, it employs dynamic position sizing based on a fixed risk amount, ensuring consistent risk management. This approach allows traders to adapt to varying market conditions by adjusting position sizes according to predefined risk parameters, enhancing both flexibility and control in trading decisions. The strategy's integration of customizable stop-loss and take-profit levels further refines its risk management capabilities, making it a robust tool for both trending and volatile markets.
🔸Divergence-Trend Combination By combining trend direction with divergence conditions, the strategy enhances the accuracy of entry signals, aligning trades with prevailing market trends.
🔸Dynamic Position Sizing This strategy calculates position sizes dynamically, based on a fixed risk amount, allowing traders to maintain consistent risk exposure across trades.
🔸Customizable Risk Management Traders can set flexible risk-reward ratios and adjust stop-loss and take-profit levels, tailoring the strategy to their risk tolerance and market conditions.
🔶 FUNCTIONALITY The Divergence Trend Trading with Dynamic Position Sizing strategy leverages a combination of trend indicators and price and oscillator divergences to identify optimal trading opportunities. This strategy is designed to capitalize on medium to long-term price movements and works best on h1, h4 or D1 timeframes. It allows traders to manage risk effectively while taking advantage of both long and short positions.
🔸Indicators 🞘 Trend Indicator: A long trend is used to determine market direction, ensuring trades align with prevailing trends.
Recommendation: We recommend using the Adaptive MAs (Hurst, CVaR, Fractal) // AlgoFyre indicator with the following settings for trend detection. However, you can use any trend indicator that suits your trading style, e.g. an EMA 200.
🞘 Oscillator Source: The oscillator source is used for momentum price divergence identification. Any momentum oscillator can be used, e.g. RSI, Stochastic etc. A good oscillator is the Stochastic with the following settings:
🔸Conditions 🞘 Long Entry: A long entry condition is met if price closes above the trend AND selected divergence conditions are met, e.g. regular bullish divergence with a 10 bar lookback period with the divergence being below the 50 point mean. If the info table shows all 3 columns in the same color, the entry conditions are met and a position is opened.
🞘 Short Entry: A short entry condition is met if price closes below the trend AND selected divergence conditions are met, e.g. regular bearish divergence with a 10 bar lookback period with the divergence being above the 50 point mean.
🞘 Take Profit: Take Profit is determined by the Risk to Reward Ratio settings depending on the price distance between the entry price and the stop loss price, e.g. if stop loss is 1% away from entry and Risk Reward Ratio is 3:1 then Take Profit will be set at 3% from entry.
🞘 Stop Loss: Stop loss is a fixed level away from the trend source. For long positions, stop loss is set below the trend, and for short positions, above the trend.
🔶 INSTRUCTIONS The Divergence Trend Trading with Dynamic Position Sizing strategy can be set up by adding it to your TradingView chart and configuring parameters such as the oscillator source, trend source, and risk management settings. This strategy is designed to capitalize on short-term price movements by dynamically adjusting position sizes based on predefined risk parameters. Enhance the accuracy of signals by combining this strategy with additional indicators like trend-following or momentum-based tools. Adjust settings to better manage risk and optimize entry and exit points.
🔸Adding the Strategy to the Chart:
Go to your TradingView chart.
Click on the "Indicators" button at the top.
Search for "Divergence Trend Trading with Dynamic Position Sizing // AlgoFyre" in the indicators list.
Click on the strategy to add it to your chart.
🔸Configuring the Strategy:
Open the strategy settings by clicking on the gear icon next to its name on the chart.
Oscillator Source: Select the source for the oscillator. An oscillator like Stochastic needs to be attached to the chart already in order to be used as an oscillator source to be selectable.
Trend Source: Choose the trend source to determine market direction. A trend indicator like Adaptive MAs (Hurst, CVaR, Fractal) // AlgoFyre needs to be attached to the chart already in order to be used as a trend source to be selectable.
Stop Loss Percentage: Set the stop loss distance from the trend source as a percentage.
Risk/Reward Ratio: Define the desired risk/reward ratio for trades.
🔸Backtesting and Practice:
Backtest the strategy on historical data to understand how it performs in various market environments.
Practice using the strategy on a demo account before implementing it in live trading.
🔸Market Awareness:
Keep an eye on market news and events that might cause extreme price movements. The strategy reacts to price data and might not account for news-driven events that can cause large deviations.
🔸Visual Customization Visualization Settings: Customize the display of entry price, take profit, and stop loss levels.
Color Settings: Switch to the AlgoFyre theme or set custom colors for bullish, bearish, and neutral states.
Table Settings: Enable or disable the information table and adjust its position.
🔶 CONCLUSION
The Divergence Trend Trading with Dynamic Position Sizing strategy provides a robust framework for capitalizing on short-term market trends by combining price divergence with dynamic position sizing. This strategy leverages divergence conditions to identify entry points and utilizes a trend source for directional bias, ensuring trades align with prevailing market conditions. By incorporating dynamic position sizing based on a fixed risk amount, traders can effectively manage risk and adapt to varying market conditions. The strategy's customizable stop-loss and take-profit levels further enhance its risk management capabilities, making it a versatile tool for both trending and volatile markets. With its strategic blend of technical indicators and risk management, the Divergence Trend Trading strategy offers traders a comprehensive approach to optimizing trade execution and maximizing potential returns.
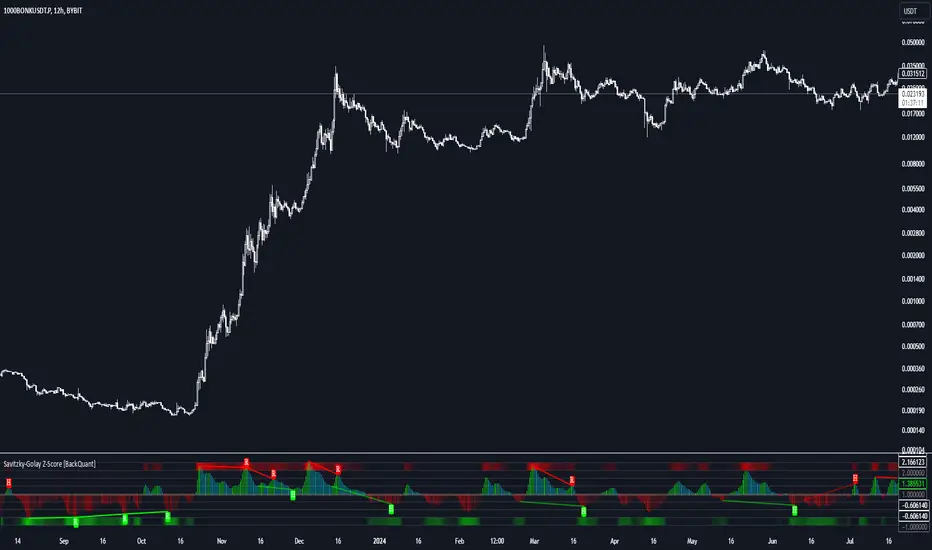
Savitzky-Golay Z-Score [BackQuant]Savitzky-Golay Z-Score
The Savitzky-Golay Z-Score is a powerful trading indicator that combines the precision of the Savitzky-Golay filter with the statistical strength of the Z-Score. This advanced indicator is designed to detect trend shifts, identify overbought or oversold conditions, and highlight potential divergences in the market, providing traders with a unique edge in detecting momentum changes and trend reversals.
Core Concept: Savitzky-Golay Filter
The Savitzky-Golay filter is a widely-used smoothing technique that preserves important signal features such as peak detection while filtering out noise. In this indicator, the filter is applied to price data (default set to HLC3) to smooth out volatility and produce a cleaner trend line. By specifying the window size and polynomial degree, traders can fine-tune the degree of smoothing to match their preferred trading style or market conditions.
Z-Score: Measuring Deviation
The Z-Score is a statistical measure that indicates how far the current price is from its mean in terms of standard deviations. In trading, the Z-Score can be used to identify extreme price moves that are likely to revert or continue trending. A positive Z-Score means the price is above the mean, while a negative Z-Score indicates the price is below the mean.
This script calculates the Z-Score based on the Savitzky-Golay filtered price, enabling traders to detect moments when the price is diverging from its typical range and may present an opportunity for a trade.
Long and Short Conditions
The Savitzky-Golay Z-Score generates clear long and short signals based on the Z-Score value:
Long Signals : When the Z-Score is positive, indicating the price is above its smoothed mean, a long signal is generated. The color of the bars turns green, signaling upward momentum.
Short Signals : When the Z-Score is negative, indicating the price is below its smoothed mean, a short signal is generated. The bars turn red, signaling downward momentum.
These signals allow traders to follow the prevailing trend with confidence, using statistical backing to avoid false signals from short-term volatility.
Standard Deviation Levels and Extreme Levels
This indicator includes several features to help visualize overbought and oversold conditions:
Standard Deviation Levels: The script plots horizontal lines at +1, +2, -1, and -2 standard deviations. These levels provide a reference for how far the current price is from the mean, allowing traders to quickly identify when the price is moving into extreme territory.
Extreme Levels: Additional extreme levels at +3 and +4 (and their negative counterparts) are plotted to highlight areas where the price is highly likely to revert. These extreme levels provide important insight into market conditions that are far outside the norm, signaling caution or potential reversal zones.
The indicator also adapts the color shading of these extreme zones based on the Z-Score’s strength. For example, the area between +3 and +4 is shaded with a stronger color when the Z-Score approaches these values, giving a visual representation of market pressure.
Divergences: Detecting Hidden and Regular Signals
A key feature of the Savitzky-Golay Z-Score is its ability to detect bullish and bearish divergences, both regular and hidden:
Regular Bullish Divergence: This occurs when the price makes a lower low while the Z-Score forms a higher low. It signals that bearish momentum is weakening, and a bullish reversal could be near.
Hidden Bullish Divergence: This divergence occurs when the price makes a higher low while the Z-Score forms a lower low. It signals that bullish momentum may continue after a temporary pullback.
Regular Bearish Divergence: This occurs when the price makes a higher high while the Z-Score forms a lower high, signaling that bullish momentum is weakening and a bearish reversal may be near.
Hidden Bearish Divergence: This divergence occurs when the price makes a lower high while the Z-Score forms a higher high, indicating that bearish momentum may continue after a temporary rally.
These divergences are plotted directly on the chart, making it easier for traders to spot when the price and momentum are out of sync and when a potential reversal may occur.
Customization and Visualization
The Savitzky-Golay Z-Score offers a range of customization options to fit different trading styles:
Window Size and Polynomial Degree: Adjust the window size and polynomial degree of the Savitzky-Golay filter to control how much smoothing is applied to the price data.
Z-Score Lookback Period: Set the lookback period for calculating the Z-Score, allowing traders to fine-tune the sensitivity to short-term or long-term price movements.
Display Options: Choose whether to display standard deviation levels, extreme levels, and divergence labels on the chart.
Bar Color: Color the price bars based on trend direction, with green for bullish trends and red for bearish trends, allowing traders to easily visualize the current momentum.
Divergences: Enable or disable divergence detection, and adjust the lookback periods for pivots used to detect regular and hidden divergences.
Alerts and Automation
To ensure you never miss an important signal, the indicator includes built-in alert conditions for the following events:
Positive Z-Score (Long Signal): Triggers an alert when the Z-Score crosses above zero, indicating a potential buying opportunity.
Negative Z-Score (Short Signal): Triggers an alert when the Z-Score crosses below zero, signaling a potential short opportunity.
Shifting Momentum: Alerts when the Z-Score is shifting up or down, providing early warning of changing market conditions.
These alerts can be configured to notify you via email, SMS, or app notification, allowing you to stay on top of the market without having to constantly monitor the chart.
Trading Applications
The Savitzky-Golay Z-Score is a versatile tool that can be applied across multiple trading strategies:
Trend Following: By smoothing the price and calculating the Z-Score, this indicator helps traders follow the prevailing trend while avoiding false signals from short-term volatility.
Mean Reversion: The Z-Score highlights moments when the price is far from its mean, helping traders identify overbought or oversold conditions and capitalize on potential reversals.
Divergence Trading: Regular and hidden divergences between the Z-Score and price provide early warning of trend reversals, allowing traders to enter trades at opportune moments.
Final Thoughts
The Savitzky-Golay Z-Score is an advanced statistical tool designed to provide a clearer view of market trends and momentum. By applying the Savitzky-Golay filter and Z-Score analysis, this indicator reduces noise and highlights key areas where the market may reverse or accelerate, giving traders a significant edge in understanding price behavior.
Whether you’re a trend follower or a reversal trader, this indicator offers the flexibility and insights you need to navigate complex markets with confidence.
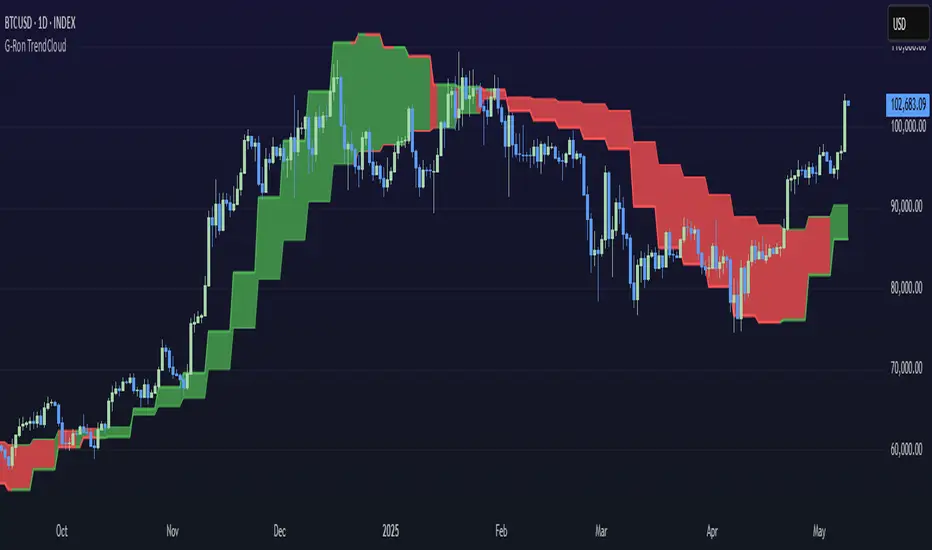
G-Ron TrendCloudOverview
The G-Ron TrendCloud Indicator is a powerful trading tool designed to identify trend momentum and potential reversals across multiple timeframes. Using cloud-based visualizations, this indicator provides clear, actionable signals, making it ideal for all traders.
How Does It Work?
The G-Ron TrendCloud uses advanced differential calculations to pinpoint key momentum levels in the market. It identifies both trend continuation and reversals, highlighting strong momentum shifts with clear visual cues.
Key Features
Trend Cloud – This cloud highlights the dominant market trend, indicating whether the market is trending upwards or downwards.
Reversal Cloud – This cloud provides early warning signals of potential trend reversals, helping traders time entries and exits more effectively.
Trend Reversion Line – This line acts as a key pivot point in the market, indicating where the long-term trend is likely to shift.
The three components change color dynamically based on market conditions:
Yellow for uptrends
Red for downtrends
What Makes It Unique?
Many indicators rely on simple or exponential moving average crossovers. In contrast, the G-Ron TrendCloud utilizes differential equations to analyze the interaction between moving averages and pinpoint the precise price levels where significant momentum shifts—referred to as trend pivots—are likely to occur. These trend pivots are categorized by both term (short, medium, long) and direction (continuation or reversal). It's crucial to note that the components of the G-Ron TrendCloud are not moving averages, making it impossible to replicate its insights using any SMA or EMA settings.
Understanding The Components
Trend Cloud: represents the area between the short-term trend pivot line and the medium-term trend pivot line. It illustrates the prevailing market trend.
Reversal Cloud: represents the area between the medium-term trend pivot line and the reversal pivot line. It provides insights into the strength of the trend.
Trend Reversion Line: the long-term trend pivot line which acts as a mean reversion for the Trend Cloud.
How To Use It
Trend Continuation: When price is above or within the yellow Trend Cloud it signals a strong bullish trend continuation. When price is below or within the red Trend Cloud it signals a strong bearish trend continuation.
Reversal Signals: When price breaks through the Reversal Cloud it signals a change in the prevailing market trend.
Long-Term Confirmation: Bullish trends are stronger, and price is more likely to continue higher when the Trend Reversion Line is yellow. Bearish trends are stronger, and price is more likely to continue lower when the Trend Reversion Line is red.
Multi-Timeframe View: For deeper insights, use the indicator across various timeframes. Shorter timeframes are ideal for intraday trades, while longer timeframes offer better signals for position traders.
Recommended Settings
The Long-Term Timeframe interval setting should always be at least three times bigger than the current timeframe displayed on your chart.
Why It’s Invite Only
The G-Ron TrendCloud utilizes a unique methodology that cannot be replicated by standard indicators. It provides valuable insights and clear visual cues to help traders accurately identify market trends. It greatly improves decision making and timing for both trade entries and exits, increasing the likelihood of successful outcomes.
Please see the authors instructions below to get instant access to this indicator.