Luxy Adaptive MA Cloud - Trend Strength & Signal Tracker V2Luxy Adaptive MA Cloud - Professional Trend Strength & Signal Tracker
Next-generation moving average cloud indicator combining ultra-smooth gradient visualization with intelligent momentum detection. Built for traders who demand clarity, precision, and actionable insights.
═══════════════════════════════════════════════
WHAT MAKES THIS INDICATOR SPECIAL?
═══════════════════════════════════════════════
Unlike traditional MA indicators that show static lines, Luxy Adaptive MA Cloud creates a living, breathing visualization of market momentum. Here's what sets it apart:
Exponential Gradient Technology
This isn't just a simple fill between two lines. It's a professionally engineered gradient system with 26 precision layers using exponential density distribution. The result? An organic, cloud-like appearance where the center is dramatically darker (15% transparency - where crossovers and price action occur), while edges fade gracefully (75% transparency). Think of it as a visual "heat map" of trend strength.
Dynamic Momentum Intelligence
Most MA clouds only show structure (which MA is on top). This indicator shows momentum strength in real-time through four intelligent states:
- 🟢 Bright Green = Explosive bullish momentum (both MAs rising strongly)
- 🔵 Blue = Weakening bullish (structure intact, but momentum fading)
- 🟠 Orange = Caution zone (bearish structure forming, weak momentum)
- 🔴 Deep Red = Strong bearish momentum (both MAs falling)
The cloud literally tells you when trends are accelerating or losing steam.
Conditional Performance Architecture
Every calculation is optimized for speed. Disable a feature? It stops calculating entirely—not just hidden, but not computed . The 26-layer gradient only renders when enabled. Toggle signals off? Those crossover checks don't run. This makes it one of the most efficient cloud indicators available, even with its advanced visual system.
Zero Repaint Guarantee
All signals and momentum states are based on confirmed bar data only . What you see in historical data is exactly what you would have seen trading live. No lookahead bias. No repainting tricks. No signals that "magically" appear perfect in hindsight. If a signal shows in history, it would have triggered in real-time at that exact moment.
Educational by Design
Every single input includes comprehensive tooltips with:
- Clear explanations of what each parameter does
- Practical examples of when to use different settings
- Recommended configurations for scalping, day trading, and swing trading
- Real-world trading impact ("This affects entry timing" vs "This is visual only")
You're not just getting an indicator—you're learning how to use it effectively .
═══════════════════════════════════════════════
THE GRADIENT CLOUD - TECHNICAL DETAILS
═══════════════════════════════════════════════
Architecture:
26 precision layers for silk-smooth transitions
Exponential density curve - layers packed tightly near center (where crossovers happen), spread wider at edges
75%-15% transparency range - center is highly opaque (15%), edges fade gracefully (75%)
V-Gradient design - emphasizes the action zone between Fast and Medium MAs
The Four Momentum States:
🟢 GREEN - Strong Bullish
Fast MA above Medium MA
Both MAs rising with momentum > 0.02%
Action: Enter/hold LONG positions, strong uptrend confirmed
🔵 BLUE - Weak Bullish
Fast MA above Medium MA
Weak or flat momentum
Action: Caution - bullish structure but losing strength, consider trailing stops
🟠 ORANGE - Weak Bearish
Medium MA above Fast MA
Weak or flat momentum
Action: Warning - bearish structure developing, consider exits
🔴 RED - Strong Bearish
Medium MA above Fast MA
Both MAs falling with momentum < -0.02%
Action: Enter/hold SHORT positions, strong downtrend confirmed
Smooth Transitions: The momentum score is smoothed using an 8-bar EMA to eliminate noise and prevent whipsaws. You see the true trend , not every minor fluctuation.
═══════════════════════════════════════════════
FLEXIBLE MOVING AVERAGE SYSTEM
═══════════════════════════════════════════════
Three Customizable MAs:
Fast MA (default: EMA 10) - Reacts quickly to price changes, defines short-term momentum
Medium MA (default: EMA 20) - Balances responsiveness with stability, core trend reference
Slow MA (default: SMA 200, optional) - Long-term trend filter, major support/resistance
Six MA Types Available:
EMA - Exponential; faster response, ideal for momentum and day trading
SMA - Simple; smooth and stable, best for swing trading and trend following
WMA - Weighted; middle ground between EMA and SMA
VWMA - Volume-weighted; reflects market participation, useful for liquid markets
RMA - Wilder's smoothing; used in RSI/ADX, excellent for trend filters
HMA - Hull; extremely responsive with minimal lag, aggressive option
Recommended Settings by Trading Style:
Scalping (1m-5m):
Fast: EMA(5-8)
Medium: EMA(10-15)
Slow: Not needed or EMA(50)
Day Trading (5m-1h):
Fast: EMA(10-12)
Medium: EMA(20-21)
Slow: SMA(200) for bias
Swing Trading (4h-1D):
Fast: EMA(10-20)
Medium: EMA(34-50)
Slow: SMA(200)
Pro Tip: Start with Fast < Medium < Slow lengths. The gradient works best when there's clear separation between Fast and Medium MAs.
═══════════════════════════════════════════════
CROSSOVER SIGNALS - CLEAN & RELIABLE
═══════════════════════════════════════════════
Golden Cross ⬆ LONG Signal
Fast MA crosses above Medium MA
Classic bullish reversal or trend continuation signal
Most reliable when accompanied by GREEN cloud (strong momentum)
Death Cross ⬇ SHORT Signal
Fast MA crosses below Medium MA
Classic bearish reversal or trend continuation signal
Most reliable when accompanied by RED cloud (strong momentum)
Signal Intelligence:
Anti-spam filter - Minimum 5 bars between signals prevents noise
Clean labels - Placed precisely at crossover points
Alert-ready - Built-in ALERTS for automated trading systems
No repainting - Signals based on confirmed bars only
Signal Quality Assessment:
High-Quality Entry:
Golden Cross + GREEN cloud + Price above both MAs
= Strong bullish setup ✓
Low-Quality Entry (skip or wait):
Golden Cross + ORANGE cloud + Choppy price action
= Weak bullish setup, likely whipsaw ✗
═══════════════════════════════════════════════
REAL-TIME INFO PANEL
═══════════════════════════════════════════════
An at-a-glance dashboard showing:
Trend Strength Indicator:
Visual display of current momentum state
Color-coded header matching cloud color
Instant recognition of market bias
MA Distance Table:
Shows percentage distance of price from each enabled MA:
Green rows : Price ABOVE MA (bullish)
Red rows : Price BELOW MA (bearish)
Gray rows : Price AT MA (rare, decision point)
Distance Interpretation:
+2% to +5%: Healthy uptrend
+5% to +10%: Getting extended, caution
+10%+: Overextended, expect pullback
-2% to -5%: Testing support
-5% to -10%: Oversold zone
-10%+: Deep correction or downtrend
Customization:
4 corner positions
5 font sizes (Tiny to Huge)
Toggle visibility on/off
═══════════════════════════════════════════════
HOW TO USE - PRACTICAL TRADING GUIDE
═══════════════════════════════════════════════
STRATEGY 1: Trend Following
Identify trend : Wait for GREEN (bullish) or RED (bearish) cloud
Enter on signal : Golden Cross in GREEN cloud = LONG, Death Cross in RED cloud = SHORT
Hold position : While cloud maintains color
Exit signals :
• Cloud turns ORANGE/BLUE = momentum weakening, tighten stops
• Opposite crossover = close position
• Cloud turns opposite color = full reversal
STRATEGY 2: Pullback Entries
Confirm trend : GREEN cloud established (bullish bias)
Wait for pullback : Price touches or crosses below Fast MA
Enter when : Price rebounds back above Fast MA with cloud still GREEN
Stop loss : Below Medium MA or recent swing low
Target : Previous high or when cloud weakens
STRATEGY 3: Momentum Confirmation
Your setup triggers : (e.g., chart pattern, support/resistance)
Check cloud color :
• GREEN = proceed with LONG
• RED = proceed with SHORT
• BLUE/ORANGE = skip or reduce size
Use gradient as confluence : Not as primary signal, but as momentum filter
Risk Management Tips:
Never enter against the cloud color (don't LONG in RED cloud)
Reduce position size during BLUE/ORANGE (transition periods)
Place stops beyond Medium MA for swing trades
Use Slow MA (200) as final trend filter - don't SHORT above it in uptrends
═══════════════════════════════════════════════
PERFORMANCE & OPTIMIZATION
═══════════════════════════════════════════════
Tested On:
Crypto: BTC, ETH, major altcoins
Stocks: SPY, AAPL, TSLA, QQQ
Forex: EUR/USD, GBP/USD, USD/JPY
Indices: S&P 500, NASDAQ, DJI
═══════════════════════════════════════════════
TRANSPARENCY & RELIABILITY
═══════════════════════════════════════════════
Educational Focus:
Detailed tooltips on every input
Clear documentation of methodology
Practical examples in descriptions
Teaches you why , not just what
Open Logic:
Momentum calculation: (Fast slope + Medium slope) / 2
Smoothing: 8-bar EMA to reduce noise
Thresholds: ±0.02% for strong momentum classification
Everything is transparent and explainable
═══════════════════════════════════════════════
COMPLETE FEATURE LIST
═══════════════════════════════════════════════
Visual Components:
26-layer exponential gradient cloud
3 customizable moving average lines
Golden Cross / Death Cross labels
Real-time info panel with trend strength
MA distance table
Calculation Features:
6 MA types (EMA, SMA, WMA, VWMA, RMA, HMA)
Momentum-based cloud coloring
Smoothed trend strength scoring
Conditional performance optimization
Customization Options:
All MA lengths adjustable
All colors customizable (when gradient disabled)
Panel position (4 corners)
Font sizes (5 options)
Toggle any feature on/off
Signal Features:
Anti-spam filter (configurable gap)
Clean, non-overlapping labels
Built-in alert conditions
No repainting guarantee
═══════════════════════════════════════════════
IMPORTANT DISCLAIMERS
═══════════════════════════════════════════════
This indicator is for educational and informational purposes only
Not financial advice - always do your own research
Past performance does not guarantee future results
Use proper risk management - never risk more than you can afford to lose
Test on paper/demo accounts before using with real money
Combine with other analysis methods - no single indicator is perfect
Works best in trending markets; less effective in choppy/sideways conditions
Signals may perform differently in different timeframes and market conditions
The indicator uses historical data for MA calculations - allow sufficient lookback period
═══════════════════════════════════════════════
CREDITS & TECHNICAL INFO
═══════════════════════════════════════════════
Version: 2.0
Release: October 2025
Special Thanks:
TradingView community for feedback and testing
Pine Script documentation for technical reference
═══════════════════════════════════════════════
SUPPORT & UPDATES
═══════════════════════════════════════════════
Found a bug? Comment below with:
Ticker symbol
Timeframe
Screenshot if possible
Steps to reproduce
Feature requests? I'm always looking to improve! Share your ideas in the comments.
Questions? Check the tooltips first (hover over any input) - most answers are there. If still stuck, ask in comments.
═══════════════════════════════════════════════
Happy Trading!
Remember: The best indicator is the one you understand and use consistently. Take time to learn how the cloud behaves in different market conditions. Practice on paper before going live. Trade smart, manage risk, and may the trends be with you! 🚀
Trend

SuperTrend MAAfter building SuperBands, I kept thinking about what happens at the midpoint between those two volatility-adaptive envelopes. The upper and lower bands are both trailing price based on ATR and EMA smoothing, but they're operating independently in opposite directions. Taking their average seemed like it might produce an interesting centerline that adapts to volatility in a way that regular moving averages don't. Turns out it does, and that's what this indicator is.
The core concept is straightforward. Instead of plotting the upper and lower SuperBands separately, this calculates both of them internally, averages their values, and then applies an additional smoothing pass with EMA to create a single centerline. That centerline sits roughly in the middle of where the bands would be, but because it's derived from ATR-offset trailing stops rather than direct price smoothing, it behaves differently than a standard moving average of the same length. During trending periods, the centerline tracks closer to price because one of the underlying bands is actively trailing while the other is dormant. During consolidation, both bands compress toward price and the centerline tends to oscillate more with shorter-term movements.
What's interesting is that this acts like a supertrend all by itself with directional behavior baked in. When one of the underlying supertrend waves dominates, meaning price is strongly trending in one direction and only one band is active, you get what feels like a "true" supertrend, whatever that means exactly. The centerline locks into trend-following mode and the color gradient reflects that commitment. You get bright bullish colors during sustained uptrends when the upper band is doing all the work, and strong bearish colors during downtrends when the lower band dominates. But when both bands are active and fighting for control, which happens during consolidation or choppy conditions, the centerline settles into more neutral tones that clearly signal you're in a ranging environment. The colors really do emphasize this behavior and make it visually obvious which regime you're in.
The smoothing parameter controls how aggressively the underlying SuperBand trails adapt to price, which indirectly affects how responsive the centerline is. Lower values make the bands tighter and more reactive, so the centerline follows price action more closely. Higher values create wider bands that only respond to sustained moves, which produces a smoother centerline that filters out more noise. The center smoothing parameter applies a second EMA pass specifically to the averaged midpoint, giving you independent control over how much additional lag you want on the final output versus the raw band average.
What makes this different from just slapping an EMA on price is that the underlying bands are already volatility-aware through their ATR calculations. When volatility spikes, the bands widen and the centerline adjusts its position relative to price based on where those bands settle. A traditional moving average would just smooth over the volatility spike without adjusting its distance from price. This approach incorporates volatility information into the centerline's positioning, which can help it stay relevant during regime changes where fixed-period moving averages tend to lag badly or whipsaw.
The color gradient adds a momentum overlay using the same angle-based calculation from SuperBands. The centerline's rate of change gets normalized by an RMS estimate of its historical movement range, converted to an angle through arctangent scaling, and then mapped to a color gradient. When the centerline is rising, it gradients from neutral toward your chosen bullish color, with brightness increasing as the rate of ascent steepens. When falling, it shifts toward the bearish color with intensity tied to the descent rate. This gives you an immediate visual sense of whether the centerline is accelerating, decelerating, or moving at a stable pace.
Configuration is simpler than SuperBands since you're only dealing with a single output line instead of separate bull and bear envelopes. The length parameter controls the underlying band behavior. ATR period and multiplier determine how much space the bands allocate around price before they trail. Center smoothing adds the extra EMA pass on the averaged midpoint. You can tune these independently to get different characteristics. A tight ATR multiplier with heavy center smoothing creates a smooth line that stays close to price. A wide multiplier with light center smoothing produces a line that swings more freely and adapts faster to directional changes.
From a practical standpoint, this works well as a trend filter or dynamic support and resistance reference. Price above the centerline with bullish coloring suggests a favorable environment for long positions. Price below with bearish coloring indicates the opposite. Crossovers can signal trend changes, though like any moving average system, you'll get whipsaws in choppy conditions. The advantage over traditional MAs is that the volatility adaptation tends to reduce false signals during transitional periods where volatility is expanding but direction hasn't fully committed.
The implementation reuses the entire SuperBands logic, which means all the smoothing and state management for the trailing stops is identical. The only addition is averaging the two band outputs and applying the final EMA pass. The color calculation follows the same RMS-normalized angle approach but applies it to the centerline's delta rather than the individual band deltas. This keeps the coloring consistent with how SuperBands handles momentum visualization while adapting it to a single line instead of dual envelopes.
What this really highlights is that you can derive moving averages from mechanisms other than direct price smoothing. By building the centerline from volatility-adjusted trailing stops, you get adaptive behavior that responds to both price movement and volatility regime without needing separate inputs or complex multi-stage calculations. Whether that adaptation provides a meaningful edge depends on your strategy and market, but it's a fundamentally different approach than the typical fixed-period or adaptive MAs that adjust length based on volatility or momentum indicators.

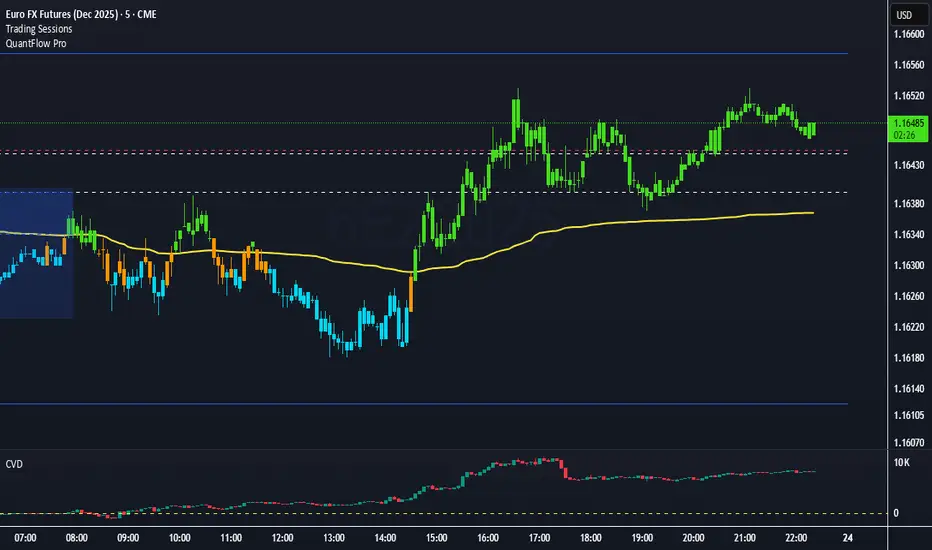
QuantFlow ProQuantFlow Pro
QuantFlow Pro is an advanced institutional indicator designed to detect bias shifts, liquidity imbalances, and real-time flow transitions.
Built on an adaptive architecture, it combines institutional flow analysis, multi-timeframe liquidity levels, and structural reference points to provide a clear and precise view of market dynamics.
Unlike conventional indicators that repaint or produce noisy signals, QuantFlow Pro relies on robust calculations based on volume, delta imbalance, and the detection of structural dislocations.
⚙️ Optimized for Futures markets, QuantFlow Pro helps traders identify market turning points with institutional precision and consistent reliability over time.
Volume Biased CandlesVolume Biased Candles
This indicator visualizes the underlying volume polarity of price action by coloring candles based on directional volume bias over a rolling bucket of bars.
Instead of reading price alone, each candle reflects whether buying or selling pressure has dominated within its recent volume structure — giving a more intuitive picture of volume sentiment beneath price movement.
🔹 How it works
Bucket Size (n) → defines how many candles are aggregated to evaluate directional volume bias
For each bucket, total up-volume and down-volume are compared to determine overall market pressure
Volume Bias Score → a continuous ratio from -1 to +1, representing the relative dominance of buyers or sellers
Candles are colored according to the active bias — green for positive (buying), red for negative (selling)
🔹 Use cases
Visualize shifts in market control without needing divergence overlays
Combine with delta divergence or price structure tools to validate entries and exits
Simplify volume and price insights into an intuitive, single-chart visualization
✨ Volume Biased Candles transforms standard candles into a live sentiment gauge, revealing whether the dominant flow behind price movement is bullish or bearish.

AlphaMACD - Adaptive MACD with Efficiency RatioOVERVIEW
AlphaMACD is an adaptive implementation of the classic MACD indicator that dynamically adjusts its calculation periods based on market efficiency. Unlike traditional MACD which uses fixed periods (typically 12, 26, 9), this indicator adapts its fast and slow EMA periods in real-time based on how efficiently the market is trending.
WHAT MAKES THIS ORIGINAL
This is not a simple MACD with different settings or colors. The core innovation is the adaptive period calculation using Kaufman's Efficiency Ratio, which was originally developed for the Adaptive Moving Average (AMA). This indicator applies that adaptive logic to MACD itself.
Key Differences from Standard MACD:
- Periods dynamically adjust between user-defined ranges (default: 8-21 for fast, 21-55 for slow)
- Uses Kaufman's Efficiency Ratio to measure market trendiness
- Implements gap protection to prevent extreme spikes from market gaps
- Includes market regime detection to filter signals in choppy conditions
- Provides multi-timeframe trend confirmation
HOW IT WORKS
1. Efficiency Ratio Calculation:
The indicator calculates market efficiency by comparing the absolute price change over a period to the sum of absolute price changes within that period. High efficiency = strong trending market. Low efficiency = choppy/sideways market.
2. Adaptive Period Adjustment:
- In trending markets (high efficiency): Periods move toward the minimum values for faster response
- In choppy markets (low efficiency): Periods move toward the maximum values for slower, more stable signals
- The "Sensitivity" parameter controls how aggressively periods adapt (0.5 to 5.0)
3. Gap Protection:
The custom adaptive EMA function detects abnormal price gaps (moves larger than 3x the typical ATR-based change) and limits their impact on the calculation. This prevents weekends or news gaps from causing extreme MACD spikes.
4. Signal Quality Filtering:
- Market regime detection identifies trending vs sideways conditions
- Momentum filter (RSI-based) prevents signals during overextended moves
- Signal strength calculation helps identify high-confidence setups
- Sideways market signals are marked with warning symbols
5. Multi-Timeframe Analysis:
The indicator compares current timeframe MACD with a higher timeframe (default 60 min) to provide context and filter against-trend signals.
HOW TO USE IT
Settings:
- Core Settings: Define the minimum and maximum periods for fast/slow EMAs
- Sensitivity: Higher values make the indicator more responsive to market changes
- Multi-timeframe: Set a higher timeframe for trend confirmation
- Visual options: Customize appearance and enable/disable features
Signal Interpretation:
- Strong bullish/bearish signals (large triangles): High-confidence entries in trending markets
- Warning signals (small ⚠): Crossovers in sideways markets - use caution or skip
- Divergence labels ("DIV"): Price and MACD diverging - potential reversal
- Background color: Green tint = trending market, Orange tint = sideways market
The Information Table shows:
- Current market regime (trending or sideways)
- Market efficiency percentage (how clean the trend is)
- Current adaptive fast and slow periods
- Higher timeframe trend direction
- Current signal strength
Best Practices:
- In trending markets: Trust strong signals, avoid warning signals
- In sideways markets: Reduce position sizes or skip trades entirely
- Use higher timeframe confirmation for better signal quality
- Adjust sensitivity based on your trading timeframe (higher for intraday, lower for swing)
TECHNICAL DETAILS
Calculation Method:
- Efficiency Ratio = ABS(Close - Close ) / SUM(ABS(Close - Close ), Period)
- Smoothed Efficiency = EMA(Efficiency Ratio, 5)
- Fast Period = Fast_Min + (Fast_Max - Fast_Min) × (1 - Smoothed_Efficiency × Sensitivity)
- Slow Period = Slow_Min + (Slow_Max - Slow_Min) × (1 - Smoothed_Efficiency × Sensitivity)
- Adaptive EMA uses standard EMA formula with gap detection and limiting
- MACD = Fast Adaptive EMA - Slow Adaptive EMA
- Signal = EMA(MACD, Signal Period)
- Histogram = MACD - Signal
The adaptive periods are calculated on every bar, so the MACD responds faster in trending conditions and stabilizes during consolidation.
WHAT THIS SOLVES
Standard MACD Problems:
- Fixed periods don't adapt to changing market conditions
- Too many false signals in sideways markets
- Whipsaws during low-volatility consolidation
- Price gaps can cause misleading spikes
AlphaMACD Solutions:
- Periods automatically adjust to market state
- Market regime filter identifies and warns about sideways conditions
- Adaptive smoothing reduces whipsaws
- Gap protection prevents false extremes
LIMITATIONS
- Like all indicators, this does not predict the future
- Requires trending markets for optimal performance
- Adaptive calculation means backtesting results will differ from fixed-period MACD
- More complex than standard MACD - requires understanding of adaptive concepts
- The adaptive periods mean you cannot directly compare this to traditional MACD studies
This indicator is best used as part of a complete trading system, not as a standalone signal generator.
EDUCATIONAL VALUE
For traders learning about:
- Adaptive indicators and market efficiency concepts
- Kaufman's Adaptive Moving Average principles applied to oscillators
- Market regime detection and signal filtering
- Gap handling in technical indicators
- Multi-timeframe analysis integration
Not Financial advice.

TREND (Type II) | Hamster-CoderTREND (Type II) — Smart Trend Reversal Indicator Based on RCI & MACD
TREND (Type II) is a powerful tool for traders who want to spot not just where the market is now, but where it might be heading next.
It combines the analytical strength of RSI and MACD to identify potential trend reversal points before they become obvious on the chart.
🚀 Key Advantages
Early trend detection. TREND can anticipate possible reversals even before the actual crossover occurs.
Flexible visualization. Displayed in a separate panel while showing buy/sell signals directly on the main chart.
Multi-timeframe support. Analyze signals from higher or lower timeframes without switching charts.
Intuitive color background. The background automatically turns red during bearish conditions for instant market sentiment recognition.
🎯 Signal Types
Primary Signal. When RCI and MACD lines actually cross, confirming a trend shift.
Preliminary Signal. When a crossover is projected to occur on the next bar.
Overheat Signal. When the market reaches a defined threshold (e.g. ±90) and starts showing signs of cooling down.
🧠 Unique Features
Extra Filters (experimental). Filters out weak or false signals, showing only those confirmed by additional criteria.
RCI–MACD Difference Mode. Visualize the distance between RCI and MACD as a histogram to assess divergence strength.
Custom Thresholds. Define your own overbought/oversold zones to fine-tune signal sensitivity.
🔍 Who It’s For
TREND (Type II) is ideal for traders who:
seek dynamic entry and exit points without lagging indicators;
want visual and statistical confirmation of trend changes;
build multi-layered strategies requiring signal validation.
💬 Use TREND (Type II) to see the market one step ahead.
This isn’t just another indicator — it’s an early warning system for potential trend reversals .

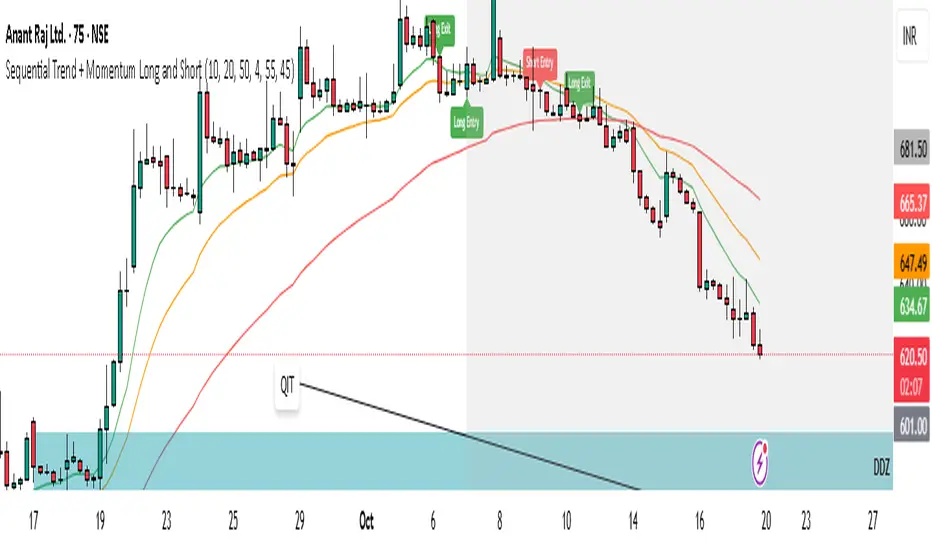
Sequential Trend + Momentum Long and Short📈 Signals
🟢 Long Entry: EMA trend turns bullish and RSI confirms momentum.
🔴 Short Entry: EMA trend turns bearish and RSI confirms momentum.
🟢 Long Exit: Price drops below EMA Exit zone.
🔴 Short Exit: Price rises above EMA Exit zone.
🧩 Parameters
Input Description
EMA Fast Short-term EMA for trend detection
EMA Slow Medium-term EMA for trend filtering
EMA Exit Longer EMA for trailing exit confirmation
RSI Length Period of RSI used for momentum check
RSI Long Threshold RSI value confirming bullish momentum
RSI Short Threshold RSI value confirming bearish momentum
🚀 How to Use
Apply the indicator on your preferred timeframe (15min–1h recommended).
Use Long Entry and Short Entry markers for potential trade setups.
Combine with your own stop-loss & target rules or automate via webhook.
Alerts are built-in for all entries/exits and can be sent to trading bots or brokers.
🔔 Alerts
Sequential Long Entry Triggered → triggers when bullish conditions align.
Sequential Long Exit Triggered → triggers when long trend weakens.
Sequential Short Entry Triggered → triggers when bearish conditions align.
Sequential Short Exit Triggered → triggers when short trend weakens.
🧭 Best Practices
Works best in trending markets; avoid ranging conditions.
Can be paired with volume filters or higher timeframe confirmation for better accuracy.
Adjustable EMA and RSI values make it flexible across assets (stocks, crypto, indices).
SZO - Signal Zone Oscillator ## Signal Zone Oscillator - SZO
**Created by:** @TraderCurses
**Version:** 1.0 (October 2025)
### ▌ OVERVIEW
The Signal Zone Oscillator (SZO) is a comprehensive momentum tool designed to provide a clearer, more nuanced view of market dynamics. It synthesizes three of the most powerful classic indicators—RSI, a unique MACD Ratio, and the Stochastic oscillator—into a single, unified signal.
The indicator's core feature is the **"Signal Zone"**: a colored area between the main oscillator line and its moving average filter. This zone makes it incredibly easy to visualize shifts in momentum, trends, and potential entry/exit points.
### ▌ KEY FEATURES
* **Composite Formula:** Combines RSI, MACD Ratio, and Stochastic using a weighted average to measure underlying market momentum.
* **The Signal Zone:** The flagship feature. The area between the SZO line and its filter is colored **green** in a bullish context (SZO above filter) and **red** in a bearish context (SZO below filter).
* **Dynamic Coloring:** Both the main SZO line and its filter change color dynamically, providing instant feedback on direction and strength.
* **Zero-Line Reference:** A dashed zero line acts as a classic equilibrium level, helping to confirm stronger bullish or bearish momentum.
* **Fully Customizable:** Every parameter is adjustable. You can change the lengths, sources, and even the weights of the core indicators from the settings menu.
* **Built-in Alerts:** Comes with pre-configured alerts for crossovers of the filter and the zero line, allowing you to automate your monitoring.
### ▌ HOW TO USE IT
The SZO provides several clear signals for traders:
1. **Bullish Signal:**
* The SZO line crosses **above** its filter.
* The Signal Zone turns **green**.
* A cross above the zero line can be used as further confirmation of strong bullish momentum.
2. **Bearish Signal:**
* The SZO line crosses **below** its filter.
* The Signal Zone turns **red**.
* A cross below the zero line can be used as further confirmation of strong bearish momentum.
3. **Divergences:**
* Like any oscillator, look for divergences between the SZO's peaks/troughs and the price action to spot potential reversals.
This tool is designed for traders who want to cut through the noise and get a clear, actionable signal from multiple momentum sources at once. Happy trading!

Metallic Retracement LevelsThere's something that's always bothered me about how traders use Fibonacci retracements. Everyone treats the golden ratio like it's the only game in town, but mathematically speaking, it's completely arbitrary. The golden ratio is just the first member of an infinite family of metallic means, and there's no particular reason why 1.618 should be special for markets when we have the silver ratio at 2.414, the bronze ratio at 3.303, and literally every other metallic mean extending to infinity. We just picked one and decided it was magical.
The metallic means are a sequence of mathematical constants that generalize the golden ratio. They're defined by the equation x² = kx + 1, where k is any positive integer. When k equals 1, you get the golden ratio. When k equals 2, you get the silver ratio. When k equals 3, you get bronze, and so on forever. Each metallic mean generates its own set of ratios through successive powers, just like how the golden ratio gives you 0.618, 0.382, 0.236 and so forth. The silver ratio produces a completely different set of retracement levels, as does bronze, as does any arbitrary metallic number you want to choose.
This indicator calculates these metallic means using the standard alpha and beta formulas. For any metallic number k, alpha equals (k + sqrt(k² + 4)) / 2, and we generate retracement ratios by raising alpha to various negative powers. The script algorithmically generates these levels instead of hardcoding them, which is how it should have been done from the start. It's genuinely silly that most fib tools just hardcode the ratios when the math to generate them is straightforward. Even worse, traditional fib retracements use 0.5 as a level, which isn't even a fibonacci ratio. It's just thrown in there because it seems like it should be important.
The indicator works by first detecting swing points using the Sylvain Zig-Zag . The zig-zag identifies significant price swings by combining percentage change with ATR adjustments, filtering out noise and connecting major pivot points. This is what drives the retracement levels. Once a new swing is confirmed, the script calculates the range between the last two pivot points and generates metallic retracement levels from the most recent swing low or high.
You can adjust which metallic number to use (golden, silver, bronze, or any positive integer), control how many power ratios to display above and below the 1.0 level, and set how many complete retracement cycles you want drawn. The levels extend from the swing point and show you where price might react based on whichever metallic mean you've selected. The zig-zag settings let you tune the sensitivity of swing detection through ATR period, ATR multiplier, percentage reversal, and additional absolute or tick-based reversal values.
What this really demonstrates is that retracement analysis is more flexible than most traders realize. There's no mathematical law that says markets must respect the golden ratio over any other metallic mean. They're all valid mathematical constructs with the same kind of recursive properties. By making this tool, I wanted to highlight that using fibonacci retracements involves an arbitrary choice, and maybe that choice should be more deliberate or at least tested against alternatives. You can experiment with different metallic numbers and see which ones seem to work better for your particular market or timeframe, or just use this to understand that the standard fib levels everyone uses aren't as fundamental as they appear.

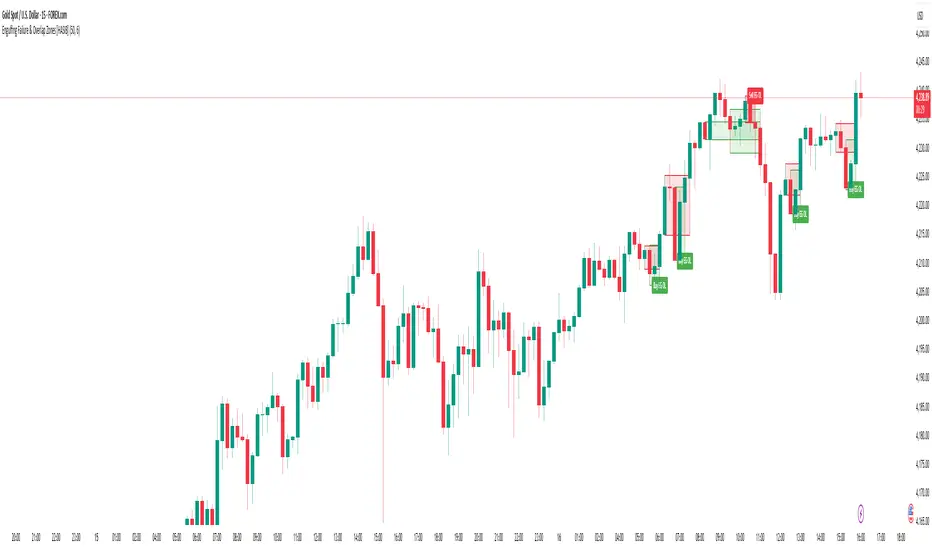
Engulfing Failure & Overlap Zones [HASIB]🧭 Overview
Engulfing Failure & Overlap Zones is a smart price action–based indicator that detects failed engulfing patterns and overlapping zones where potential liquidity traps or reversal setups often occur.
It’s designed to visually highlight both bullish and bearish failed engulfing areas with clean labels and zone markings, making it ideal for traders who follow Smart Money Concepts (SMC) or price action–driven trading.
⚙️ Core Concept
Engulfing patterns are powerful reversal signals — but not all of them succeed.
This indicator identifies:
When a Buy Engulfing setup fails and overlaps with a Sell Engulfing zone, and
When a Sell Engulfing setup fails and overlaps with a Buy Engulfing zone.
These overlapping areas often represent liquidity grab zones, reversal points, or Smart Money manipulation levels.
🎯 Key Features
✅ Detects both Buy and Sell Engulfing Failures
✅ Highlights Overlapping (OL) zones with colored rectangles
✅ Marks Buy EG OL / Sell EG OL labels automatically
✅ Fully customizable visuals — colors, padding, and zone styles
✅ Optimized for both scalping and swing trading
✅ Works on any timeframe and any instrument
⚡ How It Helps
Identify liquidity traps before reversals happen
Visually see Smart Money overlap zones between opposing engulfing structures
Strengthen your entry timing and confirmation zones
Combine with your own SMC or ICT-based trading setups for higher accuracy
📊 Recommended Use
Use on higher timeframes (e.g., M15, H1, H4) to confirm major liquidity zones.
Use on lower timeframes (e.g., M1–M5) for precision entries inside the detected zones.
Combine with tools like Order Blocks, Break of Structure (BOS), or Fair Value Gaps (FVG).
🧠 Pro Tip
When a failed engulfing overlaps with an opposite engulfing zone, it often signals market maker intent to reverse price direction after liquidity has been taken. Watch these zones closely for strong reaction candles.
Composite Stochastic Oscillator (CSO) [SharpStrat]Composite Stochastic Oscillator (CSO)
The Composite Stochastic Oscillator (CSO) is a refined momentum tool designed to improve on the limitations of the traditional stochastic indicator. Standard stochastics are often too sensitive, producing choppy signals and frequent false turns. CSO tackles this problem by combining multiple stochastic calculations, each with different lengths and smoothing settings, into a single, balanced output.
The goal of combining these stochastic variants is to create a more stable and reliable reading of market momentum. Each version of the stochastic captures different aspects of price behavior like shorter ones react faster, while longer ones filter noise. CSO brings them together mathematically to form a composite oscillator that reacts smoothly and consistently across varying market conditions. This makes it a useful improvement over the standard stochastic, providing traders with a more dependable signal while retaining the familiar interpretation framework.
How It Works
Calculates five independent stochastic oscillators with customizable K, D, and slowing parameters.
Each stochastic contributes to the final composite value according to its assigned weight, allowing the user to emphasize faster or slower reactions.
The resulting composite K is then smoothed into a D line using a chosen moving average method (SMA, EMA, WMA, or RMA).
The oscillator is plotted along with optional overbought/oversold levels and a color fill to enhance visual interpretation.
A compact on-chart table displays the current K and D readings for quick reference.
Comparison with normal Stochastic
Compared to a standard stochastic, the CSO generally produces smoother lines and fewer false flips. As evident in the comparison chart, this improves upon the normal stochastic by reducing noise and making signals more reliable, although results depend on parameter settings too.
How To Use It
Use the CSO exactly like a normal stochastic: look for crossovers, overbought/oversold zones, and divergences.
In practice, CSO should provides smoother and more consistent signals than the regular stochastic, especially in sideways or volatile markets.
When plotted beside a standard stochastic, you’ll notice CSO avoids many of the false reversals that clutter traditional readings.
Customization Options
Choice of smoothing method (SMA, EMA, WMA, RMA).
Full control over each stochastic component’s parameters and weights.
Adjustable overbought/oversold levels and display preferences.
Option to enable or disable the on-chart table and zone fills.
Note
This indicator is shared purely for educational and research purposes. It is not financial advice and should not be treated as a ready-made trading system.
I encourage you to experiment with different parameter values (periods, weights, smoothing) to explore how the behavior changes and to learn from the results.

Advanced Speedometer Gauge [PhenLabs]Advanced Speedometer Gauge
Version: PineScript™v6
📌 Description
The Advanced Speedometer Gauge is a revolutionary multi-metric visualization tool that consolidates 13 distinct trading indicators into a single, intuitive speedometer display. Instead of cluttering your workspace with multiple oscillators and panels, this gauge provides a unified interface where you can switch between different metrics while maintaining consistent visual interpretation.
Built on PineScript™ v6, the indicator transforms complex technical calculations into an easy-to-read semi-circular gauge with color-coded zones and a precision needle indicator. Each of the 13 available metrics has been carefully normalized to a 0-100 scale, ensuring that whether you’re analyzing RSI, volume trends, or volatility extremes, the visual interpretation remains consistent and intuitive.
The gauge is designed for traders who value efficiency and clarity. By consolidating multiple analytical perspectives into one compact display, you can quickly assess market conditions without the visual noise of traditional multi-indicator setups. All metrics are non-overlapping, meaning each provides unique insights into different aspects of market behavior.
🚀 Points of Innovation
13 selectable metrics covering momentum, volume, volatility, trend, and statistical analysis, all accessible through a single dropdown menu
Universal 0-100 normalization system that standardizes different indicator scales for consistent visual interpretation across all metrics
Semi-circular gauge design with 21 arc segments providing smooth precision and clear visual feedback through color-coded zones
Non-redundant metric selection ensuring each indicator provides unique market insights without analytical overlap
Advanced metrics including MFI (volume-weighted momentum), CCI (statistical deviation), Volatility Rank (extended lookback), Trend Strength (ADX-style), Choppiness Index, Volume Trend, and Price Distance from MA
Flexible positioning system with 5 chart locations, 3 size options, and fully customizable color schemes for optimal workspace integration
🔧 Core Components
Metric Selection Engine: Dropdown interface allowing instant switching between 13 different technical indicators, each with independent parameter controls
Normalization System: All metrics converted to 0-100 scale using indicator-specific algorithms that preserve the statistical significance of each measurement
Semi-Circular Gauge: Visual display using 21 arc segments arranged in curved formation with two-row thickness for enhanced visibility
Color Zone System: Three distinct zones (0-40 green, 40-70 yellow, 70-100 red) providing instant visual feedback on metric extremes
Needle Indicator: Dynamic pointer that positions across the gauge arc based on precise current metric value
Table Implementation: Professional table structure ensuring consistent positioning and rendering across different chart configurations
🔥 Key Features
RSI (Relative Strength Index): Classic momentum oscillator measuring overbought/oversold conditions with adjustable period length (default 14)
Stochastic Oscillator: Compares closing price to price range over specified period with smoothing, ideal for identifying momentum shifts
MFI (Money Flow Index): Volume-weighted RSI that combines price movement with volume to measure buying and selling pressure intensity
CCI (Commodity Channel Index): Measures statistical deviation from average price, normalized from typical -200 to +200 range to 0-100 scale
Williams %R: Alternative overbought/oversold indicator using high-low range analysis, inverted to match 0-100 scale conventions
Volume %: Current volume relative to moving average expressed as percentage, capped at 100 for extreme spikes
Volume Trend: Cumulative directional volume flow showing whether volume is flowing into up moves or down moves over specified period
ATR Percentile: Current Average True Range position within historical range using specified lookback period (default 100 bars)
Volatility Rank: Close-to-close volatility measured against extended historical range (default 252 days), differs from ATR in calculation method
Momentum: Rate of change calculation showing price movement speed, centered at 50 and normalized to 0-100 range
Trend Strength: ADX-style calculation using directional movement to quantify trend intensity regardless of direction
Choppiness Index: Measures market choppiness versus trending behavior, where high values indicate ranging markets and low values indicate strong trends
Price Distance from MA: Measures current price over-extension from moving average using standard deviation calculations
🎨 Visualization
Semi-Circular Arc Display: Curved gauge spanning from 0 (left) to 100 (right) with smooth progression and two-row thickness for visibility
Color-Coded Zones: Green zone (0-40) for low/oversold conditions, yellow zone (40-70) for neutral readings, red zone (70-100) for high/overbought conditions
Needle Indicator: Downward-pointing triangle (▼) positioned precisely at current metric value along the gauge arc
Scale Markers: Vertical line markers at 0, 25, 50, 75, and 100 positions with corresponding numerical labels below
Title Display: Merged cell showing “𓄀 PhenLabs” branding plus currently selected metric name in monospace font
Large Value Display: Current metric value shown with two decimal precision in large text directly below title
Table Structure: Professional table with customizable background color, text color, and transparency for minimal chart obstruction
📖 Usage Guidelines
Metric Selection
Select Metric: Default: RSI | Options: RSI, Stochastic, Volume %, ATR Percentile, Momentum, MFI (Money Flow), CCI (Commodity Channel), Williams %R, Volatility Rank, Trend Strength, Choppiness Index, Volume Trend, Price Distance | Choose the technical indicator you want to display on the gauge based on your current analytical needs
RSI Settings
RSI Length: Default: 14 | Range: 1+ | Controls the lookback period for RSI calculation, shorter periods increase sensitivity to recent price changes
Stochastic Settings
Stochastic Length: Default: 14 | Range: 1+ | Lookback period for stochastic calculation comparing close to high-low range
Stochastic Smooth: Default: 3 | Range: 1+ | Smoothing period applied to raw stochastic value to reduce noise and false signals
Volume Settings
Volume MA Length: Default: 20 | Range: 1+ | Moving average period used to calculate average volume for comparison with current volume
Volume Trend Length: Default: 20 | Range: 5+ | Period for calculating cumulative directional volume flow trend
ATR and Volatility Settings
ATR Length: Default: 14 | Range: 1+ | Period for Average True Range calculation used in ATR Percentile metric
ATR Percentile Lookback: Default: 100 | Range: 20+ | Historical range used to determine current ATR position as percentile
Volatility Rank Lookback (Days): Default: 252 | Range: 50+ | Extended lookback period for Volatility Rank metric using close-to-close volatility
Momentum and Trend Settings
Momentum Length: Default: 10 | Range: 1+ | Lookback period for rate of change calculation in Momentum metric
Trend Strength Length: Default: 20 | Range: 5+ | Period for directional movement calculations in ADX-style Trend Strength metric
Advanced Metric Settings
MFI Length: Default: 14 | Range: 1+ | Lookback period for Money Flow Index calculation combining price and volume
CCI Length: Default: 20 | Range: 1+ | Period for Commodity Channel Index statistical deviation calculation
Williams %R Length: Default: 14 | Range: 1+ | Lookback period for Williams %R high-low range analysis
Choppiness Index Length: Default: 14 | Range: 5+ | Period for calculating market choppiness versus trending behavior
Price Distance MA Length: Default: 50 | Range: 10+ | Moving average period used for Price Distance standard deviation calculation
Visual Customization
Position: Default: Top Right | Options: Top Left, Top Right, Bottom Left, Bottom Right, Middle Right | Controls gauge placement on chart for optimal workspace organization
Size: Default: Normal | Options: Small, Normal, Large | Adjusts overall gauge dimensions and text size for different monitor resolutions and preferences
Low Zone Color (0-40): Default: Green (#00FF00) | Customize color for low/oversold zone of gauge arc
Medium Zone Color (40-70): Default: Yellow (#FFFF00) | Customize color for neutral/medium zone of gauge arc
High Zone Color (70-100): Default: Red (#FF0000) | Customize color for high/overbought zone of gauge arc
Background Color: Default: Semi-transparent dark gray | Customize gauge background for contrast and chart integration
Text Color: Default: White (#FFFFFF) | Customize all text elements including title, value, and scale labels
✅ Best Use Cases
Quick visual assessment of market conditions when you need instant feedback on whether an asset is in extreme territory across multiple analytical dimensions
Workspace organization for traders who monitor multiple indicators but want to reduce chart clutter and visual complexity
Metric comparison by switching between different indicators while maintaining consistent visual interpretation through the 0-100 normalization
Overbought/oversold identification using RSI, Stochastic, Williams %R, or MFI depending on whether you prefer price-only or volume-weighted analysis
Volume analysis through Volume %, Volume Trend, or MFI to confirm price movements with corresponding volume characteristics
Volatility monitoring using ATR Percentile or Volatility Rank to identify expansion/contraction cycles and adjust position sizing
Trend vs range identification by comparing Trend Strength (high values = trending) against Choppiness Index (high values = ranging)
Statistical over-extension detection using CCI or Price Distance to identify when price has deviated significantly from normal behavior
Multi-timeframe analysis by duplicating the gauge on different timeframe charts to compare metric readings across time horizons
Educational purposes for new traders learning to interpret technical indicators through consistent visual representation
⚠️ Limitations
The gauge displays only one metric at a time, requiring manual switching to compare different indicators rather than simultaneous multi-metric viewing
The 0-100 normalization, while providing consistency, may obscure the raw values and specific nuances of each underlying indicator
Table-based visualization cannot be exported or saved as an image separately from the full chart screenshot
Optimal parameter settings vary by asset type, timeframe, and market conditions, requiring user experimentation for best results
💡 What Makes This Unique
Unified Multi-Metric Interface: The only gauge-style indicator offering 13 distinct metrics through a single interface, eliminating the need for multiple oscillator panels
Non-Overlapping Analytics: Each metric provides genuinely unique insights—MFI combines volume with price, CCI measures statistical deviation, Volatility Rank uses extended lookback, Trend Strength quantifies directional movement, and Choppiness Index measures ranging behavior
Universal Normalization System: All metrics standardized to 0-100 scale using indicator-appropriate algorithms that preserve statistical meaning while enabling consistent visual interpretation
Professional Visual Design: Semi-circular gauge with 21 arc segments, precision needle positioning, color-coded zones, and clean table implementation that maintains clarity across all chart configurations
Extensive Customization: Independent parameter controls for each metric, five position options, three size presets, and full color customization for seamless workspace integration
🔬 How It Works
1. Metric Calculation Phase:
All 13 metrics are calculated simultaneously on every bar using their respective algorithms with user-defined parameters
Each metric applies its own specific calculation method—RSI uses average gains vs losses, Stochastic compares close to high-low range, MFI incorporates typical price and volume, CCI measures deviation from statistical mean, ATR calculates true range, directional indicators measure up/down movement, and statistical metrics analyze price relationships
2. Normalization Process:
Each calculated metric is converted to a standardized 0-100 scale using indicator-appropriate transformations
Some metrics are naturally 0-100 (RSI, Stochastic, MFI, Williams %R), while others require scaling—CCI transforms from ±200 range, Momentum centers around 50, Volume ratio caps at 2x for 100, ATR and Volatility Rank calculate percentile positions, and Price Distance scales by standard deviations
3. Gauge Rendering:
The selected metric’s normalized value determines the needle position across 21 arc segments spanning 0-100
Each arc segment receives its color based on position—segments 0-8 are green zone, segments 9-14 are yellow zone, segments 15-20 are red zone
The needle indicator (▼) appears in row 5 at the column corresponding to the current metric value, providing precise visual feedback
4. Table Construction:
The gauge uses TradingView’s table system with merged cells for title and value display, ensuring consistent positioning regardless of chart configuration
Rows are allocated as follows: Row 0 merged for title, Row 1 merged for large value display, Row 2 for spacing, Rows 3-4 for the semi-circular arc with curved shaping, Row 5 for needle indicator, Row 6 for scale markers, Row 7 for numerical labels at 0/25/50/75/100
All visual elements update on every bar when barstate.islast is true, ensuring real-time accuracy without performance impact
💡 Note:
This indicator is designed for visual analysis and market condition assessment, not as a standalone trading system. For best results, combine gauge readings with price action analysis, support and resistance levels, and broader market context. Parameter optimization is recommended based on your specific trading timeframe and asset class. The gauge works on all timeframes but may require different parameter settings for intraday versus daily/weekly analysis. Consider using multiple instances of the gauge set to different metrics for comprehensive market analysis without switching between settings.

Cumulative Volume Delta Z Score [BackQuant]Cumulative Volume Delta Z Score
The Cumulative Volume Delta Z Score indicator is a sophisticated tool that combines the cumulative volume delta (CVD) with Z-Score normalization to provide traders with a clearer view of market dynamics. By analyzing volume imbalances and standardizing them through a Z-Score, this tool helps identify significant price movements and market trends while filtering out noise.
Core Concept of Cumulative Volume Delta (CVD)
Cumulative Volume Delta (CVD) is a popular indicator that tracks the net difference between buying and selling volume over time. CVD helps traders understand whether buying or selling pressure is dominating the market. Positive CVD signals buying pressure, while negative CVD indicates selling pressure.
The addition of Z-Score normalization to CVD makes it easier to evaluate whether current volume imbalances are unusual compared to past behavior. Z-Score helps in detecting extreme conditions by showing how far the current CVD is from its historical mean in terms of standard deviations.
Key Features
Cumulative Volume Delta (CVD): Tracks the net buying vs. selling volume, allowing traders to gauge the overall market sentiment.
Z-Score Normalization: Converts CVD into a standardized value to highlight extreme movements in volume that are statistically significant.
Divergence Detection: The indicator can spot bullish and bearish divergences between price and CVD, which can signal potential trend reversals.
Pivot-Based Divergence: Identifies price and CVD pivots, highlighting divergence patterns that are crucial for predicting price changes.
Trend Analysis: Colors bars according to trend direction, providing a visual indication of bullish or bearish conditions based on Z-Score.
How It Works
Cumulative Volume Delta (CVD): The CVD is calculated by summing the difference between buying and selling volume for each bar. It represents the net buying or selling pressure, giving insights into market sentiment.
Z-Score Normalization: The Z-Score is applied to the CVD to normalize its values, making it easier to compare current conditions with historical averages. A Z-Score greater than 0 indicates a bullish market, while a Z-Score less than 0 signals a bearish market.
Divergence Detection: The indicator detects regular and hidden bullish and bearish divergences between price and CVD. These divergences often precede trend reversals, offering traders a potential entry point.
Pivot-Based Analysis: The indicator uses pivot highs and lows in both price and CVD to identify divergence patterns. A bullish divergence occurs when price makes a lower low, but CVD fails to follow, suggesting weakening selling pressure. Conversely, a bearish divergence happens when price makes a higher high, but CVD doesn't confirm the move, indicating potential selling pressure.
Trend Coloring: The bars are colored based on the trend direction. Green bars indicate an uptrend (CVD is positive), and red bars indicate a downtrend (CVD is negative). This provides an easy-to-read visualization of market conditions.
Standard Deviation Levels: The indicator plots ±1σ, ±2σ, and ±3σ levels to indicate the degree of deviation from the average CVD. These levels act as thresholds for identifying extreme buying or selling pressure.
Customization Options
Anchor Timeframe: The user can define an anchor timeframe to aggregate the CVD, which can be customized based on the trader’s needs (e.g., daily, weekly, custom lower timeframes).
Z-Score Period: The period for calculating the Z-Score can be adjusted, allowing traders to fine-tune the indicator's sensitivity.
Divergence Detection: The tool offers controls to enable or disable divergence detection, with the ability to adjust the lookback periods for pivot detection.
Trend Coloring and Visuals: Traders can choose whether to color bars based on trend direction, display standard deviation levels, or visualize the data as a histogram or line plot.
Display Options: The indicator also allows for various display options, including showing the Z-Score values and divergence signals, with customizable colors and line widths.
Alerts and Signals
The Cumulative Volume Delta Z Score comes with pre-configured alert conditions for:
Z-Score Crossovers: Alerts are triggered when the Z-Score crosses the 0 line, indicating a potential trend reversal.
Shifting Trend: Alerts for when the Z-Score shifts direction, signaling a change in market sentiment.
Divergence Detection: Alerts for both regular and hidden bullish and bearish divergences, offering potential reversal signals.
Extreme Imbalances: Alerts when the Z-Score reaches extreme positive or negative levels, indicating overbought or oversold market conditions.
Applications in Trading
Trend Identification: Use the Z-Score to confirm bullish or bearish trends based on cumulative volume data, filtering out noise and false signals.
Reversal Signals: Divergences between price and CVD can help identify potential trend reversals, making it a powerful tool for swing traders.
Volume-Based Confirmation: The Z-Score allows traders to confirm price movements with volume data, providing more reliable signals compared to price action alone.
Divergence Strategy: Use the divergence signals to identify potential points of entry, particularly when regular or hidden divergences appear.
Volatility and Market Sentiment: The Z-Score provides insights into market volatility by measuring the deviation of CVD from its historical mean, helping to predict price movement strength.
The Cumulative Volume Delta Z Score is a powerful tool that combines volume analysis with statistical normalization. By focusing on volume imbalances and applying Z-Score normalization, this indicator provides clear, reliable signals for trend identification and potential reversals. It is especially useful for filtering out market noise and ensuring that trades are based on significant price movements driven by substantial volume changes.
This indicator is perfect for traders looking to add volume-based analysis to their strategy, offering a more robust and accurate way to gauge market sentiment and trend strength.

Trend Ali📈 Trend Ali - Advanced Hull Moving Average Indicator
🎯 Overview
This indicator is an advanced and highly customizable version of the Hull Moving Average (HMA), designed for precise trend identification and optimal entry/exit point detection in various market conditions.
✨ Key Features
🔄 Three Hull Moving Average Calculation Methods
The indicator offers three distinct calculation approaches to suit different trading styles:
1. HMA (Standard Hull Moving Average)
Ideal for most market conditions
Excellent balance between responsiveness and noise reduction
Uses WMA (Weighted Moving Average) for calculations
Best for general trend following
2. EHMA (Exponential Hull Moving Average)
Faster reaction to price changes
Perfect for volatile markets and quick scalping
Uses EMA instead of WMA for enhanced sensitivity
Recommended for aggressive trading strategies
3. THMA (Triangular Hull Moving Average)
Smoother than the standard version
Reduces false signals significantly
Optimal for higher timeframes and position trading
Provides clearer trend direction
🛠️ Advanced Settings
Length Parameter
This parameter directly affects the indicator's sensitivity and behavior:
55: Perfect for Swing Trading and identifying entry points
Catches medium-term trends
Good balance for 4H to Daily charts
180-200: Ideal for identifying floating Support/Resistance levels
Acts as dynamic S/R zones
Excellent for position trading
Reduces market noise significantly
Shorter Length = Faster response but more noise
Longer Length = Stronger signals but with more lag
Length Multiplier
View higher timeframe trends without changing your chart
Default value of 6.0 provides macro trend analysis
Increasing this value smooths the line further
Useful for multi-timeframe analysis on a single chart
Creates "straight band" effect for clearer trend visualization
Higher Timeframe Analysis
Display Hull MA from any higher timeframe
Extremely useful for scalping while maintaining trend awareness
Default: 240 minutes (4-hour chart)
Helps avoid counter-trend trades
Provides context for lower timeframe decisions
🎨 Intelligent Color System
The indicator automatically adjusts colors based on trend direction:
🟢 Green: Uptrend (price moving above previous levels)
Indicates bullish momentum
Consider long positions
🔴 Red: Downtrend (price moving below previous levels)
Indicates bearish momentum
Consider short positions or exit longs
🟠 Orange: Neutral (when color coding is disabled)
For traders who prefer monochrome display
📊 How to Use
For Swing Trading (Length: 55)
Wait for color change from red to green for long entries
Wait for color change from green to red for short entries or exits
Use price action confirmation at the Hull MA line
The line acts as dynamic support/resistance
For Support/Resistance (Length: 180-200)
The Hull MA acts as a floating S/R zone
Price bouncing off the line indicates strong trend
Price crossing the line signals potential trend reversal
Use for position sizing and stop loss placement
For Scalping (with Higher Timeframe)
Enable "Show Hull MA from X timeframe"
Select 240 (4H) or higher timeframe
Only take trades in direction of higher timeframe trend
Use lower timeframe for precise entries
Higher timeframe Hull MA keeps you on the right side
Multi-Timeframe Strategy
Use Length Multiplier to see macro trend
Keep your chart on preferred timeframe
Align trades with the smoothed trend direction
Enter on pullbacks to the Hull MA line
🔍 Technical Details
Why Hull Moving Average?
Traditional moving averages face a tradeoff between lag and noise. Hull Moving Average solves this by:
Using weighted calculations for faster response
Applying square root of length for optimal smoothing
Eliminating lag while maintaining smoothness
Calculation Method
The indicator uses sophisticated algorithms:
HMA: Combines multiple WMAs with square root period
EHMA: Applies exponential smoothing for speed
THMA: Uses triangular weighting for stability
RSI Source Input
Allows using any price source (Close, Open, HL2, etc.)
Default: Close price
Experiment with different sources for unique insights
⚙️ Recommended Settings
Day Trading
Mode: EHMA
Length: 55
Length Multiplier: 3-4
Color: Enabled
Swing Trading
Mode: HMA
Length: 55
Length Multiplier: 6
Color: Enabled
Position Trading
Mode: THMA
Length: 180-200
Length Multiplier: 8-10
Color: Enabled
Scalping
Mode: HMA or EHMA
Length: 55
Higher Timeframe: Enabled (240 or higher)
Color: Enabled
💡 Pro Tips
Trend Confirmation: Wait for 2-3 candles to confirm color change before entering
Divergence: Watch for price/Hull MA divergence for reversal signals
Volume: Combine with volume analysis for stronger signals
Multiple Instances: Add indicator twice with different settings for multi-timeframe view
Backtesting: Test different Length values for your specific asset and timeframe
Risk Management: Use Hull MA distance for stop loss placement
⚠️ Important Notes
No indicator is 100% accurate - always use risk management
Best used in combination with price action and other technical analysis
Different markets may require different settings
Backtest thoroughly before live trading
Consider market volatility when adjusting parameters

Luxy Momentum, Trend, Bias and Breakout Indicators V7
TABLE OF CONTENTS
This is Version 7 (V7) - the latest and most optimized release. If you are using any older versions (V6, V5, V4, V3, etc.), it is highly recommended to replace them with V7.
Why This Indicator is Different
Who Should Use This
Core Components Overview
The UT Bot Trading System
Understanding the Market Bias Table
Candlestick Pattern Recognition
Visual Tools and Features
How to Use the Indicator
Performance and Optimization
FAQ
---
### CREDITS & ATTRIBUTION
This indicator implements proven trading concepts using entirely original code developed specifically for this project.
### CONCEPTUAL FOUNDATIONS
• UT Bot ATR Trailing System
- Original concept by @QuantNomad: (search "UT-Bot-Strategy"
- Our version is a complete reimplementation with significant enhancements:
- Volume-weighted momentum adjustment
- Composite stop loss from multiple S/R layers
- Multi-filter confirmation system (swing, %, 2-bar, ZLSMA)
- Full integration with multi-timeframe bias table
- Visual audit trail with freeze-on-touch
- NOTE: No code was copied - this is a complete reimplementation with enhancements.
• Standard Technical Indicators (Public Domain Formulas):
- Supertrend: ATR-based trend calculation with custom gradient fills
- MACD: Gerald Appel's formula with separation filters
- RSI: J. Welles Wilder's formula with pullback zone logic
- ADX/DMI: Custom trend strength formula inspired by Wilder's directional movement concept, reimplemented with volume weighting and efficiency metrics
- ZLSMA: Zero-lag formula enhanced with Hull MA and momentum prediction
### Custom Implementations
- Trend Strength: Inspired by Wilder's ADX concept but using volume-weighted pressure calculation and efficiency metrics (not traditional +DI/-DI smoothing)
- All code implementations are original
### ORIGINAL FEATURES (70%+ of codebase)
- Multi-Timeframe Bias Table with live updates
- Risk Management System (R-multiple TPs, freeze-on-touch)
- Opening Range Breakout tracker with session management
- Composite Stop Loss calculator using 6+ S/R layers
- Performance optimization system (caching, conditional calcs)
- VIX Fear Index integration
- Previous Day High/Low auto-detection
- Candlestick pattern recognition with interactive tooltips
- Smart label and visual management
- All UI/UX design and table architecture
### DEVELOPMENT PROCESS
**AI Assistance:** This indicator was developed over 2+ months with AI assistance (ChatGPT/Claude) used for:
- Writing Pine Script code based on design specifications
- Optimizing performance and fixing bugs
- Ensuring Pine Script v6 compliance
- Generating documentation
**Author's Role:** All trading concepts, system design, feature selection, integration logic, and strategic decisions are original work by the author. The AI was a coding tool, not the system designer.
**Transparency:** We believe in full disclosure - this project demonstrates how AI can be used as a powerful development tool while maintaining creative and strategic ownership.
---
1. WHY THIS INDICATOR IS DIFFERENT
Most traders use multiple separate indicators on their charts, leading to cluttered screens, conflicting signals, and analysis paralysis. The Suite solves this by integrating proven technical tools into a single, cohesive system.
Key Advantages:
All-in-One Design: Instead of loading 5-10 separate indicators, you get everything in one optimized script. This reduces chart clutter and improves TradingView performance.
Multi-Timeframe Bias Table: Unlike standard indicators that only show the current timeframe, the Bias Table aggregates trend signals across multiple timeframes simultaneously. See at a glance whether 1m, 5m, 15m, 1h are aligned bullish or bearish - no more switching between charts.
Smart Confirmations: The indicator doesn't just give signals - it shows you WHY. Every entry has multiple layers of confirmation (MA cross, MACD momentum, ADX strength, RSI pullback, volume, etc.) that you can toggle on/off.
Dynamic Stop Loss System: Instead of static ATR stops, the SL is calculated from multiple support/resistance layers: UT trailing line, Supertrend, VWAP, swing structure, and MA levels. This creates more intelligent, price-action-aware stops.
R-Multiple Take Profits: Built-in TP system calculates targets based on your initial risk (1R, 1.5R, 2R, 3R). Lines freeze when touched with visual checkmarks, giving you a clean audit trail of partial exits.
Educational Tooltips Everywhere: Every single input has detailed tooltips explaining what it does, typical values, and how it impacts trading. You're not guessing - you're learning as you configure.
Performance Optimized: Smart caching, conditional calculations, and modular design mean the indicator runs fast despite having 15+ features. Turn off what you don't use for even better performance.
No Repainting: All signals respect bar close. Alerts fire correctly. What you see in history is what you would have gotten in real-time.
What Makes It Unique:
Integrated UT Bot + Bias Table: No other indicator combines UT Bot's ATR trailing system with a live multi-timeframe dashboard. You get precision entries with macro trend context.
Candlestick Pattern Recognition with Interactive Tooltips: Patterns aren't just marked - hover over any emoji for a full explanation of what the pattern means and how to trade it.
Opening Range Breakout Tracker: Built-in ORB system for intraday traders with customizable session times and real-time status updates in the Bias Table.
Previous Day High/Low Auto-Detection: Automatically plots PDH/PDL on intraday charts with theme-aware colors. Updates daily without manual input.
Dynamic Row Labels in Bias Table: The table shows your actual settings (e.g., "EMA 10 > SMA 20") not generic labels. You know exactly what's being evaluated.
Modular Filter System: Instead of forcing a fixed methodology, the indicator lets you build your own strategy. Start with just UT Bot, add filters one at a time, test what works for your style.
---
2. WHO WHOULD USE THIS
Designed For:
Intermediate to Advanced Traders: You understand basic technical analysis (MAs, RSI, MACD) and want to combine multiple confirmations efficiently. This isn't a "one-click profit" system - it's a professional toolkit.
Multi-Timeframe Traders: If you trade one asset but check multiple timeframes for confirmation (e.g., enter on 5m after checking 15m and 1h alignment), the Bias Table will save you hours every week.
Trend Followers: The indicator excels at identifying and following trends using UT Bot, Supertrend, and MA systems. If you trade breakouts and pullbacks in trending markets, this is built for you.
Intraday and Swing Traders: Works equally well on 5m-1h charts (day trading) and 4h-D charts (swing trading). Scalpers can use it too with appropriate settings adjustments.
Discretionary Traders: This isn't a black-box system. You see all the components, understand the logic, and make final decisions. Perfect for traders who want tools, not automation.
Works Across All Markets:
Stocks (US, international)
Cryptocurrency (24/7 markets supported)
Forex pairs
Indices (SPY, QQQ, etc.)
Commodities
NOT Ideal For :
Complete Beginners: If you don't know what a moving average or RSI is, start with basics first. This indicator assumes foundational knowledge.
Algo Traders Seeking Black Box: This is discretionary. Signals require context and confirmation. Not suitable for blind automated execution.
Mean-Reversion Only Traders: The indicator is trend-following at its core. While VWAP bands support mean-reversion, the primary methodology is trend continuation.
---
3. CORE COMPONENTS OVERVIEW
The indicator combines these proven systems:
Trend Analysis:
Moving Averages: Four customizable MAs (Fast, Medium, Medium-Long, Long) with six types to choose from (EMA, SMA, WMA, VWMA, RMA, HMA). Mix and match for your style.
Supertrend: ATR-based trend indicator with unique gradient fill showing trend strength. One-sided ribbon visualization makes it easier to see momentum building or fading.
ZLSMA : Zero-lag linear-regression smoothed moving average. Reduces lag compared to traditional MAs while maintaining smooth curves.
Momentum & Filters:
MACD: Standard MACD with separation filter to avoid weak crossovers.
RSI: Pullback zone detection - only enter longs when RSI is in your defined "buy zone" and shorts in "sell zone".
ADX/DMI: Trend strength measurement with directional filter. Ensures you only trade when there's actual momentum.
Volume Filter: Relative volume confirmation - require above-average volume for entries.
Donchian Breakout: Optional channel breakout requirement.
Signal Systems:
UT Bot: The primary signal generator. ATR trailing stop that adapts to volatility and gives clear entry/exit points.
Base Signals: MA cross system with all the above filters applied. More conservative than UT Bot alone.
Market Bias Table: Multi-timeframe dashboard showing trend alignment across 7 timeframes plus macro bias (3-day, weekly, monthly, quarterly, VIX).
Candlestick Patterns: Six major reversal patterns auto-detected with interactive tooltips.
ORB Tracker: Opening range high/low with breakout status (intraday only).
PDH/PDL: Previous day levels plotted automatically on intraday charts.
VWAP + Bands : Session-anchored VWAP with up to three standard deviation band pairs.
---
4. THE UT BOT TRADING SYSTEM
The UT Bot is the heart of the indicator's signal generation. It's an advanced ATR trailing stop that adapts to market volatility.
Why UT Bot is Superior to Fixed Stops:
Traditional ATR stops use a fixed multiplier (e.g., "stop = entry - 2×ATR"). UT Bot is smarter:
It TRAILS the stop as price moves in your favor
It WIDENS during high volatility to avoid premature stops
It TIGHTENS during consolidation to lock in profits
It FLIPS when price breaks the trailing line, signaling reversals
Visual Elements You'll See:
Orange Trailing Line: The actual UT stop level that adapts bar-by-bar
Buy/Sell Labels: Aqua triangle (long) or orange triangle (short) when the line flips
ENTRY Line: Horizontal line at your entry price (optional, can be turned off)
Suggested Stop Loss: A composite SL calculated from multiple support/resistance layers:
- UT trailing line
- Supertrend level
- VWAP
- Swing structure (recent lows/highs)
- Long-term MA (200)
- ATR-based floor
Take Profit Lines: TP1, TP1.5, TP2, TP3 based on R-multiples. When price touches a TP, it's marked with a checkmark and the line freezes for audit trail purposes.
Status Messages: "SL Touched ❌" or "SL Frozen" when the trade leg completes.
How UT Bot Differs from Other ATR Systems:
Multiple Filters Available: You can require 2-bar confirmation, minimum % price change, swing structure alignment, or ZLSMA directional filter. Most UT implementations have none of these.
Smart SL Calculation: Instead of just using the UT line as your stop, the indicator suggests a better SL based on actual support/resistance. This prevents getting stopped out by wicks while keeping risk controlled.
Visual Audit Trail: All SL/TP lines freeze when touched with clear markers. You can review your trades weeks later and see exactly where entries, stops, and targets were.
Performance Options: "Draw UT visuals only on bar close" lets you reduce rendering load without affecting logic or alerts - critical for slower machines or 1m charts.
Trading Logic:
UT Bot flips direction (Buy or Sell signal appears)
Check Bias Table for multi-timeframe confirmation
Optional: Wait for Base signal or candlestick pattern
Enter at signal bar close or next bar open
Place stop at "Suggested Stop Loss" line
Scale out at TP levels (TP1, TP2, TP3)
Exit remaining position on opposite UT signal or stop hit
---
5. UNDERSTANDING THE MARKET BIAS TABLE
This is the indicator's unique multi-timeframe intelligence layer. Instead of looking at one chart at a time, the table aggregates signals across seven timeframes plus macro trend bias.
Why Multi-Timeframe Analysis Matters:
Professional traders check higher and lower timeframes for context:
Is the 1h uptrend aligning with my 5m entry?
Are all short-term timeframes bullish or just one?
Is the daily trend supportive or fighting me?
Doing this manually means opening multiple charts, checking each indicator, and making mental notes. The Bias Table does it automatically in one glance.
Table Structure:
Header Row:
On intraday charts: 1m, 5m, 15m, 30m, 1h, 2h, 4h (toggle which ones you want)
On daily+ charts: D, W, M (automatic)
Green dot next to title = live updating
Headline Rows - Macro Bias:
These show broad market direction over longer periods:
3 Day Bias: Trend over last 3 trading sessions (uses 1h data)
Weekly Bias: Trend over last 5 trading sessions (uses 4h data)
Monthly Bias: Trend over last 30 daily bars
Quarterly Bias: Trend over last 13 weekly bars
VIX Fear Index: Market regime based on VIX level - bullish when low, bearish when high
Opening Range Breakout: Status of price vs. session open range (intraday only)
These rows show text: "BULLISH", "BEARISH", or "NEUTRAL"
Indicator Rows - Technical Signals:
These evaluate your configured indicators across all active timeframes:
Fast MA > Medium MA (shows your actual MA settings, e.g., "EMA 10 > SMA 20")
Price > Long MA (e.g., "Price > SMA 200")
Price > VWAP
MACD > Signal
Supertrend (up/down/neutral)
ZLSMA Rising
RSI In Zone
ADX ≥ Minimum
These rows show emojis: GREEB (bullish), RED (bearish), GRAY/YELLOW (neutral/NA)
AVG Column:
Shows percentage of active timeframes that are bullish for that row. This is the KEY metric:
AVG > 70% = strong multi-timeframe bullish alignment
AVG 40-60% = mixed/choppy, no clear trend
AVG < 30% = strong multi-timeframe bearish alignment
How to Use the Table:
For a long trade:
Check AVG column - want to see > 60% ideally
Check headline bias rows - want to see BULLISH, not BEARISH
Check VIX row - bullish market regime preferred
Check ORB row (intraday) - want ABOVE for longs
Scan indicator rows - more green = better confirmation
For a short trade:
Check AVG column - want to see < 40% ideally
Check headline bias rows - want to see BEARISH, not BULLISH
Check VIX row - bearish market regime preferred
Check ORB row (intraday) - want BELOW for shorts
Scan indicator rows - more red = better confirmation
When AVG is 40-60%:
Market is choppy, mixed signals. Either stay out or reduce position size significantly. These are low-probability environments.
Unique Features:
Dynamic Labels: Row names show your actual settings (e.g., "EMA 10 > SMA 20" not generic "Fast > Slow"). You know exactly what's being evaluated.
Customizable Rows: Turn off rows you don't care about. Only show what matters to your strategy.
Customizable Timeframes: On intraday charts, disable 1m or 4h if you don't trade them. Reduces calculation load by 20-40%.
Automatic HTF Handling: On Daily/Weekly/Monthly charts, the table automatically switches to D/W/M columns. No configuration needed.
Performance Smart: "Hide BIAS table on 1D or above" option completely skips all table calculations on higher timeframes if you only trade intraday.
---
6. CANDLESTICK PATTERN RECOGNITION
The indicator automatically detects six major reversal patterns and marks them with emojis at the relevant bars.
Why These Six Patterns:
These are the most statistically significant reversal patterns according to trading literature:
High win rate when appearing at support/resistance
Clear visual structure (not subjective)
Work across all timeframes and assets
Studied extensively by institutions
The Patterns:
Bullish Patterns (appear at bottoms):
Bullish Engulfing: Green candle completely engulfs prior red candle's body. Strong reversal signal.
Hammer: Small body with long lower wick (at least 2× body size). Shows rejection of lower prices by buyers.
Morning Star: Three-candle pattern (large red → small indecision → large green). Very strong bottom reversal.
Bearish Patterns (appear at tops):
Bearish Engulfing: Red candle completely engulfs prior green candle's body. Strong reversal signal.
Shooting Star: Small body with long upper wick (at least 2× body size). Shows rejection of higher prices by sellers.
Evening Star: Three-candle pattern (large green → small indecision → large red). Very strong top reversal.
Interactive Tooltips:
Unlike most pattern indicators that just draw shapes, this one is educational:
Hover your mouse over any pattern emoji
A tooltip appears explaining: what the pattern is, what it means, when it's most reliable, and how to trade it
No need to memorize - learn as you trade
Noise Filter:
"Min candle body % to filter noise" setting prevents false signals:
Patterns require minimum body size relative to price
Filters out tiny candles that don't represent real buying/selling pressure
Adjust based on asset volatility (higher % for crypto, lower for low-volatility stocks)
How to Trade Patterns:
Patterns are NOT standalone entry signals. Use them as:
Confirmation: UT Bot gives signal + pattern appears = stronger entry
Reversal Warning: In a trade, opposite pattern appears = consider tightening stop or taking profit
Support/Resistance Validation: Pattern at key level (PDH, VWAP, MA 200) = level is being respected
Best combined with:
UT Bot or Base signal in same direction
Bias Table alignment (AVG > 60% or < 40%)
Appearance at obvious support/resistance
---
7. VISUAL TOOLS AND FEATURES
VWAP (Volume Weighted Average Price):
Session-anchored VWAP with standard deviation bands. Shows institutional "fair value" for the trading session.
Anchor Options: Session, Day, Week, Month, Quarter, Year. Choose based on your trading timeframe.
Bands: Up to three pairs (X1, X2, X3) showing statistical deviation. Price at outer bands often reverses.
Auto-Hide on HTF: VWAP hides on Daily/Weekly/Monthly charts automatically unless you enable anchored mode.
Use VWAP as:
Directional bias (above = bullish, below = bearish)
Mean reversion levels (outer bands)
Support/resistance (the VWAP line itself)
Previous Day High/Low:
Automatically plots yesterday's high and low on intraday charts:
Updates at start of each new trading day
Theme-aware colors (dark text for light charts, light text for dark charts)
Hidden automatically on Daily/Weekly/Monthly charts
These levels are critical for intraday traders - institutions watch them closely as support/resistance.
Opening Range Breakout (ORB):
Tracks the high/low of the first 5, 15, 30, or 60 minutes of the trading session:
Customizable session times (preset for NYSE, LSE, TSE, or custom)
Shows current breakout status in Bias Table row (ABOVE, BELOW, INSIDE, BUILDING)
Intraday only - auto-disabled on Daily+ charts
ORB is a classic day trading strategy - breakout above opening range often leads to continuation.
Extra Labels:
Change from Open %: Shows how far price has moved from session open (intraday) or daily open (HTF). Green if positive, red if negative.
ADX Badge: Small label at bottom of last bar showing current ADX value. Green when above your minimum threshold, red when below.
RSI Badge: Small label at top of last bar showing current RSI value with zone status (buy zone, sell zone, or neutral).
These labels provide quick at-a-glance confirmation without needing separate indicator windows.
---
8. HOW TO USE THE INDICATOR
Step 1: Add to Chart
Load the indicator on your chosen asset and timeframe
First time: Everything is enabled by default - the chart will look busy
Don't panic - you'll turn off what you don't need
Step 2: Start Simple
Turn OFF everything except:
UT Bot labels (keep these ON)
Bias Table (keep this ON)
Moving Averages (Fast and Medium only)
Suggested Stop Loss and Take Profits
Hide everything else initially. Get comfortable with the basic UT Bot + Bias Table workflow first.
Step 3: Learn the Core Workflow
UT Bot gives a Buy or Sell signal
Check Bias Table AVG column - do you have multi-timeframe alignment?
If yes, enter the trade
Place stop at Suggested Stop Loss line
Scale out at TP levels
Exit on opposite UT signal
Trade this simple system for a week. Get a feel for signal frequency and win rate with your settings.
Step 4: Add Filters Gradually
If you're getting too many losing signals (whipsaws in choppy markets), add filters one at a time:
Try: "Require 2-Bar Trend Confirmation" - wait for 2 bars to confirm direction
Try: ADX filter with minimum threshold - only trade when trend strength is sufficient
Try: RSI pullback filter - only enter on pullbacks, not chasing
Try: Volume filter - require above-average volume
Add one filter, test for a week, evaluate. Repeat.
Step 5: Enable Advanced Features (Optional)
Once you're profitable with the core system, add:
Supertrend for additional trend confirmation
Candlestick patterns for reversal warnings
VWAP for institutional anchor reference
ORB for intraday breakout context
ZLSMA for low-lag trend following
Step 6: Optimize Settings
Every setting has a detailed tooltip explaining what it does and typical values. Hover over any input to read:
What the parameter controls
How it impacts trading
Suggested ranges for scalping, day trading, and swing trading
Start with defaults, then adjust based on your results and style.
Step 7: Set Up Alerts
Right-click chart → Add Alert → Condition: "Luxy Momentum v6" → Choose:
"UT Bot — Buy" for long entries
"UT Bot — Sell" for short entries
"Base Long/Short" for filtered MA cross signals
Optionally enable "Send real-time alert() on UT flip" in settings for immediate notifications.
Common Workflow Variations:
Conservative Trader:
UT signal + Base signal + Candlestick pattern + Bias AVG > 70%
Enter only at major support/resistance
Wider UT sensitivity, multiple filters
Aggressive Trader:
UT signal + Bias AVG > 60%
Enter immediately, no waiting
Tighter UT sensitivity, minimal filters
Swing Trader:
Focus on Daily/Weekly Bias alignment
Ignore intraday noise
Use ORB and PDH/PDL less (or not at all)
Wider stops, patient approach
---
9. PERFORMANCE AND OPTIMIZATION
The indicator is optimized for speed, but with 15+ features running simultaneously, chart load time can add up. Here's how to keep it fast:
Biggest Performance Gains:
Disable Unused Timeframes: In "Time Frames" settings, turn OFF any timeframe you don't actively trade. Each disabled TF saves 10-15% calculation time. If you only day trade 5m, 15m, 1h, disable 1m, 2h, 4h.
Hide Bias Table on Daily+: If you only trade intraday, enable "Hide BIAS table on 1D or above". This skips ALL table calculations on higher timeframes.
Draw UT Visuals Only on Bar Close: Reduces intrabar rendering of SL/TP/Entry lines. Has ZERO impact on logic or alerts - purely visual optimization.
Additional Optimizations:
Turn off VWAP bands if you don't use them
Disable candlestick patterns if you don't trade them
Turn off Supertrend fill if you find it distracting (keep the line)
Reduce "Limit to 10 bars" for SL/TP lines to minimize line objects
Performance Features Built-In:
Smart Caching: Higher timeframe data (3-day bias, weekly bias, etc.) updates once per day, not every bar
Conditional Calculations: Volume filter only calculates when enabled. Swing filter only runs when enabled. Nothing computes if turned off.
Modular Design: Every component is independent. Turn off what you don't need without breaking other features.
Typical Load Times:
5m chart, all features ON, 7 timeframes: ~2-3 seconds
5m chart, core features only, 3 timeframes: ~1 second
1m chart, all features: ~4-5 seconds (many bars to calculate)
If loading takes longer, you likely have too many indicators on the chart total (not just this one).
---
10. FAQ
Q: How is this different from standard UT Bot indicators?
A: Standard UT Bot (originally by @QuantNomad) is just the ATR trailing line and flip signals. This implementation adds:
- Volume weighting and momentum adjustment to the trailing calculation
- Multiple confirmation filters (swing, %, 2-bar, ZLSMA)
- Smart composite stop loss system from multiple S/R layers
- R-multiple take profit system with freeze-on-touch
- Integration with multi-timeframe Bias Table
- Visual audit trail with checkmarks
Q: Can I use this for automated trading?
A: The indicator is designed for discretionary trading. While it has clear signals and alerts, it's not a mechanical system. Context and judgment are required.
Q: Does it repaint?
A: No. All signals respect bar close. UT Bot logic runs intrabar but signals only trigger on confirmed bars. Alerts fire correctly with no lookahead.
Q: Do I need to use all the features?
A: Absolutely not. The indicator is modular. Many profitable traders use just UT Bot + Bias Table + Moving Averages. Start simple, add complexity only if needed.
Q: How do I know which settings to use?
A: Every single input has a detailed tooltip. Hover over any setting to see:
What it does
How it affects trading
Typical values for scalping, day trading, swing trading
Start with defaults, adjust gradually based on results.
Q: Can I use this on crypto 24/7 markets?
A: Yes. ORB will not work (no defined session), but everything else functions normally. Use "Day" anchor for VWAP instead of "Session".
Q: The Bias Table is blank or not showing.
A: Check:
"Show Table" is ON
Table position isn't overlapping another indicator's table (change position)
At least one row is enabled
"Hide BIAS table on 1D or above" is OFF (if on Daily+ chart)
Q: Why are candlestick patterns not appearing?
A: Patterns are relatively rare by design - they only appear at genuine reversal points. Check:
Pattern toggles are ON
"Min candle body %" isn't too high (try 0.05-0.10)
You're looking at a chart with actual reversals (not strong trending market)
Q: UT Bot is too sensitive/not sensitive enough.
A: Adjust "Sensitivity (Key×ATR)". Lower number = tighter stop, more signals. Higher number = wider stop, fewer signals. Read the tooltip for guidance.
Q: Can I get alerts for the Bias Table?
A: The Bias Table is a dashboard for visual analysis, not a signal generator. Set alerts on UT Bot or Base signals, then manually check Bias Table for confirmation.
Q: Does this work on stocks with low volume?
A: Yes, but turn OFF the volume filter. Low volume stocks will never meet relative volume requirements.
Q: How often should I check the Bias Table?
A: Before every entry. It takes 2 seconds to glance at the AVG column and headline rows. This one check can save you from fighting the trend.
Q: What if UT signal and Base signal disagree?
A: UT Bot is more aggressive (ATR trailing). Base signals are more conservative (MA cross + filters). If they disagree, either:
Wait for both to align (safest)
Take the UT signal but with smaller size (aggressive)
Skip the trade (conservative)
There's no "right" answer - depends on your risk tolerance.
---
FINAL NOTES
The indicator gives you an edge. How you use that edge determines results.
For questions, feedback, or support, comment on the indicator page or message the author.
Happy Trading!

Continuation Suite v1 — 5m/15mContinuation Suite v1 — 5m/15m (Non-Repainting, S/R + Trend Continuation)
What it does
Continuation Suite v1 is a practical intraday toolkit that combines non-repainting trend-continuation signals with auto-built Support/Resistance (S/R) from confirmed pivots. It’s designed for fast, liquid names on 5m charts with an optional 15m higher-timeframe (HTF) overlay. You get: stacked-EMA bias, disciplined pullback+reclaim entries, optional volume/volatility gates, a “Strong” signal tier, solid S/R lines or zones, and a compact dashboard for fast reads.
⸻
Why traders use it
• Clear bias using fast/mid/slow EMA stacking.
• Actionable entries that require a pullback, a reclaim, and (optionally) a minor break of prior extremes.
• Signal quality gates (volume vs SMA, ATR%, ADX/DI alignment, EMA spacing, slope).
• Non-repainting logic when “Confirm on Close” = ON. Intrabar previews show what’s forming, but confirmed signals only print on bar close.
• S/R that matters: confirmed-pivot lines or ATR-sized zones, optional HTF overlay, and auto de-dup to avoid clutter.
⸻
Signal construction (no magic, just rules)
Bullish continuation (base):
1. Trend: EMA fast > EMA mid > EMA slow
2. Pullback: price pulls into the stack (lowest low or close vs EMA fast/mid over a lookback)
3. Reclaim: close > EMA fast and close > open
4. Break filter (optional): current bar takes out the prior bar’s high
5. Filters: volume > SMA (if enabled) and ATR% ≤ max (if enabled)
6. Cooldown: a minimum bar gap between signals
Bearish continuation (base): mirror of the above.
Strong signals: base conditions plus ADX ≥ threshold, DI alignment (DI+>DI- for longs; DI->DI+ for shorts), minimum EMA-spacing %, and minimum fast-EMA slope.
Reference stops:
• Longs: lowest low over the pullback lookback
• Shorts: highest high over the pullback lookback
Alerts are included for: Bullish Continuation, Bearish Continuation, STRONG Bullish, STRONG Bearish.
⸻
S/R engine (current TF + optional HTF)
• Builds S/R from confirmed pivots only (left/right bars).
• Choose Lines (midlines) or Zones (ATR-sized).
• Zones merge when a new pivot lands near an existing zone’s mid (ATR-scaled epsilon).
• Touches counter tracks significance; you can require a minimum to draw.
• HTF overlay (default 15m) draws separate lines/zones with tiny TF tags on the right.
• De-dup option hides current-TF zones that sit too close to HTF zones (ATR-scaled), reducing overlap.
• Freeze on Close (optional) keeps arrays stable intrabar; snapshots show levels immediately as bars open.
⸻
Presets
• Auto: Detects QQQ-like tickers (QQQ, QLD, QID) or SoFi; else defaults to Custom.
• QQQ: Tighter ATR% and EMA settings geared to index-ETF behavior.
• SoFi: Wider ATR allowances and longer mid/slow for single-name behavior.
• Custom: Expose all key inputs to tune for your product.
⸻
Dashboard (top-right)
• Preset in use
• Bias (Bullish CONT / Bearish CONT / Neutral)
• Strong (Yes/No)
• Volatility (ATR% bucket)
• Trend (ADX bucket)
• HTF timeframe tag
• Volume (bucket or “off”)
• Signals mode (Close-Confirmed vs Intrabar)
⸻
Inputs you’ll actually adjust
Trend/Signals
• Fast/Mid/Slow EMA lengths
• Pullback lookback, Min bars between signals
• Volume filter (vol > SMA N)
• ATR% max filter (cap excessive volatility)
• Require break of prior bar’s high/low
• “Strong” gates: min EMA slope, min EMA spacing %, ADX length & threshold
Support/Resistance
• Lines vs Zones
• Pivot left/right bars
• Extend left/right (bars)
• Max pivots kept (current & HTF)
• Zone width (× ATR), Merge epsilon (× ATR), Min gap (× ATR)
• Min touches, Max zones per side near price
• De-dup current TF vs HTF (× ATR)
Repainting control
• Confirm on Close: when ON, signals/SR finalize on bar close (non-repainting)
• Freeze on Close: freeze S/R intrabar with snapshot updates
• Show previews: translucent intrabar labels for what’s forming
⸻
How to use it (straightforward)
1. Load on 5-minute chart (baseline). Keep Confirm on Close ON if you hate repainting.
2. Use Bias + Strong + S/R context. If a long prints into HTF resistance, you have information.
3. Manage risk off the reference stop (pullback extreme). If ATR% reads “Great,” widen expectations; if “Poor,” size down or pass.
4. Alerts: wire the four alert types to your workflow.
⸻
Notes and constraints
• Designed for liquid symbols. Thin books and synthetic “volume” will degrade the volume gate.
• S/R is pivot-based. On very choppy tape, touch counts help. Increase min touches or switch to Lines to declutter.
• If your chart timeframe isn’t 5m, behavior changes because lengths are in bars, not minutes. Tune lengths accordingly.
⸻
Disclaimers
This is a research tool. No signals are guaranteed. Markets change, outliers happen, slippage is real. Nothing here is financial advice—use your own judgment and risk management.
⸻
Author: DaddyScruff
License: MPL-2.0 (Mozilla Public License 2.0)

BND Trader (By Vahid.Jz) 🇮🇷🎉 The first Persian indicator on TradingView, released for free to celebrate my daughter's birthday. 🎉
**Trading Assistant (by Vahid.Jz)** is an all-in-one tool designed to simplify analysis and improve accuracy. It acts as an intelligent trading partner.
**Features:**
- Market Structure detection
- Multi-Timeframe “Third Eye” analysis
- Professional Order Blocks recognition
- Fair Value Gaps (FVGs) detection
- Customizable alerts
- Fully Persian interface
- Create Custom Alarm
Developed with love by **Vahid.Jz**, a trader and Pine Script enthusiast.
*“Trading is not a destination; it’s the journey — a path of learning, growth, and experience.”*

Tight Entry Trend Engine Strategy═══════════════════════════════════════
TIGHT ENTRY TREND ENGINE
═══════════════════════════════════════
A breakout-based trend-following system designed to capture explosive
moves by entering at precise resistance/support breakouts with minimal
entry risk and massive profit potential.
⚠️ LOW WIN RATE, HIGH REWARD SYSTEM ⚠️
This is NOT a high win-rate strategy. Expect 25-35% winners, but
when it hits, winners are typically 10X+ larger than losers.
═══════════════════════════════════════
🎯 WHAT THIS SYSTEM DOES
═══════════════════════════════════════
The Tight Entry Trend Engine identifies powerful breakout opportunities
by detecting when price breaks through established trendlines with
confirmation from higher timeframe trends:
1. DYNAMIC TRENDLINE DETECTION (3 BANKS)
• Automatically draws support and resistance trendlines
• 3 separate "banks" capture short-term, medium-term, and long-term levels
• Each bank has configurable parameters (required pivot touch count,
angle limits, lengths)
2. BREAKOUT ENTRY TIMING
• Enters LONG when price breaks ABOVE resistance trendlines
• Enters SHORT when price breaks BELOW support trendlines
• Entry Alert occurs at the exact moment of breakout = "tight entry"
• Stop-loss placed just below/above the broken trendline (configurable)
3. HIGHER TIMEFRAME TREND FILTER
• Uses Hull Moving Average (HMA) on higher timeframe for trend following
• Auto-adjusts HTF based on your chart timeframe
• Optional filters prevent entries against major trend
• Optional "overextension" filter avoids buying parabolic moves
4. VOLATILITY-ADAPTIVE RISK MANAGEMENT
• Stop-loss calculated using Average True Range (ATR)
• Tighter stops = better R:R
• Profit targets adjust dynamically with volatility
• Breakeven stop moves automatically when in profit
• Extended profit targets when far from HTF trend
═══════════════════════════════════════
📊 HOW IT WORKS (METHODOLOGY)
═══════════════════════════════════════
STEP 1: TRENDLINE FORMATION
The system continuously scans for pivot highs and pivot lows to
construct trendlines. You control:
BANK 1 (Short-Term):
- Pivot Length: How many bars to look back for swing points
- Min Touches: How many pivots needed to form a line (default: 3)
- Max Length: How far back lines can reach (default: 180 bars)
- Angle Limits: Maximum steepness allowed for valid trendlines
- Tolerance: How close pivots must align to form horizontal lines
BANK 2 (Medium-Term):
- Slightly longer pivot periods for more significant levels
- Captures medium-term trend structure
- Default Max Length: 200 bars
BANK 3 (Long-Term):
- Focuses on major support/resistance zones
- Often uses horizontal levels (angled lines disabled by default)
- Default Max Length: 300 bars
The system draws RESISTANCE lines (red) above price and SUPPORT
lines (green) below price. These adapt in real-time as new pivots form.
STEP 2: BREAKOUT DETECTION
LONG SIGNALS:
- Price closes above a resistance trendline
- Higher timeframe trend is up (optional filter)
- Price not overextended from HTF trend (optional filter)
- No position currently open
SHORT SIGNALS:
- Price closes below a support trendline
- Higher timeframe trend is down (optional filter)
- Price not overextended from HTF trend (optional filter)
- No position currently open
The "tight" aspect: Because you're entering right at the trendline
break, your stop-loss can be placed very close (just below the
broken resistance for longs), creating exceptional risk/reward ratios.
STEP 3: POSITION SIZING
Choose between:
- Fixed $ Risk Per Trade: Risk same dollar amount every trade
- % Risk Per Trade: Risk percentage of current equity
Position size automatically calculated based on:
- Your risk amount
- Distance to stop-loss (ATR-based)
- Works with stocks, futures, crypto (auto-adjusts for contract multipliers)
STEP 4: EXIT MANAGEMENT
Multiple exit methods working together:
- PROFIT TARGET: Exits when profit reaches 100x your risk
- EXTENDED PROFIT: Earlier exit (80R) when very far from HTF trend
- STOP LOSS: Fixed ATR-based stop below entry
- HTF TREND EXIT: Exits when price crosses below HTF trend with profit
- BREAKEVEN PULLBACK: Exits if profit drops below 0.6R after reaching breakeven
- PARTIAL PROFITS: Optional - take partial profits at specified R-multiple
═══════════════════════════════════════
🔧 KEY COMPONENTS EXPLAINED
═══════════════════════════════════════
HULL MOVING AVERAGE (HMA)
A smoothed moving average that reduces lag compared to traditional
MAs. The system uses HMA on a higher timeframe to determine the
dominant trend direction. You can choose:
- Auto HTF: System picks appropriate HTF based on your chart timeframe
- Manual HTF: You specify the higher timeframe
AVERAGE TRUE RANGE (ATR)
Measures current market volatility. Used for:
- Stop-loss distance (tighter when volatility low)
- Profit targets (larger when volatility high)
- Position sizing (smaller positions in volatile conditions)
- Breakeven trigger distance
TRENDLINE ANGLE FILTERING
Each trendline bank has angle limits to ensure quality:
- Resistance lines: Max downward/upward slope allowed
- Support lines: Max downward/upward slope allowed
- Angles automatically adjust based on current volatility
- Prevents overly steep/unreliable trendlines
SENSITIVITY CONTROL
One master slider adjusts multiple parameters:
- Trendline detection sensitivity
- HTF MA length
- Exit timing
- Auto-adjusts for daily+ timeframes (60% increase)
═══════════════════════════════════════
⚙️ WHAT YOU SEE ON YOUR CHART
═══════════════════════════════════════
TRENDLINES:
✓ Red resistance lines above price
✓ Green support lines below price
✓ Orange broken lines (past breakouts)
✓ Lines extend to show current levels
HTF TREND:
✓ Thick colored line showing higher timeframe trend
✓ Color gradient: Red (bearish) → Orange → Yellow → Green (bullish)
✓ 250-bar smoothed curve for visual clarity
ENTRY/EXIT SIGNALS:
✓ Small green dot below bar = Long entry
✓ Small red dot above bar = Short entry
✓ Small red dot above = Long exit
✓ Small black dot below = Short exit
OPTIONAL DETAILED LABELS:
✓ Bank number that triggered entry (Bank 1, 2, or 3)
✓ Exit reason (Profit Target, Stop Loss, HTF Exit, etc.)
✓ Partial profit notifications
POSITION TRACKING:
✓ Yellow dashed line at entry price (extends right)
✓ Green/red fill showing current profit/loss zone
✓ Lime arrows at top = Currently in long position
✓ Red arrows at bottom = Currently in short position
✓ Gray background = No position (flat)
STATS TABLE (Top Right):
✓ Current position (LONG/SHORT/FLAT)
✓ Risk per trade ($ or %)
✓ Entry price
✓ Unrealized P/L in dollars
✓ P/L in R-multiples (how many R's profit/loss)
✓ Average winner/loser R ($ mode) OR CAGR (% mode)
═══════════════════════════════════════
📈 OPTIMAL USAGE
═══════════════════════════════════════
BEST ASSETS:
- NASDAQ:QQQ on 1-hour (reg) chart ⭐ (PRIMARY OPTIMIZATION)
- Strong trending stocks: NVDA, AAPL, TSLA, MSFT, GOOGL, AMZN
- High volatility tech stocks
- Crypto: BTC, ETH
- Any liquid asset with clear trends and momentum (GOLD)
AVOID:
- Low volatility stocks
- Ranging/choppy markets
- Penny stocks or illiquid assets
- Assets without clear directional movement
BEST TIMEFRAMES:
- PRIMARY: 1-hour charts (optimal for QQQ)
- ALSO EXCELLENT: 2H, 4H, 8H
- WORKS: 15min, 30min (only momentum leaders, more noise)
- WORKS WITH ADJUSTMENTS: 1D, 2D (decrease trendline pivot lengths)
═══════════════════════════════════════
📊 BACKTEST RESULTS (QQQ 1H (Reg hours), 1999-2024)
═══════════════════════════════════════
The system showed on NASDAQ:QQQ 1-hour timeframe (regular hours):
- Total Return: 1,100,000%+ over 24 years
- Total Trades: 500+
- Win Rate: ~20-24% (LOW - this is by design!)
- Average Winner: 8-15% gain
- Average Loser: 2-4% loss
- Win/Loss Ratio: 10:1 (winners much bigger than losers)
- Profit Factor: 3+
- Max Drawdown: 45-50%
- Risk per trade: 3% of capital
KEY INSIGHT: This is a LOW WIN RATE, HIGH REWARD system. You will
lose more trades than you win, but the few winners are so large
they more than compensate for many small losses.
IMPORTANT: These are backtested results using optimal parameters
on historical data. Real trading results will vary based on:
- Your execution and timing
- Slippage and commissions
- Your emotional discipline
- Market conditions during your trading period
═══════════════════════════════════════
🎓 WHO IS THIS FOR?
═══════════════════════════════════════
IDEAL FOR:
✓ Swing traders comfortable holding winners for longer period
✓ Part-time traders (1H = check 2-3x per day)
✓ Traders seeking exceptional risk/reward ratios
✓ Those comfortable with low win rates if winners are huge
✓ Technical analysis enthusiasts
✓ Breakout traders
✓ Trend followers
═══════════════════════════════════════
🚀 GETTING STARTED - STEP BY STEP
═══════════════════════════════════════
STEP 1: APPLY TO YOUR CHART
- Search "Tight Entry Trend Engine" in indicators
- Click to apply to your chart
- Trendlines and HTF line will appear immediately
STEP 2: CHOOSE YOUR SETTINGS
For BEGINNERS - Use These Settings First:
1. Trade Direction & Filters:
• ENABLE LONGS: ✓ ON
• ENABLE SHORTS: ✗ OFF (start with longs only)
• Sensitivity: 1.0 (default)
• HTF Trend Entry Filter: ✓ ON (safer entries)
• Block Entries When Overextended: ✓ ON (avoid parabolic tops)
2. Position Sizing & Risk:
• Position Sizing: "Per Risk"
• RISK Type: "$ Per Trade"
• Risk Amount: $200 (or 1-3% of your account)
3. Visual Settings:
• Show Support Lines: ✗ OFF (unless trading shorts)
• Show Detailed Entry/Exit Labels: ✓ ON
• Show Stats Table: ✓ ON
• Show Entry Line & P/L Fill: ✓ ON
4. Leave everything else at DEFAULT for now
STEP 3: UNDERSTAND WHAT YOU SEE
When trendlines appear:
- RED lines above = Resistance (watch for price breaking UP through these)
- GREEN lines below = Support (watch for price breaking DOWN)
- When price breaks a red line = Potential LONG entry
- When price breaks a green line = Potential SHORT entry
The HTF trend line (thick colored):
- Green/lime = Strong uptrend (favorable for longs)
- Red = Strong downtrend (favorable for shorts if enabled)
- Orange/yellow = Transitioning
STEP 4: OBSERVE SIGNALS
- Small GREEN dot below bar = System entered LONG
- Small RED dot above bar = System exited LONG
- Check the label to see which "Bank" triggered (Bank 1, 2, or 3)
- Watch the yellow entry line and colored fill show your P/L
STEP 5: PAPER TRADE FIRST
- Use TradingView's paper trading feature
- Watch how signals perform on YOUR chosen asset
- Understand the win rate will be LOW (20-35%)
- Verify that winners are indeed much larger than losers
- Test for at least 20-30 signals before going live
STEP 6: OPTIMIZE FOR YOUR ASSET (OPTIONAL)
If default settings aren't working well:
For FASTER signals (more trades):
- Reduce Pivot Length 1 to 3-4
- Reduce Max Length 1 to 120-150
- Increase Sensitivity to 1.2-1.5
For SLOWER signals (higher quality):
- Increase Pivot Length 1 to 7-10
- Increase Max Length 1 to 250+
- Decrease Sensitivity to 0.7-0.9
For DAILY timeframes:
- Increase all Pivot Lengths by 30-50%
- Increase all Max Lengths significantly
- Sensitivity: 0.6-0.8
═══════════════════════════════════════
⚙️ ADVANCED SETTINGS EXPLAINED
═══════════════════════════════════════
TRENDLINE BANK SETTINGS:
Each bank (1, 2, 3) has these parameters:
- Min Touches: Minimum pivots to form a line
- Lower (2) = More lines, earlier detection
- Higher (4+) = Fewer lines, higher quality
- Pivot Length: Lookback for swing points
- Lower (3-5) = Reacts to recent price action
- Higher (10+) = Only major swing points
- Max Length: How old a trendline can be
- Shorter (100-150) = Only recent lines
- Longer (300+) = Include historical levels
- Tolerance: Alignment strictness for horizontal lines
- Lower (3.0-3.5) = Very strict horizontal
- Higher (4.5+) = More forgiving alignment
- Allow Angled Lines: Enable diagonal trendlines
- ON = Catches sloped support/resistance
- OFF = Only horizontal levels
- Angle Limits: Maximum steepness allowed
- Lower (1-2) = Only gentle slopes
- Higher (4-6) = Accept steeper angles
- Automatically adjusts for volatility
ATR MULTIPLIERS:
- STOP LOSS ATR (0.6): Distance to stop-loss
- Lower (0.4-0.5) = Tighter stops, stopped out more
- Higher (0.8-1.0) = Wider stops, more room
- PROFIT TARGET ATR (100): Main profit target
- This is 100x your risk = 10,000% R:R
- Lower (50-80) = Take profits sooner
- Higher (120+) = Let winners run longer
- BREAKEVEN ATR (40): When to move stop to breakeven
- Lower (20-30) = Protect profits earlier
- Higher (60+) = Give more room before protecting
HIGHER TIMEFRAME:
- Auto HTF: Automatically selects appropriate HTF
- 5min chart → uses 2H
- 15-30min → uses 6H
- 1-4H → uses 2D
- Daily → uses 4D
- HTF MA Length (300): HMA period for trend
- Lower (150-250) = More responsive
- Higher (400-500) = Smoother, less whipsaw
- HTF Trend Following Exit: Exits when crossing HTF
- ON = Additional exit method
- OFF = Rely only on profit targets/stops
- HTF Trend Entry Filter: Only trade with HTF trend
- ON = Safer, fewer signals
- OFF = More aggressive, more signals
- Block Entries When Overextended: Prevents chasing
- ON = Avoids parabolic tops/bottoms
- OFF = Enter all breakouts regardless
═══════════════════════════════════════
💡 TRADING PHILOSOPHY & EXPECTATIONS
═══════════════════════════════════════
This system is built on one core principle:
"ACCEPT SMALL, FREQUENT LOSSES TO CAPTURE RARE, MASSIVE WINS"
What this means:
- You WILL lose 65%-75% of your trades
- Most losses will be small (1-2R)
- Some winners hit 80R+
- Over time, math works in your favour

Supply & Demand Zones [QuantAlgo]🟢 Overview
The Supply & Demand (Support & Resistance) Zones indicator identifies price levels where significant buying and selling pressure historically emerged, using swing point analysis and pattern recognition to mark high-probability reversal and continuation areas. Unlike conventional support/resistance tools that draw arbitrary horizontal lines, this indicator can automatically detect structural zones, offering traders systematic entry and exit levels where institutional order flow likely congregates across any market or timeframe.
🟢 How to Use
# Zone Types:
Green/Demand Zones: Support areas where buying pressure historically emerged, representing potential long entry opportunities where price may bounce or consolidate before moving higher. These zones mark levels where buyers previously overcame sellers.
Red/Supply Zones: Resistance areas where selling pressure historically dominated, indicating potential short entry opportunities where price may reverse or stall before declining. These zones identify levels where sellers previously overwhelmed buyers.
# Zone Pattern Types:
Wick Rejection Zones: Zones created from candles with exceptionally long wicks showing violent price rejection. A demand rejection occurs when price drops sharply but closes well above the low, forming a long lower wick (relative to the total candle range) that demonstrates buyers aggressively defending that level. A supply rejection shows price spiking higher but closing well below the high, with the long upper wick proving sellers rejected that price aggressively. These zones often represent major institutional orders that absorbed significant market pressure. The rejection wick ratio setting controls how prominent the wick must be (higher ratios require more dramatic rejections and produce fewer but higher-quality zones).
Continuation Demand Zones: Areas where price rallied upward, paused in a brief consolidation base, then rallied again. This pattern confirms strong buying continuation (the consolidation represents profit-taking or minor pullbacks that failed to attract meaningful selling). When price returns to these zones, buyers who missed the initial rally often provide support, making them high-probability long entries within established uptrends. These zones follow the classic Rally-Base-Rally structure, demonstrating that buyers remain in control even during temporary pauses.
Reversal Demand Zones: Zones where price dropped, formed a consolidation base, then reversed into a rally. This structure marks potential trend reversals or major swing lows where buyers finally overwhelmed sellers after a decline. The base period represents accumulation by stronger hands, and these zones frequently appear at market bottoms or as significant pullback support within larger uptrends, signaling shifts in market control. These zones follow the Drop-Base-Rally pattern, showing the moment when selling pressure exhausted and buying interest emerged.
Continuation Supply Zones: Areas where price dropped, consolidated briefly, then dropped again. This pattern demonstrates strong selling continuation (the pause represents temporary buying attempts that failed to generate meaningful recovery). When price returns to these zones, sellers who missed the initial decline often provide resistance, creating short entry opportunities within established downtrends. These zones follow the Drop-Base-Drop structure, confirming that sellers maintain dominance even during temporary consolidations.
Reversal Supply Zones: Zones where price rallied upward, formed a consolidation base, then reversed into a decline. This formation identifies potential trend reversals or major swing highs where sellers overcame buyers after an advance. The base period often represents distribution by institutional participants, and these zones commonly appear at market tops or as key pullback resistance within larger downtrends, marking transfers of market control from buyers to sellers. These zones follow the Rally-Base-Drop pattern, capturing the transition point when buying exhaustion meets aggressive selling.
# Zone Mitigation Methods:
Wick Mitigation: Zones become invalidated immediately upon first contact by any wick. This assumes zones work only on their initial test, reflecting the belief that institutional orders concentrated at these levels get completely filled on first touch. Best for traders seeking only the highest-probability, untested zones and willing to accept that zones invalidate frequently in volatile markets. When price touches a zone boundary with even a single wick, that zone is considered "used up" and becomes mitigated.
Close Mitigation: Zones remain valid through wick penetration but become invalidated only when a candle closes through the zone boundary. This method allows price to briefly probe the zone with wicks while requiring actual commitment (a close) for invalidation. Suitable for traders who recognize that zones can withstand initial tests and prefer filtering out false breakouts caused by temporary volatility or liquidity hunts. A zone stays active as long as candles close within or outside it, regardless of wick penetration, until a close occurs beyond the boundary.
Full Body Mitigation: Zones stay valid until an entire candle body exists completely beyond the zone boundary, meaning both the open and close must be outside the zone. This approach maintains zone validity through partial penetrations, accommodating the reality that institutional zones can absorb considerable price action before exhausting. Ideal for volatile markets or traders who believe zones represent price ranges rather than precise levels, and who want zones to persist through aggressive but ultimately rejected breakout attempts. Only when both the open and close of a candle are beyond the zone does it become mitigated.
🟢 Pro Tips for Trading and Investing
→ Preset Selection: Choose presets matching your preferred timeframe - Scalping (M1-M30) for aggressive detection on minute charts, Intraday (H1-H12) for balanced filtering on hourly timeframes, or Swing Trading (1D+) for strict filtering on daily charts. Each preset automatically optimizes swing length, zone strength, and max zone counts for the selected timeframe.
→ Input Calibration: Adjust Swing Length based on market speed (lower values 3-7 for fast markets, higher values 12-20 for slower markets). Set Minimum Zone Strength according to asset volatility (0.05-0.15% for low-volatility assets, 0.25-0.5% for high-volatility assets). Tune Rejection Wick Ratio higher (0.6-0.8) for strict wick filtering or lower (0.3-0.5) to capture more subtle rejections.
→ Zone Pattern Toggle Strategy: Pattern types are mutually exclusive - enable Continuation OR Reversal patterns for each zone type, not both together. Recommended combinations: For trend trading, enable Rejection + Continuation (2-4 toggles total). For reversal trading, enable Rejection + Reversal (2-4 toggles). For scalping, enable only Rejection zones (1-2 toggles). Maximum 3-4 active toggles provides optimal chart clarity. A simple Wick Rejection toggle can also work on virtually any market and timeframe.
→ Mitigation Method Selection: Use Wick mitigation in clean trending markets for strict zone invalidation on first touch. Use Close mitigation in moderate volatility to filter out temporary spikes. Use Full Body mitigation in highly volatile markets to keep zones active through whipsaws and false breakouts.
→ Alert Configuration: Utilize built-in alerts for new zone creation, zone touches, and zone breaks. New zone alerts notify when fresh supply/demand areas form. Zone touch alerts signal potential entry opportunities as price reaches zones. Zone break alerts indicate when levels fail, signaling possible trend acceleration or structure changes.

Trend Catcher and Mean ReversionPlease DM if you want to use this strategy.
it took long time to make this code profitable using 3 parameters only!
it allow you to:
1- Pyramid as you see fit.
2- allow option to use trend catching strategy ( while keeping mean reversion strategy)
3- Time filter to limit trading and exit at your preferred time.
4- it works for long, short or both positions.
5- has trailing tp as an option as well while keeping initial sl as hard stop
6- tp multiple (of stop loss) is optional
ongoing working for alerts and automation. More on that for subscribers only.
i will charge the minimum fee to utilize this code as we don't need your money but we need people to support our vision.

Smooth Cloud + ZigZag VPOC CORE v6📌 Description
The Smooth Cloud + ZigZag VPOC indicator is designed to help traders visualize market structure and potential confluence zones.
Smooth Cloud: Built from smoothed moving averages (EMA, RMA, or HMA), this cloud highlights the underlying short-term trend by shading bullish and bearish phases.
Pivots (ZigZag style): Marks confirmed swing highs and lows, helping to identify support/resistance and breakout areas without repainting.
VPOC (Volume Point of Control): Plots the price level with the highest traded volume, either from a rolling lookback or anchored to a custom date. This often acts as a magnet or reaction level.
ATR Bands: Optional dynamic bands based on volatility to frame potential extension zones.
Signals & Alerts: Generates long/short labels when price breaks pivot levels in line with trend filters, with optional confluence from HTF trend, VPOC, and ATR.
This tool combines trend context, structure, and volume confluence in a single view to support decision-making.
✅ Notes
This script is intended for technical analysis and educational use only.
It does not provide financial advice or guaranteed outcomes.
Signals are purely analytical and should be combined with independent risk management.

Multi-Timeframe MACD with Color Mix (Nikko)Multi-Timeframe MACD with Color Mix (Nikko) Indicator
This documentation explains the benefits of the "Multi-Timeframe MACD with Color Mix (Nikko)" indicator for traders and provides easy-to-follow steps on how to use it. Written as of 05:06 AM +07 on Saturday, October 04, 2025, this guide focuses on helping you, as a trader, get the most out of this tool with clear, practical advice before diving into the technical details.
Benefits for Traders
1. Multi-Timeframe Insight
This indicator lets you see momentum trends across 15-minute, 1-hour, 1-day, and 1-week timeframes all on one chart. This big-picture view helps you catch both quick market moves and long-term trends without flipping between charts, saving you time and giving you a fuller understanding of the market.
2. Visual Momentum Representation
The background changes from red to green based on short-term (15m) momentum, giving you a quick, easy-to-see signal—red means bearish (prices might drop), and green means bullish (prices might rise). The histogram uses a mix of red, green, and blue colors to show the combined strength of the 1-hour, 1-day, and 1-week timeframes, helping you spot strong trends at a glance (e.g., a bright mix for strong momentum, darker for weaker).
3. Enhanced Decision-Making
The background and histogram colors work together to confirm trends across different timeframes, making it less likely you’ll act on a false signal. This helps you feel more confident when deciding when to buy, sell, or hold.
4. Proactive Alert System
You can set alerts to notify you when the percentage of bullish timeframes hits your chosen levels (e.g., below 10% for bearish, above 90% for bullish). This keeps you in the loop on big momentum shifts without needing to watch the chart all day—perfect for when you’re busy.
5. Flexibility and Efficiency
You can turn timeframes on or off, adjust settings like speed of the moving averages, and tweak transparency to fit your trading style—whether you’re a fast scalper or a patient swing trader. Everything is shown on one chart, saving you effort, and the colors make it simple to read, even if you’re new to trading.
How to Use It
Getting Started
Add the Indicator: Load the "Multi-Timeframe MACD with Color Mix (Nikko)" onto your TradingView chart using the Pine Script editor or indicator library.
Pick Your Timeframes: Turn on the timeframes that match your trading—use 15m and 1h for quick trades, or 1d and 1w for longer holds—using the enable_15m, enable_1h, enable_1d, enable_1w, and enable_background options.
Reading the Colors
Background Gradient: Watch for red to signal bearish 15m momentum and green for bullish momentum. Adjust the Background_transparency (default 75%, or 25% opacity) if the chart feels too busy—try lowering it to 50 for clearer candlesticks in fast markets.
Histogram and EMA Colors:
The histogram and its Exponential Moving Average (EMA) line show a mix of red (1-week), green (1-day), and blue (1-hour) based on how strong the momentum is in each timeframe.
Brighter colors mean stronger momentum—white (all bright) shows all timeframes are pushing up hard, while darker shades (like gray or black) mean weaker or mixed momentum.
Turn off a timeframe (e.g., enable_1h = false) to see how it changes the color mix and focus on what matters to you.
Setting Alerts
Set Your Levels: Choose a threshold_low (default 10%) and threshold_high (default 90%) based on your comfort zone or past market patterns to catch big turns.
Get Notifications: Use TradingView alerts to get pings when the market hits your set levels, so you can act without staring at the screen.
Practical Tips
Pair with Other Tools: Use it with support/resistance lines or the RSI to double-check your moves and build a solid plan.
Tweak Settings: Adjust fast_length, slow_length, and signal_smoothing to match your asset’s speed, and bump up the lookback (default 50) for steadier trends in wild markets.
Practice First: Test different timeframe combos on a demo account to find what works best for you.
Understanding the Colors (Simple Explanation)
How Colors Work
The histogram and its EMA line use a color mix based on a simple idea from color theory, like mixing paints with red, green, and blue (RGB):
Red comes from the 1-week timeframe, green from 1-day, and blue from 1-hour.
When all three timeframes show strong upward momentum, they blend into bright white—the brightest color, like a super-bright light telling you the market’s roaring up.
If some timeframes are weak or pulling down, the mix gets darker (like gray or black), warning you the momentum might not be solid.
Brighter is Better
Bright Colors = Strong Opportunity: The brighter the histogram and EMA (closer to white), the more all your chosen timeframes are in agreement that prices are rising. This is your signal to think about buying or holding, as it points to a powerful trend you can ride.
Dark Colors = Caution: A darker mix (toward black) means some timeframes are lagging or bearish, suggesting you might wait or consider selling. It’s like a dim light saying, “Hold on, check again.”
Benefit in Practice: Watching the brightness helps you jump on the best trades fast. For example, a bright white histogram on a green background is like a green traffic light—go for it! A dark gray on red is like a red light—pause and rethink. This quick color check can save you from bad moves and boost your profits when the trend is strong.
Why It Helps
These colors are your fast friend in trading. A bright histogram means all your timeframes are cheering for an uptrend, giving you the confidence to act. A dull one tells you to be careful, helping you avoid traps. It’s like having a color-coded guide to pick the hottest market moments!
Technical Details
Input Parameters
Fast Length (default: 12): Short-term moving average speed.
Slow Length (default: 26): Long-term moving average speed.
Source (default: close): Price data used.
Signal Smoothing (default: 9): Smooths the signal line.
MA Type (default: EMA): Choose EMA or SMA.
Timeframe and Scaling
Timeframes: 15m, 1h, 1d, 1w, with on/off switches.
Lookback Period (default: 50): Sets the data window for trends.
Background Transparency (default: 75%): Controls background see-through level.
MACD Calculation
Per Timeframe: Uses request.security():
MACD Line: ta.ema(src, fast_length) - ta.ema(src, slow_length).
Signal Line: ta.ema(MACD, signal_length).
Histogram: (macd - signal) / 3.0.
Background Gradient
15m Normalization: norm_value = (hist_15m - hist_15m_min) / max(hist_15m_range, 1e-10), limited to 0-1.
RGB Mix: Red drops from 255 to 0, green rises from 0 to 255, blue stays 0.
Apply: color.new(color.rgb(r_val, g_val, b_val), Background_transparency).
Histogram and EMA Colors
Color Assignment:
1h: Blue (#0000FF) if hist_1h >= 0, else black.
1d: Green (#00FF00) if hist_1d >= 0, else black.
1w: Red (#FF0000) if hist_1w >= 0, else black.
Final Color: final_color = color.rgb(min(r, 255), min(g, 255), min(b, 255)).
Plotting: Histogram and EMA use final_color; MACD (#2962FF), signal (#FF6D00).
Alerts
Bullish Percentage: bullish_pct = (bullish_count / bullish_total) * 100, counting hist >= 0.
Triggers: Below threshold_low or above threshold_high.
--------------------------------------------------------------------
Conclusion
The "Multi-Timeframe MACD with Color Mix (Nikko)" is your all-in-one tool to spot trends, confirm moves, and trade smarter with its bright, easy-to-read colors. By using it wisely, you can sharpen your market edge and trade with more confidence.
This README is tailored for traders and reflects the indicator's practical value as of 05:06 AM +07 on October 04, 2025.

TrendLock Pro 2 — Dual Trend Confirmation📊 TrendLock Pro 2 — Dual Trend Confirmation
🔒 Trade only when the trend is locked and confirmed
TrendLock Pro is a professional no-repaint indicator designed for traders who want to cut through market noise and only capture validated opportunities.
It combines two powerful filters:
TrendScope (current timeframe) → fast detection of momentum shifts through an intelligent RSI setup.
Flow Guard (higher timeframe) → directional filter that only confirms trades aligned with the macro trend.
👉 The result: you only enter when both trends agree , ensuring dual validation before every trade.
🚀 Key Features
✅ No Repaint : signals remain reliable once printed.
✅ Dual Validation : micro-trend (M1, M5…) confirmed by the macro-trend (M15, M30…).
✅ Smart Filters : reduces false signals against the main trend.
✅ Versatile : ideal for M1 scalping, intraday trading, or swing setups.
✅ Built-in Alerts : get notified only when confirmation is strong.
✅ Clear Visuals : green diamonds for confirmed LONGs, red diamonds for confirmed SHORTs.
🎯 Who is it for?
Scalpers seeking safer entries.
Day traders looking to avoid counter-trend traps.
Swing traders preferring cleaner, filtered setups.
💡 Usage Tips
📉 Using Heikin Ashi candles smooths signals and makes them easier to read.
🛡️ Always place your Stop Loss wisely: the indicator doesn’t predict the future but analyzes real-time multi-timeframe trends.
🎯 Avoid being too greedy with Take Profits — aim for balanced targets to maintain a strong win rate.
⚡ Two trends, one signal. Trade with confirmation.
