Simple Trade by exp3rtsSimple Trade by exp3rts – A versatile TradingView strategy designed for precision and flexibility. This script allows automated trading based on customizable conditions with full control over trend direction, session timing, and lookback periods.
Key Features:
Directional Control: Trade only Long, Short, or Both directions.
Automatic Trend Detection: Uses EMA 50 and EMA 200 to determine bullish or bearish market conditions.
Customizable Lookbacks: Set independent lookback periods for Buy, Buy-Close, Sell, and Sell-Close using Open, High, Low, or Close prices.
Session Filtering: Restrict trades to specific market hours to avoid overnight or off-session exposure.
Tick-Based Auto-Close: Automatically close trades after a defined tick movement.
Session-End Auto-Close: Ensures no position remains open beyond the selected session.
Visual Alerts: Arrows on the chart for Buy, Sell, and Close events.
Webhook Alerts: JSON alerts for Buy, Sell, and Close actions for easy integration with trading bots.
Perfect for traders who want a simple yet highly configurable trading strategy with risk control, trend awareness, and automated trade management.
Trade

Trendline and SR System [BullByte]TRENDLINE AND SR SYSTEM
From Manual Drawing to Intelligent Automation
═════════════════════════════════════════════════════════════
OVERVIEW
This indicator automates years of manual chart work: detecting trendlines, forming support/resistance zones, tracking zone lifecycles, and scoring touches by quality. Instead of counting touches equally, the system weights them by precision, reaction type and volume so a high-volume wick rejection gets more influence than a low-volume consolidation.
The core philosophy is simple: not all touches are equal. A wick rejection at high volume carries more weight than a body consolidation at low volume. A zone that held three times deserves more attention than one that just formed. This indicator captures that nuanced approach through a quality-weighted touch scoring system.
═════════════════════════════════════════════════════════════
THE PROBLEM THIS SOLVES
Manual technical analysis presents several challenges:
1. Time Consumption - Drawing and updating trendlines across multiple assets and timeframes is labor-intensive
2. Subjectivity - Two traders often draw different lines on the same chart
3. Inconsistency - Fatigue leads to missed levels or inconsistent criteria
4. Delayed Updates - Manually tracking when zones break, get retested, or flip takes constant attention
This system addresses each challenge by applying consistent mathematical criteria to every potential level, updating in real-time, and tracking zone lifecycle automatically.
═════════════════════════════════════════════════════════════
HOW IT WORKS
--- TRENDLINE DETECTION ---
The system identifies trendlines through a multi-step process:
Step 1: Pivot Detection
The indicator scans for significant swing highs and swing lows using a sensitivity parameter that automatically scales based on your chart timeframe. Shorter timeframes use faster detection, while daily charts use slower, more significant pivots.
Step 2: Line Validation
For each pair of pivots, the system calculates:
- Slope direction (upward for bullish, downward for bearish)
- Current relevance (is the projected line near current price?)
- Minimum touch requirements
Step 3: Touch Quality Scoring
This is where the system differs from simple trendline indicators. Each touch is scored based on:
Precision: How close did price get to the line? A touch at the exact line scores 1.0, while a touch at the edge of tolerance scores lower.
Reaction Type: The system classifies touches into categories:
* Wick Rejection (1.0) - Wick touched but body stayed outside
* Body Rejection (0.8) - Body touched but closed with reaction
* False Break (1.2) - Price broke through then recovered (strongest signal)
* Consolidation (0.5) - Price lingered without clear rejection
Volume Weight: When volume integration is enabled, high-volume touches receive a boost (up to 1.5x), while low-volume touches are discounted (down to 0.5x).
Step 4: Display Filtering
Only trendlines meeting minimum touch count AND minimum average precision are displayed. This eliminates weak, coincidental alignments.
--- SUPPORT AND RESISTANCE ZONES ---
Zones are detected from pivot points and horizontal level clustering:
Pivot-Based Zones:
When a significant pivot forms, a zone is created around that price level. Zone height is calculated as an ATR multiple, automatically scaling with volatility.
Cluster-Based Zones:
The system scans historical bars to find where multiple highs or lows align within tolerance. These horizontal rejection clusters often mark institutional interest levels.
Zone Merging:
When two zones are within a configurable distance, they merge into one stronger zone rather than cluttering the chart.
--- ZONE LIFECYCLE MANAGEMENT ---
This is the core innovation. Zones progress through states:
ACTIVE: Newly formed zone, not yet validated
TESTED: Zone has received 3+ quality touches, proving its relevance
BROKEN: Price closed through the zone
RETESTED: Price returned to test the broken zone
FLIPPED: Former support now acts as resistance (or vice versa)
Each state is visually distinct:
- Active zones show in standard support/resistance colors
- Tested zones show in blue with thicker borders
- Broken zones fade to gray
- Retested zones show in orange
- Flipped zones show in purple
Zone Decay:
Zones that price ignores gradually lose strength. The decay rate is configurable (default 0.997 per bar). This means a zone loses roughly half its strength after 230 bars of no interaction. This prevents old, irrelevant levels from cluttering your chart.
Zone Reactivation:
If price returns to a decayed zone, it receives a strength boost, recognizing that the level remains relevant.
═════════════════════════════════════════════════════════════
READING THE VISUAL ELEMENTS
--- TRENDLINES ---
Label Format:
Examples :
- B3 = Bullish trendline with 3 touches (active)
- B5x = Bullish trendline with 5 touches (broken)
- R4 = Bearish/Resistance trendline with 4 touches (active)
Line Thickness:
- Thin lines = 2-3 touches
- Thick lines = 4+ touches (higher significance)
Line Style:
- Solid = Active trendline
- Dotted = Broken trendline
--- ZONES ---
Label Format :
Examples :
- S2 = Support zone with 2 touches (active)
- S4+ = Support zone with 4 touches (tested/validated)
- R3x = Resistance zone with 3 touches (broken)
- S5r = Support zone retested after break
- R4f = Resistance zone that flipped to support
Border Thickness:
- Thin border = Standard zone
- Thick border = Validated zone (3+ touches or high volume)
Zone Colors by State:
- Teal/Green shades = Support zones
- Red shades = Resistance zones
- Blue = Tested/validated zones
- Gray = Broken zones
- Orange = Retested zones
- Purple = Flipped zones
--- DAILY AND WEEKLY LEVELS ---
PDH = Previous Day High
PDL = Previous Day Low
PWH = Previous Week High
PWL = Previous Week Low
HTF R = Higher Timeframe Resistance
HTF S = Higher Timeframe Support
These levels use dashed lines by default and extend from the period open.
--- BREAKOUT MARKERS ---
When a trendline breaks, the system places a "BRK" label at the breakout point.
Marker Size (when volume integration enabled):
- Tiny = Normal volume breakout
- Small = Above-average volume breakout
- Normal = High volume breakout (1.5x+ average)
Recent breakouts show full labels; older breakouts show as dots.
═════════════════════════════════════════════════════════════
THE DASHBOARD EXPLAINED
The information panel displays real-time metrics organized in sections:
--- TRENDLINES SECTION ---
Bull TL: Count of active bullish trendlines
Bear TL: Count of active bearish trendlines
Near B: Price level of nearest bullish trendline
Near R: Price level of nearest bearish trendline
--- S/R ZONES SECTION ---
Support: Nearest support zone price
Resist: Nearest resistance zone price
Dist: Percentage distance to each zone
Touches: Touch count of nearest zones
Quality: Quality score of nearest zones (higher = stronger)
--- DAILY LEVELS SECTION ---
PDH/PDL: Previous day high and low prices
Dist : Percentage distance from current price
Green percentage = price is above the level
Red percentage = price is below the level
--- WEEKLY LEVELS SECTION ---
PWH/PWL: Previous week high and low prices
Dist: Percentage distance from current price
--- ANALYSIS SECTION ---
R:R: Risk-to-Reward ratio based on distance to nearest support (risk) and resistance (reward). Ratios of 2:1 or higher show in green.
Bias: Market direction assessment based on:
- Trendline count comparison
- Distance to support vs resistance
- Zone quality comparison
- Price position relative to 50 SMA
Sup Zones / Res Zones: Count of active zones
Flipped / Retested: Count of zones in these states
Trend: Trend strength based on moving average alignment (Strong Bull to Strong Bear)
Volatility: Current ATR relative to 50-period average (High/Normal/Low)
Vol Ratio: Current volume relative to 20-period average
Vol Wgt: Volume weighting status (ON/OFF)
═════════════════════════════════════════════════════════════
TIMEFRAME ADAPTATION
The indicator automatically adjusts its parameters based on your chart timeframe:
SCALP MODE (Under 15 minutes)
- Faster pivot detection
- Tighter zone heights
- More responsive to recent price action
- Dashboard shows tag
INTRADAY MODE (15 minutes to 1 hour)
- Standard parameters
- Balanced sensitivity
- Dashboard shows tag
SWING MODE (1 hour to 4 hours)
- Slower pivot detection
- Wider zone heights
- Focus on more significant levels
- Dashboard shows tag
POSITION MODE (Daily and above)
- Slowest detection for major levels only
- Widest zones for higher timeframe context
- Dashboard shows tag
This means you can use the same settings across all timeframes, and the indicator adapts appropriately.
═════════════════════════════════════════════════════════════
SETTINGS GUIDE
--- TRENDLINE SETTINGS ---
Show Trendlines: Master toggle for all trendline visibility
Base Pivot Sensitivity: Controls how many bars the system looks back to identify pivots. Lower values find more pivots; higher values find only significant ones. Default 10 works well for most cases.
Minimum Touches: How many touches a trendline needs before displaying. Default 3 filters out weak lines.
Minimum Precision Score: Average touch quality required. Range 0.3 to 0.95. Default 0.6 provides good balance. Higher values show only the most precise trendlines.
Max Bullish/Bearish Trendlines: Limits how many lines display to prevent clutter.
Touch Tolerance ATR Mult: How close price must get to count as a touch, measured in ATR. Default 0.5 ATR works for most markets.
Extend Lines Right: Whether trendlines project into the future.
--- SUPPORT RESISTANCE SETTINGS ---
Show SR Zones: Master toggle for zone visibility
Base Zone Detection Length: Pivot lookback for zone creation. Similar to trendline sensitivity.
Base Zone Height ATR Mult: How tall zones are, as ATR multiple. Default 0.5 ATR. Increase for volatile markets.
Max Support/Resistance Zones: Limits displayed zones.
Zone Merge Distance ATR: Zones within this distance combine. Prevents duplicate zones at similar prices.
Zone Decay Rate: How quickly ignored zones fade. Default 0.997 means ~50% strength after 230 bars. Lower values mean faster decay.
Reactivation Boost: Strength multiplier when price returns to a zone. Default 1.3 (30% boost).
Detect Rejection Levels: Enables horizontal cluster detection.
Min Rejections for Level: How many aligned highs/lows needed to form a horizontal level.
Rejection Lookback Bars: How far back to scan for clusters. Lower values improve performance.
--- VOLUME INTEGRATION ---
Enable Volume Weighting: When on, volume affects touch quality and breakout significance.
High Volume Threshold: Volume ratio above this is considered significant. Default 1.5 (50% above average).
Low Volume Threshold: Volume ratio below this is considered weak. Default 0.7 (30% below average).
Volume Average Lookback: Bars used for average volume calculation.
--- DAILY LEVELS ---
Show PDH/PDL: Toggle previous day levels
Show Weekly H/L: Toggle previous week levels
Line Style: Solid, Dashed, or Dotted
--- MULTI-TIMEFRAME ---
Show HTF Levels: Toggle higher timeframe reference levels
Higher Timeframe: Select the reference timeframe
HTF Lookback Period: How many HTF bars to scan for high/low
--- LABEL SETTINGS ---
Label Mode:
- Compact: Shows type, touch count, and status (S3+)
- Minimal: Shows type only (S)
- None: Hides all labels
Hide Labels Beyond ATR Threshold: Reduces label clutter for distant levels
Max Labels to Display: Limits total labels to prevent overcrowding
--- DASHBOARD ---
Show Dashboard: Toggle the information panel
Position: Choose corner or center placement
Size: Tiny, Small, Normal, or Large text
--- THEME ---
Color Theme: Choose from Dark, Light, Neon, Classic, or Ocean presets. Each theme adjusts all colors for consistency.
--- VISUAL SETTINGS ---
Major/Minor Line Width: Thickness for significant vs standard lines
Show Breakout Markers: Toggle breakout event labels
═════════════════════════════════════════════════════════════
PRACTICAL USAGE
--- FOR TREND FOLLOWING ---
Watch for price respecting bullish trendlines in uptrends. Multiple touches with clean rejections indicate strong trend structure. A break below a well-tested trendline (4+ touches, high precision) often signals trend weakness.
--- FOR REVERSAL TRADING ---
Look for flipped zones (purple). A former resistance that now acts as support represents a genuine shift in market structure. Retested zones (orange) offer potential entry points as price confirms the level.
--- FOR BREAKOUT TRADING ---
Monitor tested zones (blue, 3+ touches). These validated levels, when broken with high volume (large BRK marker), often lead to significant moves. The R:R ratio in the dashboard helps assess if the breakout offers favorable risk-reward.
--- FOR MULTI-TIMEFRAME ANALYSIS ---
The HTF levels provide context. When an intraday support zone aligns with a daily support level (HTF S), that confluence adds significance. The dashboard shows distances to help identify these alignments.
--- FOR RISK MANAGEMENT ---
Use zone levels for stop placement. The dashboard R:R calculation shows reward-to-risk based on distance to nearest zones. Zones with higher quality scores have historically held better.
═════════════════════════════════════════════════════════════
WHAT MAKES THIS ORIGINAL
This is not a simple combination of existing indicators. The originality lies in:
1. Quality-Weighted Touch Scoring
Most trendline indicators count touches equally. This system scores each touch based on precision, reaction type, and volume, then filters by average quality. This eliminates many false positives that plague simple touch-counting approaches.
2. Zone Lifecycle State Machine
Rather than static boxes, zones evolve through states (active, tested, broken, retested, flipped) with distinct visual treatment and strength adjustments. This mirrors how experienced traders mentally track levels.
3. Decay and Reactivation System
Zones that price ignores fade naturally, while zones that price returns to strengthen. This creates a self-cleaning chart where only relevant levels remain prominent.
4. Timeframe-Adaptive Parameters
Instead of requiring different settings for each timeframe, the system automatically scales its detection parameters. The same configuration works from 1-minute to monthly charts.
5. Volume-Integrated Significance
When enabled, volume affects every calculation: touch quality, zone strength, and breakout marker prominence. High-volume events receive appropriate emphasis.
6. Synergistic Component Integration
Trendlines, zones, daily levels, and HTF reference work together. The dashboard synthesizes all components into actionable metrics like R:R ratio and market bias.
═════════════════════════════════════════════════════════════
ALERTS AVAILABLE
- Bullish Trendline Break: Triggers when price breaks below a bullish trendline
- Bearish Trendline Break: Triggers when price breaks above a bearish trendline
- Approaching Support: Triggers when price nears a support zone
- Approaching Resistance: Triggers when price nears a resistance zone
- PDH Test: Triggers when price tests previous day high
- PDL Test: Triggers when price tests previous day low
- Zone Retest: Triggers when price returns to a broken zone
- Zone Flip: Triggers when a broken zone confirms as flipped
═════════════════════════════════════════════════════════════
BACKGROUND COLOR INDICATOR
The chart background subtly changes color when price approaches key levels:
- Green tint: Price near support zone
- Red tint: Price near resistance zone
- Yellow tint: Price near both support and resistance (compression)
- No color: Price in open space between levels
This provides at-a-glance awareness without requiring constant dashboard monitoring.
═════════════════════════════════════════════════════════════
PERFORMANCE NOTES
The indicator is optimized for performance through:
- Calculation throttling for intensive operations
- Capped loop iterations to prevent script timeout
- Efficient array management
- Sampling techniques for historical scanning
If you experience slow loading on very long charts, consider reducing:
- Rejection Lookback Bars
- Max Zones settings
- Disabling Detect Rejection Levels temporarily
═════════════════════════════════════════════════════════════
NON-REPAINTING CONFIRMATION
This indicator uses confirmed bar data:
- Pivots are detected using historical lookback (not current bar)
- Zone states change only on bar close
- Trendline breaks are confirmed on bar close
- Alerts trigger only after bar confirmation
The only real-time updates occur on the current forming bar for visual purposes. All historical drawings remain fixed once their bar closes.
═════════════════════════════════════════════════════════════
DISCLAIMER
This indicator is for educational and informational purposes only. It does not constitute financial advice, investment recommendations, or trading signals.
Trading involves substantial risk of loss. Past performance of any trading system or methodology is not necessarily indicative of future results. You should not trade with money you cannot afford to lose.
The author makes no guarantees regarding the accuracy or completeness of any information provided. All trading decisions are your own responsibility.
Always conduct your own research and consider consulting with a qualified financial advisor before making any investment decisions.
═════════════════════════════════════════════════════════════
CREDITS AND ACKNOWLEDGMENTS
This indicator was developed to solve the manual charting experience, observing how price interacts with technical levels, and translating those observations into systematic rules.
Thank you to the TradingView community for the platform and Pine Script language that makes this automation possible.
═════════════════════════════════════════════════════════════
VERSION HISTORY
v1.0.0 - Initial Release
- Automatic trendline detection with quality-weighted touches
- Dynamic support/resistance zones with lifecycle management
- Volume integration for touch and breakout significance
- Multi-timeframe daily/weekly/HTF levels
- Comprehensive dashboard with real-time metrics
- Timeframe-adaptive parameter scaling
- Multiple theme options
- Complete alert system
═════════════════════════════════════════════════════════════

Liquidation Map [Alpha Extract]A sophisticated liquidity distribution visualization system that identifies potential liquidation zones through pivot-based detection and renders them as an interactive histogram with cumulative distance-to-liquidation curves. Utilizing multi-exchange volume aggregation and ATR-scaled pocket detection, this indicator delivers institutional-grade liquidity mapping with real-time histogram display showing relative concentration of long and short liquidation levels across configurable price ranges. The system's box-based rendering architecture combined with cumulative distribution overlays provides comprehensive visual assessment of asymmetric liquidity positioning for strategic trade planning.
🔶 Advanced Multi-Exchange Aggregation Framework
Implements intelligent ticker detection and multi-source volume aggregation across major exchanges including Binance, Bybit, KuCoin, OKX, and MEXC for accurate liquidity weight calculations. The system automatically identifies base currency (BTC, ETH, SOL) from chart ticker, retrieves volume data from matching perpetual contracts across multiple venues, and aggregates into composite volume metric for enhanced pocket weighting accuracy.
🔶 Pivot-Based Liquidation Pocket Detection
Features sophisticated swing point identification using configurable pivot width with ATR-scaled vertical zone construction for volatility-adaptive pocket sizing. The system detects pivot highs for short liquidation zones (placed above swing) and pivot lows for long liquidation zones (placed below swing), applying 200-period ATR with percentage multipliers to determine pocket heights that adjust to market volatility conditions.
🔶 Interactive Histogram Visualization Engine
Provides real-time box-based histogram rendering in indicator pane with configurable bin counts (up to 400 columns) and adjustable height, displaying liquidity concentration across fixed percentage range above and below current price. The system calculates bin sizes from view range, accumulates pocket weights into price bins, and renders vertical bars with gradient color intensity reflecting relative liquidity concentration at each price level.
🔶 Cumulative Distance Overlay System
Implements innovative cumulative distribution curves showing aggregate liquidity distance from current price for both long (left) and short (right) positions. The system calculates running totals of pocket weights from current price outward in both directions, normalizes against maximum span, and overlays line segments showing how much total liquidity exists at various distances, enabling instant assessment of liquidation cascade potential.
🔶 Dynamic Price Range Adaptation
Features fixed percentage-based view window that maintains consistent price range visualization across all timeframes and instruments, automatically centering histogram on current price with configurable +/- percentage bounds. The system recalculates histogram bins and pocket distributions on each bar close, ensuring visualization adapts to price movement while maintaining interpretable scale regardless of volatility regime.
🔶 Touch Detection and Weight Adjustment
Provides intelligent pocket state tracking that identifies when price trades through liquidation zones and applies configurable weight multipliers to touched pockets for historical context. The system monitors price interaction with pocket midpoints, marks pockets as "hit" when violated, and optionally increases their visual weight (default 5x) to emphasize historical liquidation levels while distinguishing from untouched future zones.
🔶 Gradient Intensity Color System
Implements sophisticated color gradient engine that modulates bar opacity from transparent to opaque based on relative liquidity concentration within each bin. The system normalizes bin values against maximum liquidity, applies color interpolation from faded to vivid hues, and distinguishes long liquidation zones (cyan) from short liquidation zones (yellow/gold) with current price column highlighted in red for instant orientation.
🔶 Performance-Optimized Rendering Architecture
Utilizes efficient box and line object management with dynamic allocation based on histogram configuration, implementing intelligent cleanup and reuse to maintain smooth performance. The system includes adaptive line budget calculations that adjust segment density for cumulative curves based on available object limits, ensuring consistent operation even with maximum histogram resolution settings.
🔶 Asymmetric Distribution Analysis
Calculates separate cumulative distributions for long and short liquidation zones split at current price, enabling identification of imbalanced liquidity positioning. The system normalizes distributions against respective maximums and overlays both curves on single histogram, allowing traders to instantly assess whether more liquidation risk exists above (shorts vulnerable) or below (longs vulnerable) current price levels.
🔶 Configurable Label and Scale System
Provides price axis labeling with adjustable frequency to reduce clutter while maintaining reference points, displaying price values at regular column intervals with configurable offset positioning. The system includes current price label showing exact value and percentile position within view range, offering both absolute price reference and relative positioning context for distribution interpretation.
🔶 Historical Pocket Persistence Framework
Maintains rolling window of liquidation pockets up to 3000 bars with automatic expiration management and optional preservation of touched zones for historical analysis. The system tracks pocket creation time, monitors age against lookback limits, and manages array cleanup to prevent memory overflow while retaining relevant historical liquidation levels for pattern recognition and support/resistance validation.
This indicator delivers sophisticated liquidity distribution analysis through histogram visualization and cumulative distance curves that reveal asymmetric positioning of potential liquidation levels. Unlike simple liquidation heatmaps that show absolute levels, the Liquidation Map's cumulative distribution overlays instantly communicate how much total liquidity exists at various distances from current price, enabling assessment of cascade potential. The system's multi-exchange volume aggregation, touch-weighted historical zones, and fixed-range visualization make it essential for traders seeking strategic positioning around institutional liquidity clusters in cryptocurrency futures markets. The histogram format enables instant identification of price levels where concentrated liquidations may trigger significant volatility or reversal events, while the asymmetric distribution curves reveal whether market structure favors upside or downside cascades.


Adaptive Trend Envelope [BackQuant]Adaptive Trend Envelope
Overview
Adaptive Trend Envelope is a volatility-aware trend-following overlay designed to stay responsive in fast markets while remaining stable during slower conditions. It builds a dynamic trend spine from two exponential moving averages and surrounds it with an adaptive envelope whose width expands and contracts based on realized return volatility. The result is a clean, self-adjusting trend structure that reacts to market conditions instead of relying on fixed parameters.
This indicator is built to answer three core questions directly on the chart:
Is the market trending or neutral?
If trending, in which direction is the dominant pressure?
Where is the dynamic trend boundary that price should respect?
Core trend spine
At the heart of the indicator is a blended trend spine:
A fast EMA captures short-term responsiveness.
A slow EMA captures structural direction.
A volatility-based blend weight dynamically shifts influence between the two.
When short-term volatility is low relative to long-term volatility, the fast EMA has more influence, keeping the trend responsive. When volatility rises, the blend shifts toward the slow EMA, reducing noise and preventing overreaction. This blended output is then smoothed again to form the final trend spine, which acts as the structural backbone of the system.
Volatility-adaptive envelope
The envelope surrounding the trend spine is not based on ATR or fixed percentages. Instead, it is derived from:
Log returns of price.
An exponentially weighted variance estimate.
A configurable multiplier that scales envelope width.
This creates bands that automatically widen during volatile expansions and tighten during compression. The envelope therefore reflects the true statistical behavior of price rather than an arbitrary distance.
Inner hysteresis band
Inside the main envelope, an inner band is constructed using a hysteresis fraction. This inner zone is used to stabilize regime transitions:
It prevents rapid flipping between bullish and bearish states.
It allows trends to persist unless price meaningfully invalidates them.
It reduces whipsaws in sideways conditions.
Trend regime logic
The indicator operates with three regime states:
Bullish
Bearish
Neutral
Regime changes are confirmed using a configurable number of bars outside the adaptive envelope:
A bullish regime is confirmed when price closes above the upper envelope for the required number of bars.
A bearish regime is confirmed when price closes below the lower envelope for the required number of bars.
A trend exits back to neutral when price reverts through the trend spine.
This structure ensures that trends are confirmed by sustained pressure rather than single-bar spikes.
Active trend line
Once a regime is active, the indicator plots a single dominant trend line:
In a bullish regime, the lower envelope becomes the active trend support.
In a bearish regime, the upper envelope becomes the active trend resistance.
In neutral conditions, price itself is used as a placeholder.
This creates a simple, actionable visual reference for trend-following decisions.
Directional energy visualization
The indicator uses layered fills to visualize directional pressure:
Bullish energy fills appear when price holds above the active trend line.
Bearish energy fills appear when price holds below the active trend line.
Opacity gradients communicate strength and persistence rather than binary states.
A subtle “rim” effect is added using ATR-based offsets to give depth and reinforce the active side of the trend without cluttering the chart.
Signals and trend starts
Discrete signals are generated only when a new trend regime begins:
Buy signals appear at the first confirmed transition into a bullish regime.
Sell signals appear at the first confirmed transition into a bearish regime.
Signals are intentionally sparse. They are designed to mark regime shifts, not every pullback or continuation, making them suitable for higher-quality trend entries rather than frequent trading.
Candle coloring
Optional candle coloring reinforces regime context:
Bullish regimes tint candles toward the bullish color.
Bearish regimes tint candles toward the bearish color.
Neutral states remain visually muted.
This allows the chart to communicate trend state even when the envelope itself is partially hidden or de-emphasized.
Alerts
Built-in alerts are provided for key trend events:
Bull trend start.
Bear trend start.
Transition from trend to neutral.
Price crossing the trend spine.
These alerts support hands-off trend monitoring across multiple instruments and timeframes.
How to use it for trend following
Trend identification
Only trade in the direction of the active regime.
Ignore counter-trend signals during confirmed trends.
Entry alignment
Use the first regime signal as a structural entry.
Use pullbacks toward the active trend line as continuation opportunities.
Trend management
As long as price respects the active envelope boundary, the trend remains valid.
A move back through the spine signals loss of trend structure.
Market filtering
Periods where the indicator remains neutral highlight non-trending environments.
This helps avoid forcing trades during chop or compression.
Adaptive Trend Envelope is designed to behave like a living trend structure. Instead of forcing price into static rules, it adapts to volatility, confirms direction through sustained pressure, and presents trend information in a clean, readable form that supports disciplined trend-following workflows.

TWIX TRAP V2 - Ultimate Signal Engine# TWIX TRAP V2 - Ultimate Signal Engine
## 🎯 Professional Multi-Layer Trading System
TWIX TRAP V2 is a sophisticated trading signal system that combines **liquidity analysis**, **exhaustion detection**, and **momentum triggers** to identify high-probability trade setups.
---
## 🔥 How It Works
The indicator uses a **4-step confirmation process** before generating any signal:
**Step 1: Liquidity Purge Detection**
Monitors key price levels (Daily, Weekly, Monthly highs/lows) and detects when smart money hunts stop losses.
**Step 2: Exhaustion Analysis (Heavy Matrix)**
Uses weighted Z-score calculations to identify when the market is overextended and due for a reversal.
**Step 3: Ready State Confirmation**
Only when BOTH liquidity purge AND exhaustion align does the system enter a "ready" state.
**Step 4: Precision Trigger (Light Matrix)**
Times the exact entry when momentum begins reversing, ensuring optimal entry points.
---
## ⚡ Key Features
✅ **4 Quality Modes** - From Sniper (1 signal/week) to Scalper (10+ signals/day)
✅ **Multi-Timeframe Liquidity** - Tracks Monthly, Weekly, Daily, 4H, and 1H levels
✅ **Dynamic Zones** - Self-adjusting thresholds based on market conditions
✅ **Signal Strength Rating** - 1-4 rating based on liquidity level significance
✅ **Visual Dashboard** - Real-time status of all system components
✅ **Strong Signal Alerts** - Special markers for high-probability setups
---
## 📊 Signal Quality Options
| Quality Mode | Signals | Best For |
|--------------|---------|----------|
| Sniper (1/week) | ~1/week | Swing trading, major reversals |
| High (1/day) | ~1/day | Day trading (recommended) |
| Medium (3-5/day) | 3-5/day | Active trading |
| Scalper (10+/day) | 10+/day | Scalping, high frequency |
---
## 🎨 Visual Guide
- **X Marker (Green/Red)** - Liquidity purge detected
- **Background Color** - Green = BUY ready, Red = SELL ready
- **Triangle** - Normal signal (strength 1-2)
- **Dot + Label** - STRONG signal (strength 3-4) ⭐
---
## 📈 Works Best On
- Cryptocurrencies (SOL, BTC, ETH)
- Forex pairs
- Indices
- Any liquid market
**Recommended Timeframes:** 15m, 30m, 1H, 4H
---
## ⚠️ Risk Disclaimer
This indicator is a trading tool, not financial advice. Always manage your risk properly and never trade with money you cannot afford to lose. Past performance does not guarantee future results.
---
## 🔑 Access
This is an **invite-only** indicator. Contact me for access details.
---
**Happy Trading! 🎯**

Master Analytics Dashboard Pro V6Works in any market including Crypto and Stocks
1. Navigating the Settings (Inputs)
Click the "Gear" icon next to the indicator name on your chart to open the settings. You will see several sections with (i) icons—hover over these for helpful tips.
Dashboard Aesthetics: Use this to move the dashboard (e.g., to "Bottom Left") or change the background transparency.
Dashboard Data Toggles: What to display on dashboard.
Technical Settings: This is where you adjust the UT Bot Key and RSI lengths/MACD. For beginners, the default settings are usually best.
SMA/EMA and VWAP Lines: Can add up to 5 SMA and 3 EMA lines and fully customizable. By default SMA 610 ( for lowest bottom) and classical EMA 9, 20, 200 and VWAP will display.
MTF Timeframes: You can choose which timeframes the dashboard monitors. By default, it tracks from 5m up to 1D to show you the "Big Picture" trend.
2. Understanding the Dashboard & Ribbon
The dashboard acts as your "Control Center," aggregating data so you don't have to switch charts.
Trend Ribbon (Cloud): When the cloud is Green, the immediate trend is bullish. When it is Red, the trend is bearish.
Ribbon Trend (MTF): This row shows if the ribbon is bullish or bearish across other timeframes.
Confluence %: This is your most important number. A score of 80% or higher means almost all indicators (MACD, RSI, Trends) are aligned in one direction.
3. Setting Up Individual Alerts
One of the most powerful features of this script is the ability to trigger alerts individually.
Select Your Triggers: In the indicator settings under "7. Alert Thresholds," check only the boxes you want (e.g., Bullish Ribbon Flip). By default, all other alerts are unchecked to prevent spam.
Create the Alert: Click the "Alert" icon (Alarm Clock) on the TradingView sidebar.
Condition: Select "Analytics" and then select "Any alert() function call".
Frequency: Choose "Once Per Bar Close" to ensure the signal is confirmed before you get a notification.
How to Trade:
🟢 The Bullish "Perfect Trade" Checklist
To confirm a high-probability Long entry, aim for as many of these "Green" signals as possible:
Trend Ribbon Flip: The primary ribbon cloud on your chart has turned Green, and price is trading above it.
Confluence Score ≥ 80%: The dashboard shows a bullish confluence of 80% or higher, indicating that RSI, MACD, and Trends are aligned.
MTF Alignment: At least 4 out of the 5 timeframes (e.g., 15m, 1h, 4h, 1D) show a BULL status.
Trend Status: The "Trend Source" row (EMA 200 or SMA 200) reads BULLISH, confirming the long-term trend is in your favor.
UT Bot Confirmation: A tiny BUY label has appeared on the chart (confirmed on bar close).
RSI Momentum: The RSI is above its Moving Average (TRUE) but has not yet crossed the Overbought (80) threshold. Look out for Yellow caution to indicate RSI is OB/OS (Above the candle is OB, below the candle is OS.
🔴 The Bearish "Perfect Trade" Checklist
To confirm a high-probability Short entry, look for these "Red" signals:
Trend Ribbon Flip: The ribbon cloud has turned Red, and price is trading below the basis line.
Confluence Score ≤ 20% (80% Bearish): The aggregate signal shows strong bearish pressure.
MTF Alignment: The higher timeframes (TF 4 and TF 5) specifically show a BEAR status, ensuring you aren't "fighting the trend".
Trend Status: Price is trading below the 200 EMA/SMA, showing the dashboard Trend Status as BEARISH.
UT Bot Confirmation: A tiny SELL label has appeared on the chart.
MACD State: The MACD Fast line is below the Signal line (FALSE on the "MACD > Sig" row).

MarketMind PRO+M🜁rketMind PRO+ ────────────────────
Advanced Market Interpretation & Conviction Context
M🜁rketMind PRO+ is an advanced market interpretation system designed for traders who require structured insight into alignment, stability, and contextual agreement — without alerts, signals, or hindsight-based indicators.
Rather than issuing instructions or trade direction, M🜁rketMind PRO+ focuses on interpreting how market conditions relate to one another , whether internal agreement is present, and whether the environment supports conviction or restraint.
This script is designed as a standalone interpretive analysis tool. It does not provide execution guidance or predictive guarantees.
WHAT IT DOES ────────────────────
M🜁rketMind PRO+ evaluates current market conditions across multiple analytical dimensions — including macro environment, sector behavior, momentum, structure, liquidity, stability, and session dynamics — and synthesizes them into a structured, human-readable HUD.
In addition to describing what is happening, the system interprets internal agreement and contextual coherence , helping traders understand whether conditions appear supportive, fragile, or transitional.
The script provides insight into:
Market bias and directional alignment
Regime and phase behavior across sessions
Momentum quality, degradation, and stall dynamics
Internal agreement and alignment consistency
Structural stability and transition risk
Contextual factors that may support or undermine conviction
The goal is to clarify how well conditions agree internally , not to tell traders what action to take.
HOW TO USE IT ────────────────────
M🜁rketMind PRO+ is not a signal generator.
It is designed to complement discretionary price action, rule-based systems, or systematic strategies by helping traders evaluate higher-order context, such as:
How aligned are current conditions, and how broad is that agreement?
Is momentum supported, fragile, or deteriorating?
Does the environment appear stable, transitional, or deceptive?
Does this context justify conviction, or suggest restraint?
M🜁rketMind PRO+ emphasizes synthesis over reaction, preserving chart clarity while providing interpretive depth.
DESIGN PHILOSOPHY ────────────────────
M🜁rketMind PRO+ is intentionally interpretive.
It focuses on contextual agreement and stability , rather than isolated signals or prescriptive outputs:
Multi-dimensional context and alignment interpretation
Internal agreement and coherence awareness
Stability and transition sensitivity
Session-aware interpretive framing
No alerts, entries, or execution logic
No forward performance claims or guarantees
Nothing is instructed.
Nothing is promised.
This script explains how conditions relate , not what to trade.
WHO IT IS FOR ────────────────────
M🜁rketMind PRO+ is suited for traders who:
Require interpretive context beyond surface-level awareness
Manage exposure across changing regimes
Value understanding alignment, stability, and agreement
Prefer synthesis over single-indicator workflows
It is not designed for:
Buy or sell alerts
Automated execution systems
Traders seeking prescriptive instructions
IMPORTANT NOTES ────────────────────
M🜁rketMind PRO+ does not provide financial advice
No system can predict future price behavior with certainty
This tool is designed to support judgment, not replace it
Used appropriately, M🜁rketMind PRO+ helps traders operate with greater selectivity, contextual clarity, and risk awareness

Omni-Trend Analytics + Live PnL DashboardOverview
The Omni-Trend Analytics suite is an all-in-one technical command center. It integrates the battle-tested UT Bot signal logic with a sophisticated real-time dashboard, session tracking, and multi-timeframe trend analysis.
📊 The "Nexus" Dashboard
The heart of this script is the 6-row dynamic dashboard, designed to give you "at-a-glance" confluence:
RSI & RSI-MA: Tracks the standard RSI alongside a custom RSI-based Moving Average to spot momentum shifts before they hit the price.
Selectable Trend Status: Unlike static indicators, you can toggle the "Trend" source between EMA 9, 20, or 200 in the settings to match your trading style (Scalping vs. Swing).
Distance to EMA: Shows exactly how "overextended" the price is from your selected trend line.
ATR Volatility (Color-Coded): Turns Green when volatility is expanding (ideal for trend following) and Red when the market is contracting (ideal for range-trading or caution).
Live PnL Tracking: Automatically calculates the profit or loss of the most recent UT Bot signal in real-time.
🛠️ Key Features & Settings
Precision Signals: Combines UT Bot Buy/Sell labels with RSI "!" reversal warnings for high-probability entries.
Institutional Moving Averages: Includes 5 SMAs (including the 610 SMA) and 3 EMAs (9, 20, 200) all set to a professional Thickness 2 for clarity.
Session Highlighting: Automatically shades the background for London and New York sessions to help you trade when liquidity is highest.
VWAP Integration: Includes a purple VWAP line to ensure you are trading at a "fair value" relative to volume.
🔔 Strategic Alert Suite
The script comes pre-loaded with 6 specialized alert conditions:
UT Bot Signal: Standard entry alerts.
RSI Cross RSI-MA: Early warning for momentum reversals.
High-Prob UT + VWAP: Signals that only trigger when aligned with institutional volume.
EMA 9/20 Momentum Cross: Classic trend-shift notification.
ATR Volatility Spike: Alerts you to 50% increases in market volatility.
PnL Target / Break-Even: Pings you when your live trade reaches a user-defined profit threshold.
💡 Trading Pro-Tip
The Convergence Strategy: Look for a UT Bot Buy signal that occurs during the London/NY Overlap while the ATR is Green (expanding) and the RSI is crossing over its RSI-MA. This "triple confluence" is the primary design intent of the Omni-Trend suite.

MarketMind PROM🜁rketMind PRO ────────────────────
Descriptive Market Context & Risk Awareness
M🜁rketMind PRO is a professional-grade market context system designed to help traders maintain situational clarity and explicit risk awareness — without signals, confidence scoring, or forward-looking interpretation.
Rather than telling traders what to trade or how confident to be, M🜁rketMind PRO focuses on describing what is happening in the market and where caution may be warranted.
This script is designed as a standalone descriptive tool. It does not provide execution guidance, trade signals, or predictive insight.
WHAT IT DOES ────────────────────
M🜁rketMind PRO evaluates current market conditions across multiple dimensions — including session context, regime state, momentum direction, volatility, liquidity, and structural behavior — and presents them in a clean, human-readable HUD.
The system emphasizes description over interpretation.
It highlights conditions that may elevate or reduce risk without assessing alignment strength, assigning confidence, or projecting outcomes.
The script provides visibility into:
Market context and session awareness
Basic regime states and transitions
Momentum direction (up, down, neutral)
Volatility, liquidity, and structural caution conditions
Environmental factors that may influence risk
The goal is to make risk visible — without telling traders what to do with it.
HOW TO USE IT ────────────────────
M🜁rketMind PRO is not a signal generator.
It is designed to be used alongside discretionary price action, rule-based entries, or systematic strategies, helping traders stay aware of context and potential risk while executing their own process.
Common questions it can help inform include:
What type of market environment is currently present?
Is momentum developing, stalling, or absent?
Are volatility or liquidity conditions elevated?
Does the environment appear clean or structurally fragile?
M🜁rketMind PRO describes conditions as they are.
Interpretation and decision-making remain entirely with the trader.
DESIGN PHILOSOPHY ────────────────────
M🜁rketMind PRO is intentionally descriptive.
It includes context and caution layers without interpretive or evaluative frameworks:
Market context, momentum, and risk visibility
Volatility, liquidity, and structural awareness
Session awareness without gating or execution logic
A single, consistent HUD perspective
No confidence scoring or conviction grading
No predictive or forward-looking language
Nothing is implied.
Nothing is projected.
This script shows what is happening and where risk may exist — nothing more.
WHO IT IS FOR ────────────────────
M🜁rketMind PRO is suited for traders who:
Prefer structured context over signals
Manage their own execution and risk decisions
Value awareness of environmental and structural conditions
Want clarity without interpretive bias
It is not designed for:
Buy or sell alerts
Execution guidance
Predictive or outcome-based analysis
IMPORTANT NOTES ────────────────────
M🜁rketMind PRO does not provide financial advice
No system can predict future price behavior
This tool is designed to inform awareness, not decisions
Used appropriately, M🜁rketMind PRO supports disciplined, context-aware trading

Tariq Supertrend StrategyThis Strategy which points out the best time to enter in Long Trade or Short Trade

Goal Setting Strategies Viprasol# 🎯 Goal Setting Strategies Viprasol
A powerful goal tracking tool designed for disciplined traders who want to monitor their trading objectives, milestones, and progress directly on their charts.
## ✨ KEY FEATURES
### 📊 Flexible Goal Management
- Track anywhere from 1 to 20 trading goals simultaneously
- Adjustable goal count via simple input slider
- Each goal has its own unique emoji identifier
- Real-time progress counter
### ✅ Visual Tracking System
- Interactive checkbox system for goal completion
- Clear visual indicators (✅ completed, ⬜️ pending)
- Customizable goal names and descriptions
- Dynamic progress display
### 🎨 Full Customization
- **4 Position Options**: Top Left, Top Right, Bottom Left, Bottom Right
- **5 Font Sizes**: Tiny, Small, Normal, Large, Huge (optimized for all screen sizes)
- **Custom Colors**: Header, labels, background, achievement text
- **Premium Styling**: Modern cyber-themed design with professional appearance
### 💡 Perfect For:
- Daily/Weekly trading goal tracking
- Risk management milestones
- Profit target monitoring
- Trading plan compliance
- Personal development objectives
- Learning milestones
## 🔧 HOW TO USE
1. **Set Your Primary Goal**: Enter your main objective in "Primary Goal" field
2. **Choose Goal Count**: Select how many goals you want (1-20)
3. **Name Your Goals**: Customize each goal name in the "Goal Definitions" section
4. **Track Progress**: Check off goals as you complete them
5. **Customize Display**: Adjust colors, sizes, and position to match your chart setup
## 📐 INPUT GROUPS
### 🎯 Viprasol Goal Configuration
- Primary Goal Name
- Number of Goals (1-20)
### 📋 Goal Definitions
- All 20 goals with individual names and checkboxes
- Only enabled goals (based on count) will display
### 🌈 Premium Styling
- Goal Header Color
- Label Color
- Panel Background Color
- Achievement Color
- Header Font Size
- Milestone Font Size (Tiny/Small optimized for space)
### 📍 Elite Display
- Dashboard Position selector
## 💎 UNIQUE FEATURES
- **Space Efficient**: Tiny and Small font options for compact displays
- **Scalable**: Grow from 1 goal to 20 as your needs evolve
- **Non-Intrusive**: Overlay indicator that doesn't interfere with price action
- **Professional Design**: Clean, modern interface with cyber aesthetic
## 🎓 USE CASES
**Day Traders**: Track daily profit targets, trade count limits, max loss thresholds
**Swing Traders**: Monitor weekly/monthly goals, position management rules
**New Traders**: Learning milestones, strategy development checkpoints
**Experienced Traders**: Advanced risk management, portfolio objectives
## ⚙️ TECHNICAL DETAILS
- Version: Pine Script v5
- Type: Overlay Indicator
- Max Labels: 500
- Table-based display system
- No repainting
- Lightweight performance
## 🚀 GETTING STARTED
1. Add indicator to your chart
2. Set "Number of Goals" to your desired count (start small, scale up)
3. Customize goal names
4. Check boxes as you achieve goals
5. Watch your progress build!
## 📊 DISPLAY OPTIMIZATION
- Use "Tiny" or "Small" for maximum goals on small screens
- Use "Normal" or "Large" for standard monitors
- Use "Huge" for presentation or large displays
- Adjust position to avoid chart overlap
## 🎯 TRADING DISCIPLINE
This tool helps reinforce:
- Goal-oriented trading mindset
- Progress tracking accountability
- Milestone celebration
- Structured approach to trading development
---
**© viprasol**
*Designed for traders who take their goals seriously.*


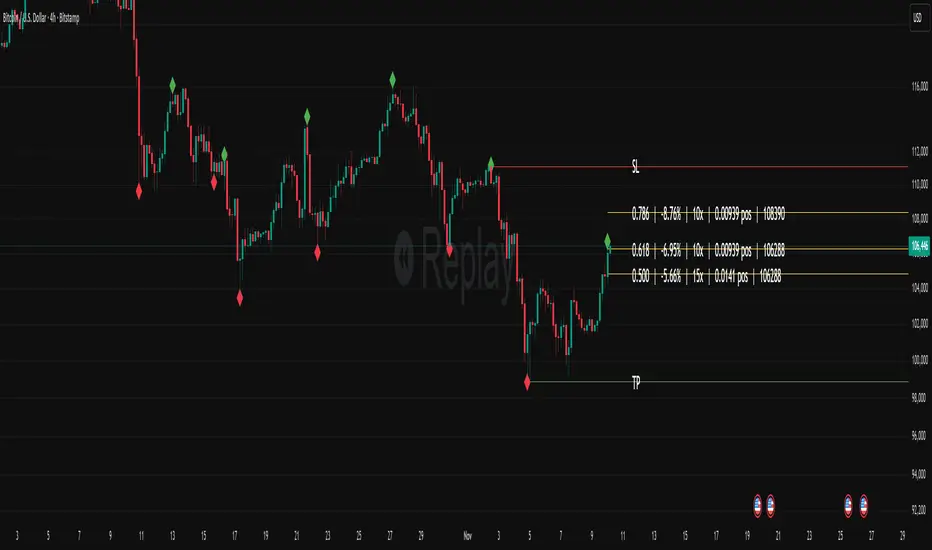
Fibonacci Set-upThe indicator plots Fibonacci retracements based on recent lows and highs.
Additionally it calculates position size, max leverage, max drawdown and pricelevels.
AG Pro Dynamic ChannelsAG Pro Dynamic Channels V2
Discover a new lens through which to view market structure with the AG Pro Dynamic Channels V2. This advanced indicator moves beyond simple trendlines, automatically identifying, classifying, and drawing eight distinct types of support and resistance channels directly on your chart.
Built on a sophisticated pivot-point detection engine, this script intelligently distinguishes between Major and Minor price structures, as well as Internal and External channels. This provides a comprehensive and multi-dimensional map of the market's flow, helping you identify trend continuations, corrections, and potential reversals.
The indicator is complete with a powerful, fully customizable alert system designed to notify you of the two most critical events: channel breakouts and price reactions.
Key Features
Fully Automatic Channels: The script automatically analyzes price action to find pivot highs and lows, using them to construct relevant channels without any manual drawing required.
8-Channel Classification: Gain deep market insight by viewing eight distinct channel types:
Major External (Up/Down)
Major Internal (Up/Down)
Minor External (Up/Down)
Minor Internal (Up/Down)
Advanced Pivot Engine: The core logic classifies pivots into categories like Higher Highs (MHH/mHH), Lower Lows (MLL/mLL), Higher Lows (MHL/mHL), and Lower Highs (MLH/mLH) to determine the precise start and end points for each channel.
Deep Customization: Take full control of your chart's appearance. You can individually toggle the visibility, color, line style (solid, dashed, dotted), and line width for all eight channel types.
Chart Clarity: A "Delete Previous" option is available for each channel type, allowing you to keep your chart clean and focused on only the most current and relevant market structures.
Comprehensive Alert System
Never miss a key price interaction. The AG Pro Dynamic Channels V2 features a robust, built-in alert module.
Dual-Alert Conditions: Get notifications for two distinct events:
Break Alert: Triggers when price confirms a close outside of a channel, signaling a potential breakout.
React Alert: Triggers when price touches or interacts with a channel line before closing back inside, signaling a test or rejection.
16 Unique Alerts: You have full control to enable or disable "Break" and "React" alerts for all 8 channel types individually, giving you 16 unique alert conditions to monitor.
Professional Alert Messages: The embedded alert sender provides detailed messages that include the asset, timeframe, and the specific event, such as "Break Major External Up Channel" or "React Minor Internal Down Channel".
Alert Configuration: Easily set your global Alert Name, Message Frequency (e.g., Once Per Bar, Once Per Bar Close), and Alert Time Zone from the script's settings.
How to Use
Trend Identification: Use the Major External Channels (drawn from MHH and MLL pivots) to identify the primary, long-term trend direction.
Pullback & Entry Zones: Use the Internal Channels (drawn from MHL and MLH pivots) to spot corrections and potential entry zones within an established trend.
Breakout Trading: Set Break Alerts on Major channels to be notified of significant, structure-shifting moves.
Short-Term & Counter-Trend: Utilize the Minor Channels to identify shorter-term price swings and potential reversal points.

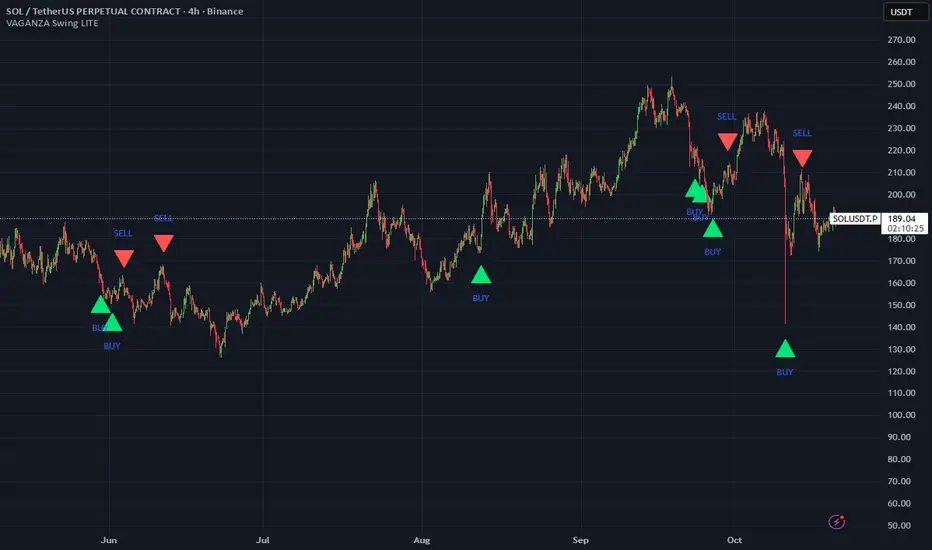
VAGANZA Swings V1 LITE1. Introduction: The Philosophy Behind VAGANZA Swings
The VAGANZA Swings V1 LITE was developed to solve a common problem faced by swing traders: getting caught in low-probability trades during choppy, sideways markets. Many indicators can identify a trend, but few can effectively measure its quality and pinpoint optimal, low-risk entry points within that trend.
This script is not merely a "mashup" of existing indicators. It is a structured, multi-layered filtering system where each component is specifically chosen to address the weaknesses of the others. The core philosophy is to trade only when there is a clear market consensus, confirmed by trend, strength, momentum, and volume. This results in fewer signals, but each signal is designed to be of significantly higher quality.
2. The VAGANZA Confirmation Engine: A Deeper Look at the Logic
A signal is only generated when four distinct market conditions align. This sequential confirmation process is what makes the script unique and robust.
Layer 1: The Trend Regime Filter
What it does: The indicator first establishes the dominant market bias using a dual-speed baseline system. A faster-reacting baseline is compared against a slower, more stable baseline to determine if the market is in a long-term bullish or bearish "regime."
Why it's important: This foundational step ensures we are never fighting the primary market current. BUY signals are disabled during a bearish regime, and SELL signals are disabled during a bullish regime, instantly eliminating 50% of potentially bad trades.
Layer 2: The Trend Strength & Conviction Qualifier
What it does: This is the script's core intelligence. After confirming the trend's direction, this layer uses a directional volatility engine to measure the trend's strength or conviction. It analyzes the expansion between bullish and bearish price movements.
Why it's important: A simple moving average crossover can occur in a weak, drifting market, leading to false signals. This filter requires the trend to be demonstrably powerful (above a predefined strength threshold of 25) before allowing the system to even look for an entry. It's the primary filter for avoiding sideways market traps.
Layer 3: The Dynamic Pullback & Entry Trigger
What it does: Instead of chasing price at its peak, the script waits for a natural "breather" or pullback. It employs a momentum cycle oscillator to identify when the price has become temporarily oversold within a strong uptrend, or overbought within a strong downtrend. The signal is triggered at the precise moment momentum appears to be rejoining the primary trend.
Why it's important: This ensures a more favorable risk-to-reward ratio. By entering on a pullback, traders can avoid buying the top or selling the bottom of a short-term swing, which is a common mistake.
Layer 4: The Volume Participation Check
What it does: As a final confirmation, the script checks the volume on the signal candle. It requires the volume to be higher than its recent average.
Why it's important: A price move without significant volume can be a trap. This final check confirms that there is genuine market participation and conviction behind the signal, suggesting that larger market players are supporting the move.
3. The Synergy of the System (Why This Combination is Original)
The originality of VAGANZA Swings lies not in its individual components, but in their synergistic interaction:
The Trend Regime Filter sets the stage.
The Trend Strength Qualifier prevents signals when the stage is poorly lit (i.e., a weak trend).
The Pullback & Entry Trigger tells the actor exactly when to enter the stage for maximum impact.
The Volume Check ensures the audience is actually watching.
Without the strength filter, the trend filter would fail in ranging markets. Without the pullback trigger, entries would have poor risk-reward. This interdependent, sequential logic provides a unique and useful tool that goes beyond what a single indicator can offer.
4. How to Use This Script
Timeframe: Optimized for the 4-Hour (H4) chart, as this provides a balance between meaningful swings and actionable signals. It can also be used on the Daily (D1) chart for longer-term analysis.
BUY Signal (Green "BUY" Arrow): Appears only when a strong, confirmed uptrend experiences a temporary, oversold pullback and volume confirms renewed buying interest. This is a high-probability signal to consider a long position.
SELL Signal (Red "SELL" Arrow): Appears only when a strong, confirmed downtrend experiences a temporary, overbought rally and volume confirms renewed selling pressure. This is a high-probability signal to consider a short position.
Risk Management: This indicator provides entry signals only. It is crucial that you apply your own risk management rules. Always use a stop-loss and have a clear take-profit strategy for every trade.
Disclaimer: This tool is for decision-support and does not constitute financial advice. All trading involves risk. Past performance is not indicative of future results. Please backtest thoroughly before using this script with real capital.
Trade-o-Scope: Plot Custom Data v2Meet — a major tool upgrade for plotting your own data on TradingView charts. Simple and intuitive input format, large volume limits, and robust plotting for your own datasets — forecasts, backtests, or external data and model outputs.
You can apply/overlay other indicators from the TradingView catalog (such as Bollinger Bands, RSI, etc.) on top of custom data charts. The indicator you want to overlay must support selecting an input data source — i.e., have a dropdown where you can choose as the source.
🧩 How to use
Simply select and copy two columns — with dates and values — from your spreadsheet (Excel, Google Sheets, etc.) and paste them into the indicator’s input field. The indicator will automatically process the input and plot your data on the chart.
Example data:
Date XYZ_value
2025-10-08 84.57
2025-10-01 80.66
2025-09-24 86.24
2025-09-17 84.76
📅 Supported date format
The indicator recognizes standard international date formats commonly used in spreadsheets and data exports.
• ISO 8601 — "YYYY-MM-DD" or "YYYY-MM-DDThh:mm:ss"
2025-10-13
2025-10-13 14:30
2025-10-13 14:30:00
2025-10-13T14:30
2025-10-13T14:30:00
• RFC 2822 — "DD MMM YYYY" or "DD MMM YYYY hh:mm:ss"
13 Oct 2025
13 Oct 2025 14:30
13 Oct 2025 14:30:00
The time part is optional — if omitted, midnight (00:00:00) is assumed.
By default, all date–time values are interpreted in the exchange timezone of the chart’s symbol, but you can select a different data timezone in the indicator settings if needed.
💡 Supported value format
Integers (e.g., 12345, -12345)
Decimals (e.g., 1234.56, -1234.56)
The decimal separator must be a dot (.)
Thousands separators are not supported
⚙️ Advanced Features
Value Multiplier — scale your values by a chosen factor.
Formatting Options — display values as price, percentage, or volume.
Conditional Coloring — automatically change plot color based on thresholds.
Plot Style Selection — choose from line, histogram, area, or column plots.
Additional Visual References — enable fixed horizontal lines for better visual interpretation.
📝 General Notes
Maximum input size: 40,960 characters (~1,500–3,000 rows depending on format). If an error occurs after pasting data, simply remove a few rows until it disappears.

ADR% / CDR% Range Analyzer - PajameinThe "ADR%/CDR% Range Analyzer" is a versatile TradingView indicator designed for traders who want to monitor and compare the "Average Daily Range (ADR%)" and "Current Daily Range (CDR%)" in real-time. ADR% represents the average percentage range (high-low relative to low) over a user-defined number of daily bars, helping you gauge a stock's typical volatility. CDR% shows the current session's range as a percentage, either intraday (customizable from start to end price) or full daily, allowing you to assess how the current bar's movement stacks up against historical norms.
Key features include:
- "Visual Comparison": Displays both values as clean labels on the chart with customizable positions (separate or combined).
- "Dynamic Background Coloring": CDR% label background changes color based on its relation to ADR%—light green for low volatility (< low threshold), light blue for neutral (between thresholds), and light red for high volatility (> high threshold). This helps quickly spot expansion or contraction in daily moves.
- "Flexibility": Works on any timeframe, with options for intraday customization and anti-clipping adjustments for multi-pane layouts.
This indicator is ideal for day traders, swing traders, or anyone tracking volatility breakouts, range-bound setups, or risk management based on expected daily moves.
Input Settings Guide
Here's a breakdown of each setting and how it enhances your trading workflow:
- "Show ADR%" (Boolean, default: true)
Toggle to display/hide the ADR% label. Use this to declutter your chart when focusing solely on current range.
- "Show CDR%" (Boolean, default: true)
Toggle to display/hide the CDR% label. Ideal for charts where you only need historical average or current metrics.
- "ADR% Length" (Integer, default: 20, min: 1)
Number of daily bars for averaging the range percentage. Shorter lengths (e.g., 10) for recent volatility; longer (e.g., 50) for broader trends.
- "CDR%: Start" (Source, default: low)
Starting price for intraday CDR% (e.g., open, previous close). Customize for specific range measurements like gap fills.
- "CDR%: End" (Source, default: high)
Ending price for intraday CDR% (e.g., low, close). Pair with Start for targeted ranges, like open-to-low for downside capture.
- "Intraday Display" (String dropdown: "Intraday CDR%", "Daily CDR%", default: "Daily CDR%")
Switch between real-time intraday calculation (dynamic updates) or fixed daily value (stable, non-repainting).
- "Low Threshold %" (Float, default: 40.0, range: 0-100)
Percentage of ADR% below which CDR% gets the low (green) background. Lower it (e.g., 30%) for stricter low-volatility alerts.
- "High Threshold %" (Float, default: 60.0, range: 0-100)
Percentage of ADR% above which CDR% gets the high (red) background. Raise it (e.g., 70%) to highlight only extreme expansions.
- "ADR% Text Color" (Color picker, default: black)
Foreground color for ADR% text. Choose contrasting colors for dark/light themes.
- "CDR% Text Color" (Color picker, default: black)
Foreground color for CDR% text. Ensures readability over dynamic backgrounds.
- "Low CDR% Background (below low threshold)" (Color picker, default: light green with 70% transparency)
Background for subdued ranges. Adjust opacity for subtlety.
- "Mid CDR% Background (between thresholds)" (Color picker, default: light blue with 70% transparency)
Neutral background for typical moves.
- "High CDR% Background (above high threshold)" (Color picker, default: light red with 70% transparency)
Alert-style background for breakouts.
- "Cell Height %" (Integer, default: 8, range: 1-20)
Vertical padding for labels as a percentage of chart height. Increase (e.g., 12) in multi-pane layouts to prevent text clipping; decrease for compact views.
- "ADR% Position" (String dropdown: Top/Bottom/Middle Left/Right/Center, default: Bottom Right)
Placement of ADR% label. Use separate positions for side-by-side comparison.
- "CDR% Position" (String dropdown: Top/Bottom/Middle Left/Right/Center, default: Bottom Right)
Placement of CDR% label. Matching positions auto-stacks them vertically.
- "Text Size" (String dropdown: Tiny/Small/Normal/Large, default: Normal)
Font size for labels. "Small" for dense charts; "Normal" for clarity.
Usage Tips
- "Volatility Trading": Set thresholds to 50%/80% for spotting range expansions during news events.
- "Multi-Timeframe": Apply on 5-min charts with daily ADR for intraday targets (e.g., aim for 80% of ADR).
- "Customization": For forex/crypto, tweak Start/End to session opens. Test in replay mode to verify non-repainting.
- "Limitations": Intraday mode updates live but may not repaint until bar close; daily mode is fixed.

HMA super trade by @arkancapMulti-HMA with five customizable moving averages: visual colors, transparency via picker, flexible line styles, and label/alert for HMA50↔HMA100 crossovers. Lightweight, readable, and ready for trading templates.
Мульти-HMA с пятью настраиваемыми скользящими: визуальные цвета, прозрачность через пикер, гибкие стили линий и метка/алерт для пересечений HMA50↔HMA100. Лёгкий, читабельный и готовый к торговым шаблонам.
Five Hull moving averages that show the trend and indicate key crossovers. Customize colors, thickness, and get accurate alerts. Suitable for scalping and multi-timeframes. Support for filling between moving averages to visually highlight areas of strength or weakness.
Пять Hull-скользящих, которые показывают тренд и подсказывают ключевые пересечения. Настраивай цвета, толщину и получай аккуратные алерты. Подходит для скальпа и мульти-таймфрейма. Поддержка заливки между скользящими для наглядного выделения зон силы или слабости.

Trade AliThe Trade Ali indicator is designed to identify the continuation of market trends after a correction or pullback. Its core logic combines multiple layers of trend analysis with noise reduction techniques to provide clearer and more reliable trading signals.
🔹 Core Mechanism
Price data is first filtered using a smoothing method that reduces short-term noise. This ensures that the main direction of the market becomes more visible and traders are not misled by minor fluctuations.
🔹 Multi-Timeframe Trend Analysis
The indicator evaluates both short-term and long-term market structures. When both perspectives align in the same direction, it increases the probability of a stronger trend continuation. This multi-layer approach helps avoid false entries.
🔹 Detection of Key Shifts
In addition to tracking the overall trend, the indicator also identifies critical changes in momentum and balance between buyers and sellers. These moments often occur right after a pullback and usually mark the start of a new wave in the dominant direction.
🔹 Entry & Exit Signals
When all necessary conditions are confirmed, the indicator plots buy or sell labels on the chart. These signals typically appear around the end of a correction and the beginning of the next impulsive move.
🔹 Overall Trend Status
Besides the individual signals, the indicator displays the general market condition (bullish, bearish, or neutral) in a visual format on the chart. This gives traders a quick overview of the bigger picture.
✅ Summary
The Trade Ali indicator is built for traders who want to capture trend continuation opportunities after corrections or pullbacks. By combining multiple confirmation layers and filtering out market noise, it focuses on providing cleaner, more meaningful signals that highlight stronger market conditions.
NPM Rsi DivergenceNPM RSI Divergence Indicator
The NPM RSI Divergence Indicator is a closed-source tool designed to help traders identify potential reversals and high-probability trade setups using divergence between price action and the Relative Strength Index (RSI). It highlights areas where momentum is weakening or strengthening, giving traders early signals of potential trend changes.
What it does
Detects divergences between RSI and price movement, indicating potential trend reversals or continuation.
Shows the strength or reliability of each divergence signal to help traders gauge probability.
Plots visual markers directly on the chart for easier recognition of potential setups.
Helps traders spot early exhaustion points in trends before price reverses or continues strongly.
How it works (concept-level)
Compares price highs/lows with RSI highs/lows to detect hidden or regular divergences.
Applies adaptive filtering to reduce false signals in choppy or low-volatility markets.
Aggregates divergence signals into clear visual markers and strength indicators.
Incorporates momentum context to highlight divergences that are more likely to produce actionable moves.
How to use it
1. Apply the indicator to your chosen symbol and timeframe.
2. Observe divergence markers and their strength indicators on the chart.
3. Confirm potential trade opportunities by considering trend direction and market context.
4. Use divergence signals to assist with trade entry, exit, or risk management decisions.
Alerts
Optionally set alerts when divergence signals appear or when the strength indicator exceeds a user-defined threshold.
Notes
Suitable for multiple markets, including forex, indices, crypto, and equities.
Can be used on intraday or swing trading timeframes depending on your trading strategy.
⚠️ Disclaimer: This script is for educational purposes only and is not financial advice. Trading involves risk, and you can lose money. Always test strategies on a demo account and practice proper risk management.

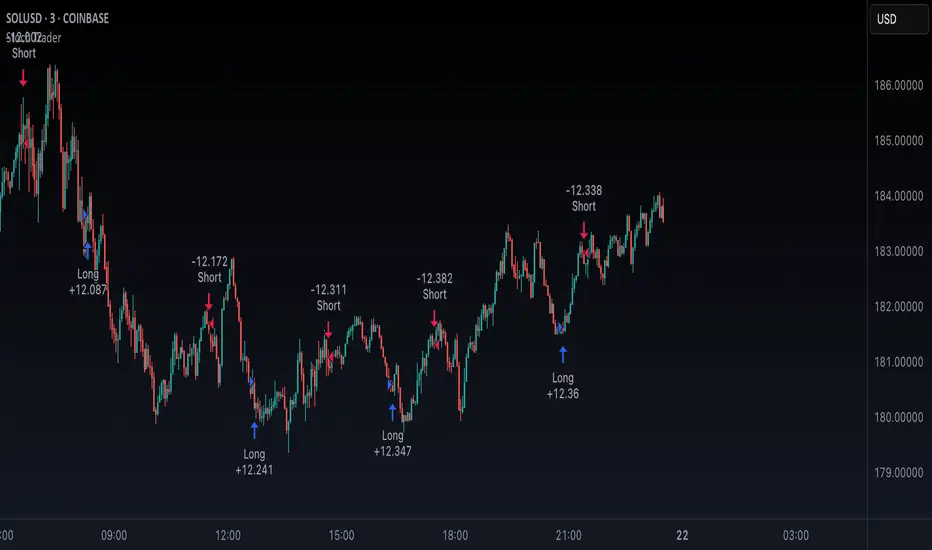
Stoch TraderSimple example strategy that has greater than 60% win rate on 1m, 3m, and 5m views. Using something as simple as this with leverage can produce decent returns within 15-30min. It's also very easy to lose money doing this.
Editable Trade Checklist by Andrei Editable Trade Checklist by Andrei Indicator
This script adds a customizable trade checklist directly onto your chart, helping traders stay disciplined and consistent. It’s designed for discretionary strategies where traders want to visually confirm their rules are met before taking a position.
What It Does
• Displays a visual checklist with up to 10 custom rules
• Each rule uses a checkbox (✔ = Yes, ☐ = No)
• Supports structured decision-making before trade entries
How It Works
In the Inputs tab, you can:
• Rename each checklist item to match your trading plan
• Mark conditions as Yes (checked) or No (unchecked)
• Customize the header and table colors
• Adjust text size for easier viewing — especially useful on mobile
• The checklist appears as a fixed panel on your chart that can be moved to any corner for flexibility
How to Use It
• Add the indicator to your chart
• Open the settings to define your checklist items
• Use checkboxes to track which rules are met
• Review your checklist before taking trades to stay aligned with your strategy
This tool does not produce buy/sell signals — it's built to support manual trade planning and reinforce consistency.
Publishing Notes
This indicator works independently and is published on a clean chart as required. No other scripts or drawings are included. Custom drawings or tools may be used by the trader but are not part of this script.
