Triple Stochastic RSI [XYZ-Trades]Triple Stochastic RSI (original work from XYZ-Trades) with some minor additions to allow user to move table.
Stokastik RSI (STOCH RSI)

Multi Asset & Multi Timeframe Trend DashboardOverview
The Multi-Asset & Multi-Timeframe Trend Dashboard is a comprehensive visual data terminal designed to provide a bird's-eye view of market sentiment across five different assets and seven distinct timeframes simultaneously. By consolidating 10 core technical indicators into a single table, it eliminates the need for "chart hopping" and helps traders identify high-probability trend alignment.
How It Works
The dashboard evaluates each asset based on a Scoring System ($-10$ to $+10$). For every timeframe, the script analyzes the following 10 conditions:
Trend: EMA 20 > EMA 50Macro
Trend: EMA 50 > EMA 200
Position: Price > EMA 200
MACD: MACD Line > Signal Line
MACD Momentum: MACD Histogram > 0
RSI Momentum: RSI(14) > RSI SMA(14)
RSI Level: RSI(14) > 50
Stochastics: Stoch K > D
CCI: Commodity Channel Index > 0
Awesome Oscillator: AO > 0
Visual Logic & Features
Indicator Dots (■): Represent the 10 individual technical conditions. Green indicates a bullish state; Red indicates a bearish state.
Trend Arrows (▲/▼): Displays the aggregate directional bias of a timeframe based on the sum of the 10 dots.
Neutral State (✖): If indicators are split 50/50 (Score of 0), a grey cross is displayed to indicate total market indecision.
"ALL" Column: A macro-summary that aggregates scores across all four primary timeframes.
Volatility Marker (•): A dot appearing next to the symbol name indicates that current ATR is higher than the historical average (user-defined threshold).
Market Status Color: The symbol name background turns Green if the market is currently open and active, and Red if it is closed or stagnant.
Technical Implementation
This script utilizes request.security calls to fetch data across timeframes. To ensure performance and prevent repainting issues, all security calls are handled using the barstate.islast flag to only render the dashboard on the most recent bar.
How to Use
Alignment Trading: Look for "Full House" scenarios where all arrows (15m through Daily) are the same color.
Scalping Bias: Use the "Mini Timeframes" (1m, 3m, 5m) to find entries that align with the higher timeframe trend shown in the main table.
Volatility Filter: Only take trades when the volatility marker (•) is active to ensure there is enough "power" in the move.

Vix FIX dotsDescription
Vix FIX Dots is a momentum and volatility-based trend-following tool. It combines the classic Williams VIX Fix logic with Stochastic and RSI filters to identify high-probability reversal points and trend exhaustion.
Unlike the standard VIX Fix which is often displayed in a separate pane, this script overlays signals directly onto your chart as colorful dots to simplify the decision-making process.
How it Works
The script calculates the "Synthetic VIX" (Williams VIX Fix) to find market bottoms and volatility peaks. To reduce noise and false signals, it incorporates price action filters and trend-strength lookbacks.
Signal Guide
The indicator plots four distinct types of dots:
Green Circle (Below Bar): Filtered Long Entry. This represents a standard buy signal where volatility has peaked and price action confirms a move up.
Blue Circle (Below Bar): Aggressive Long Entry. A faster signal for traders looking to catch a move earlier, based on multi-candle lookbacks.
Red Circle (Above Bar): Filtered Exit/Short. Indicates a standard trend exhaustion point.
Orange Circle (Above Bar): Aggressive Exit/Short. A faster signal indicating the trend may be rolling over.
Key Features
Volatility Bands: Uses Bollinger Bands and Percentile calculations on the VIX Fix to identify extreme exhaustion.
Price Action Filter: Signals only trigger if the current close outperforms a user-defined number of previous bars.
Customizable Lookbacks: Fully adjustable settings for Stochastic and RSI filters to match your specific timeframe (M5, H1, D1, etc.).

Multi Asset + Multi Timeframe DashboardMulti Asset + Multi Timeframe Dashboard
Overview
This indicator is a multi-asset, multi-timeframe trend dashboard designed to provide a fast, structured overview of market direction across several instruments and timeframes at once.
It combines five major assets with four configurable higher timeframes, evaluating each using a fixed set of 10 widely used technical indicators. The results are aggregated into a clear overall trend arrow, allowing traders to quickly assess alignment or divergence without chart clutter.
What This Indicator Does
For each symbol and timeframe, the script evaluates the following technical components:
EMA trend structure (20 / 50 / 200)
MACD line direction
MACD histogram polarity
RSI relative to its moving average
RSI above/below 50
Stochastic K vs D
Commodity Channel Index (CCI)
Awesome Oscillator (AO)
Each component contributes a bullish (+1), bearish (−1), or neutral (0) score.
All scores are aggregated into a single overall trend direction, displayed as:
▲ Uptrend
▼ Downtrend
✖ Neutral / Mixed
This process is repeated across four independent timeframes, giving a compact, multi-timeframe trend overview per asset.
Key Features
Multi-Asset Dashboard
Monitor multiple markets simultaneously from a single table.
Multi-Timeframe Analysis
Four independently selectable timeframes per symbol.
Indicator Aggregation Logic
Combines multiple classic indicators into a single directional signal.
Non-Intrusive Display
Table-based output keeps the chart clean and readable.
Who This Indicator Is For
This tool is designed for traders who want:
A high-level trend overview across assets
Multi-timeframe confirmation
Clear directional signals without stacking many indicators
Immediate notification of meaningful trend changes
It is not a standalone trading system, but a decision-support and market-context tool.
Usage Notes
The table display is optimized for 1-minute to 5-minute charts due to TradingView table rendering limits.
The indicator is intended for analysis and alerting, not automated execution.
All logic is transparent and based on well-known technical indicators.
Disclaimer
This indicator is provided for educational and informational purposes only.
It does not constitute financial advice. Always combine it with proper risk management and independent analysis.

RSI + MACD (RSI Divergence) V3.2
RSI + MACD (RSI Divergence)
This indicator combines RSI divergence detection with a scaled MACD overlay to help traders visualize momentum structure and divergence more clearly in a single pane.
Instead of using RSI and MACD as isolated signals, this script focuses on relative movement, swing structure, and divergence logic, making it especially useful for discretionary traders who analyze momentum behavior rather than fixed indicator levels.
________________________________________
Key Features
RSI Divergence Engine
• Detects Regular Bullish / Bearish Divergence
• Optional Hidden Divergence (for trend continuation)
• Uses confirmed pivot logic (left/right lookback) to avoid repainting
• Adjustable divergence range to filter weak or overly distant signals
RSI is shifted by -50 to center it around zero, allowing better visual alignment with MACD without affecting divergence logic.
________________________________________
Scaled MACD Overlay (Visual Momentum Only)
• MACD, Signal, and Histogram are rescaled dynamically to match the RSI oscillator range
• Designed for wave structure, phase comparison, and momentum timing
• Not intended as a traditional MACD signal generator
• Helps identify momentum agreement or disagreement with RSI divergence
________________________________________
Clean & Practical Design
• Single pane display (no chart clutter)
• Color warnings for RSI overbought / oversold zones
• Adjustable scaling lookback for different markets and timeframes
• Optimized for smooth performance and non-repainting behavior
________________________________________
How to Use
• Best used on indices, crypto, and liquid forex pairs
• Combine RSI divergence signals with:
o Market structure
o Support / resistance
o Trend context
• Use the MACD overlay to:
o Confirm momentum shifts
o Spot early loss of strength
o Compare oscillator phase alignment
This indicator is best suited for analysis and confirmation, not mechanical entry signals.
________________________________________
Notes
• MACD values are scaled for visualization only and do not represent real MACD values
• Divergence signals are confirmation-based, not predictive
• No repainting once pivots are confirmed
________________________________________
Who Is This For?
• Swing traders
• Momentum & divergence traders
• Traders who prefer structure-based confirmation over raw indicator signals
• Anyone who wants RSI & MACD behavior in a single, readable oscillator
Enjoy and happy trading!
DISCLAIMER
This script is intended for informational and educational purposes only. It does not constitute financial, investment, or trading advice. All trading decisions made based on its output are solely the responsibility of the user

BB + RSI Div + Volume + VWAP (4H Perp Short Alert) - SafeThis Indicator use Bollinger Band + RSI Div + Volumne + VWAP for shorting Mid and Small Cap token in 4H timeframe

[RoyalNeuron] RSI-SMA [WidowMaker v1.0]Hey everyone,👋
This is WidowMaker v1.0 — my free take on a really clean, zero-lag smoothed RSI that actually helps you see momentum without all the noise.
What makes it different:
- Smoothed RSI (you pick SMA or EMA) so it doesn’t whipsaw as much as the default one
- Green line when momentum is rising, red when it’s falling — super easy to read at a glance
- Histogram turns solid green for strong upward push, solid red when things are fading
- Very faint green background in oversold (buy zone) and faint red in overbought (caution zone)
Quick way to use it:
- Green line + solid green histogram near the bottom (oversold) → good spot for longs
- Red line + solid red histogram near the top (overbought) → time to think about shorts or taking profit
I made it because I was tired of cluttered indicators that look cool but don’t help much in real trading.
I am thinking of an updated version, still thinking of what to add so that to add value.
Would love your honest feedback — like it, use it, tell me what you’d add. More free tools on the way!
Cheers,
RoyalNeuron 👑
RSI, Smoothed RSI, Momentum, Oscillator, Overbought, Oversold, Histogram, Green Red, Free, Alerts

EMA RSI Adaptive (v6) [Joy]I have taken Glaz's code and converted to V6. The main logic is not mine but taken from Glaz's code
The EMA RSI Adaptive indicator smooths price with an EMA whose speed adjusts to RSI’s distance from its midpoint (50). When RSI strays far from 50 (higher momentum/volatility), the effective EMA period shrinks so the line hugs price. When RSI stays near 50 (quieter conditions), the period lengthens to filter noise. The target of the EMA update is an SMA of price (matching the original design), so you get a smoothed, adaptive trend line rather than a raw EMA of closes.
Key mechanics (what’s happening under the hood):
RSI distance: |RSI - 50| + 1 measures how “charged” momentum is. Bigger distance → faster adaptation.
Dynamic period: a nonlinear mapping turns that RSI distance into an adjusted smoothing length.
Adaptive EMA: ema = emaPrev + alpha * (SMA - emaPrev), where alpha = 2 / (1 + dynamicPeriod).
Visuals: optional color shift—blue when the line is rising, magenta when falling.
Practical use:
Trend filter: rising line = bullish bias; falling line = bearish bias.
Pullback tool: in trends, price tags or minor pierces of the adaptive line can mark pullback zones.
Volatility-aware: it tightens in fast moves (tracks closer) and relaxes in chop (filters more).
On very low timeframes or illiquid symbols, expect more whipsaw; lengthen the base EMA or RSI period to calm it.
The color toggle is cosmetic; the adaptive line itself carries the signal.

Multiple Time Frame Stoch-RSIThis indicator is designed to show users the values for default stochastic RSI and default RSI settings across multiple time frames.
I have made many bad trades focusing too closely on one particular time frame and indicators that suggest the price will move one way, to be superseded by a higher timeframe pushing price in another direction.
The timeframes are customisable so you can select your own timeframes, but the default timeframes chosen here are part of the BareNaked Crypto or Naked Nation strategy, looking at timeframes in multiples of 3 for lower timeframes.
The idea in its simplest form is that when timeframes like the 3/6/9m are all over sold or over bought (coloured red or green) then it could be a suitable time to place an order. Or at least be more favourable for your trade.
This indicator as with all indicators is designed as a tool to add to whatever arsenal of strategy or tools you are already using and does not constitute financial advice, just be cause 3/6/9m is in red or green does not guarantee that the trade will go your way.
The orange on the timeframes are generally designed to show users where price can reverse so for example if the stochastic 3m is at 10 and in green, but the 9m is at 65 in orange, it could be that a push up is not finished and the 9m drop from oversold to 65 could be reversed due to a low 3m stochastic number and then 9m goes from 65 back up to 100, and vice versa.
The arrows for direction also allow you to quickly deduce the direction of the stochastic RSI, ^ up, V down, and stable -. this should allow you to see if the stochastic has been rising and is beginning to turn around or not.

Mini RSI+STOCH-RSI+RSI-DIVERGENCE @Marx_CapitalMini version of RSI + STOCHASTIC-RSI with RSI-Divergence detection - all in one, adjustable small table overlayed on your chart. The table box gives RSI and Stoch-RSI values and signals detected RSI divergences.
Uncheck 'Update only on bar close' in indicator settings if the box does not appear right away.

RSI + STOCH RSI - Marx_CapitalSimple RSI + STOCH RSI indicator in one pane. In addition to the standard 30/70 and 20/80 RSI levels you have three adjustable levels (eg. 0, 50, 100) to indicate STOCH RSI overbought/oversold scenarios.

MTF Stoch RSI + RSI Signalsthis script will provide Buy and sell signals considering RSI and price action

Ehlers Dominant Cycle Stochastic RSIEhlers Enhanced Cycle Stochastic RSI
OVERVIEW
The Ehlers Enhanced Cycle Stochastic RSI is a momentum oscillator that automatically adjusts its lookback periods based on the dominant market cycle. Unlike traditional Stochastic RSI which uses fixed periods, this indicator detects the current cycle length and scales its calculations—making it responsive in fast markets and stable in slow ones.
The indicator combines John Ehlers' digital signal processing research with the classic Stochastic RSI indicator, then adds a confirmation system to ensure cycle measurements are reliable.
THE THEORY
Traditional oscillators use fixed lookback periods (ie, 14-bar RSI). This creates a fundamental problem: markets don't move in fixed cycles. A 14-period RSI might capture the rhythm perfectly during one market phase, then completely miss it when conditions change.
Ehlers' research demonstrated that price data contains measurable cyclical components. If you can detect the dominant cycle length, you can tune your indicators to match it—like tuning a radio to the right frequency.
This indicator takes that concept further by using three independent cycle detection methods and only trusting the measurement when they agree:
Hilbert Transform — A mathematical technique from signal processing that extracts cycle period from the phase relationship between price and its derivative. It is fast but can be noisy.
Autocorrelation Periodogram — Measures how similar the price series is to lagged versions of itself. The lag with highest correlation reveals the dominant cycle. More stable than Hilbert, but slightly slower to adapt.
Goertzel Algorithm (DFT) — A frequency-domain approach that calculates spectral power at each candidate period. Identifies which frequencies contain the most energy.
When all three methods converge on similar period estimates, confidence is high. When they disagree, the market may be in a non-cyclical or in transition.
HOW IT CHANGES THE STOCHASTIC RSI
Standard Stochastic RSI:
1. Calculate RSI with fixed period (14 bars)
2. Apply Stochastic formula over fixed period (14 bars)
3. Smooth with fixed periods
Ehlers Enhanced Cycle Stochastic RSI:
1. Detect dominant cycle using three methods
2. Confirm cycle measurement (methods must agree)
3. Calculate RSI with period scaled to the detected cycle
4. Apply Stochastic formula with cycle-scaled lookback
5. Smooth adaptively
The result: when the market is cycling quickly (say, 15-bar cycles), the indicator uses shorter periods and responds faster. When the market stretches into longer cycles (such as 40-bar cycles), it automatically extends its lookback to avoid whipsaws.
The Period Multipliers let you fine-tune this relationship:
• 1.0 = Use the full detected cycle (smoother, fewer signals)
• 0.5 = Use half the cycle (more responsive, catches turns earlier)
INTERPRETATION
Reading the Oscillator:
• K Line (Blue) — The main signal line. Moves between 0 and 100.
• D Line (Orange) — Smoothed version of K. Use for confirmation.
• Above 80 — Overbought. Momentum stretched to upside.
• Below 20 — Oversold. Momentum stretched to downside.
• Crossovers — K crossing above D suggests bullish momentum shift; K crossing below D suggests bearish.
Spectral Dilation (optional):
When enabled, applies a bandpass filter before cycle detection. This isolates the frequency band of interest and reduces noise. Useful for:
• Very noisy instruments
• Lower timeframes
• When confidence stays persistently low

AJFFRSI+QQEROC Uses Jurik RSI for smooth, responsive momentum measurement
Incorporates QQE features for trend strength and dynamic trailing stop signals
Designed for clearer, more reliable overbought/oversold and reversal signals on TradingView
Suitable for intraday, swing, and longer-term analysis
Not a financial advice. DYOR

Stochastic BTC OptimizedEnhanced Stochastic for Bitcoin (BTC) – Optimized for Daily Timeframe
This enhanced Stochastic oscillator is specifically fine-tuned for BTC/USD on the 1D timeframe, leveraging historical data from Bitstamp (2011–2025) to minimize false signals and maximize reliability in Bitcoin's volatile swings.
Unlike the classic Stochastic (14, 3, 3), this version uses optimized parameters:
- K Period = 21 – smoother reaction, better suited for BTC’s macro cycles
- D Period = 3, Smooth K = 3 – reduces noise while preserving responsiveness
- Overbought = 85, Oversold = 15 – accounts for BTC’s tendency to trend strongly within extreme zones without immediate reversal
✅ Smart Signal Logic:
Buy/sell signals appear only when %K crosses %D inside the oversold (≤15) or overbought (≥85) zones, and only the first signal is shown to avoid whipsaws.
Visual Enhancements:
- Thick lines when %K/%D are in overbought/oversold zones
- Green/red background highlights on valid signals
- Optional up/down arrows for clear entry visualization
- Customizable colors, line widths, and transparency
🔒 No alerts included – clean, focused on price action and momentum.
💡 Pro Tip: For even higher accuracy, use this indicator in combination with a long-term trend filter (e.g., EMA 200). The oscillator excels in ranging or retracement phases but should not be used alone in strong parabolic moves.
Based on Mozilla Public License v2.0 – feel free to use, modify, and share. Perfect for swing traders and long-term Bitcoin analysts seeking high-probability reversal zones.
перевод на русский
Улучшенный Stochastic для Bitcoin (BTC) — оптимизирован для дневного таймфрейма
Этот улучшенный осциллятор Stochastic специально настроен под BTC/USD на дневном графике, с учётом исторических данных Bitstamp (2011–2025), чтобы минимизировать ложные сигналы и повысить надёжность в условиях высокой волатильности биткоина.
В отличие от классического Stochastic (14, 3, 3), эта версия использует оптимизированные параметры:
- Период K = 21 — более плавная реакция, лучше соответствует макроциклам BTC
- Период D = 3, Сглаживание K = 3 — снижает шум, сохраняя отзывчивость
- Уровень перекупленности = 85, перепроданности = 15 — учитывает склонность BTC к сильным трендам в экстремальных зонах без немедленного разворота
✅ Интеллектуальная логика сигналов:
Покупка/продажа отображается только при пересечении %K и %D внутри зоны перепроданности (≤15) или перекупленности (≥85), и только первый сигнал фиксируется, чтобы избежать «хлыстов».
Улучшенная визуализация:
- Жирные линии, когда %K/%D находятся в экстремальных зонах
- Зелёный/красный фон при появлении сигналов
- Опциональные стрелки для чёткого отображения точек входа
- Настройка цветов, толщины линий и прозрачности
🔒 Без алертов — чистый инструмент, сфокусированный на цене и импульсе.
💡 Совет профессионала: для ещё большей точности используйте этот индикатор вместе с трендовым фильтром (например, EMA 200). Осциллятор лучше всего работает в фазах консолидации или отката, но не стоит применять его в одиночку во время сильных параболических движений.
На основе Mozilla Public License v2.0 — свободно используйте, модифицируйте и делитесь. Идеален для свинг-трейдеров и аналитиков Bitcoin, ищущих зоны с высокой вероятностью разворота.

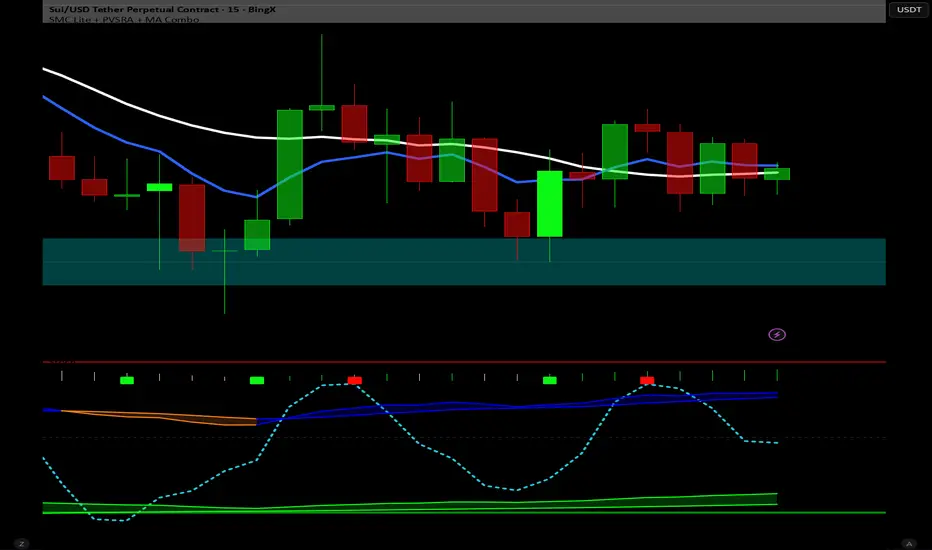
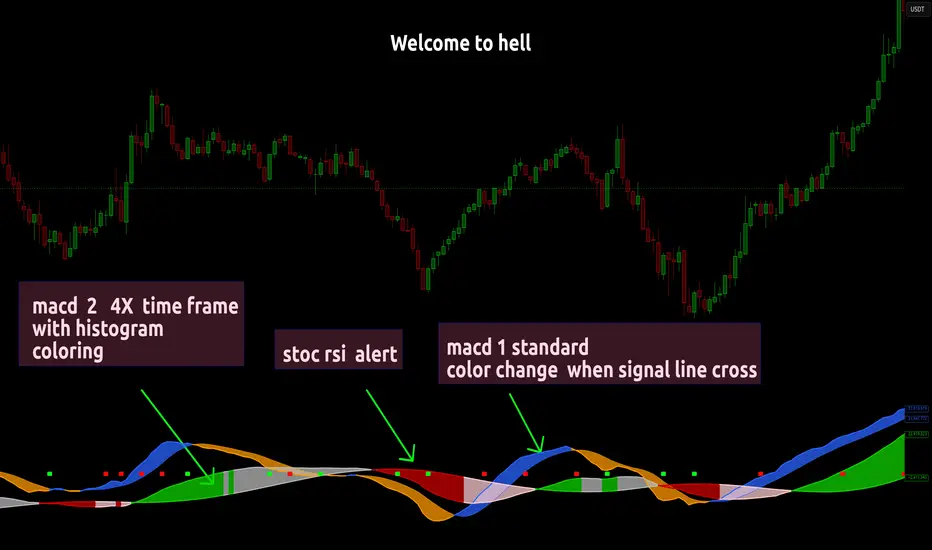
Dual MACD With Pilot Background + + Stoch RSI Alert HELL 2macd 1 chart time macd 2 4x chart time with over bought and over sold stoc rsi alerts
SMI Color Red/Green📌 TradingView Description – SMI Red/Green Momentum Line
🔥 Stochastics Momentum Index (SMI) – Dynamic Red/Green Version
This indicator is an enhanced and modernized version of the Stochastic Momentum Index (SMI), designed to deliver a more visual, intuitive, and responsive view of trend momentum.
It includes:
✔️ Smoothed SMI
✔️ Dynamic Red/Green momentum coloring
✔️ Signal EMA line
✔️ Overbought/Oversold zones with shading
🎨 Dynamic Red/Green SMI Line
The main SMI line automatically changes color based on momentum direction:
Green → Bullish momentum (SMI rising)
Red → Bearish momentum (SMI falling)
This provides instant visual feedback and highlights early momentum changes even before traditional signal-line crossovers.
📉 Indicator Structure
1️⃣ Smoothed SMI
The SMI is calculated using the price’s position inside its range and then smoothed with an SMA to reduce noise.
2️⃣ EMA Signal Line
A customizable EMA acts as a signal line, providing:
Clear bullish/bearish crossovers
Trend confirmation
Cleaner entry/exit signals
3️⃣ Overbought / Oversold Zones
Extreme levels are highlighted using color-filled zones:
Red Zone (Overbought) → potential bearish reversal
Green Zone (Oversold) → potential bullish reversal
Levels are fully adjustable.
💡 How to Use It
The indicator works exceptionally well across all timeframes.
The most powerful signals are:
✔️ SMI crossing above/below the EMA
SMI crosses above EMA → bullish signal
SMI crosses below EMA → bearish signal
✔️ Leaving Overbought/Oversold zones
SMI exits the oversold zone → potential long setup
SMI exits the overbought zone → potential short setup
✔️ Color shifts (momentum direction)
Red → Green : early bullish momentum
Green → Red : early bearish momentum
Perfect for scalping, day trading, and swing trading.
🚀 Why This Version Is Better
Extremely visual momentum reading
Noise reduction through smoothing
Instantly readable color-coded trend
Strong OB/OS zone visualization
Works on any market and timeframe
Great in combination with RSI, MACD, HMA, ALMA, and trend filters
If you'd like, I can also write:
🔹 a SEO-optimized title,
🔹 recommended TradingView tags,
🔹 or a shorter promotional description.

MACD FROM HELLthis is a double macd with 2 time frames macd 1 is chart macd 4 is 4X meaning the 1hr becomes the 4hr and it uses the histogram coloring for added detail ,, on top of that it has stochastic rsi Alerts set to trigger when k line goes above 99.9 or below 0.01 and exits ,, alert triggers on exit
Stochastic RSI - WT Confluence Signal Detectors (TraderDemircan)Description
What This Indicator Does:
This indicator combines two powerful momentum oscillators—WaveTrend and Stochastic RSI—to identify high-probability trading signals through confluence. Instead of relying on a single indicator that may generate false signals, this tool only triggers buy/sell alerts when both oscillators simultaneously confirm extreme market conditions and trend reversals. This confluence approach significantly reduces noise and helps traders focus on the most reliable setups.
Key Features:
Dual-Oscillator Confluence: Generates signals only when both WaveTrend crossovers and Stochastic RSI extreme levels align
Normalized Scale Display: Both oscillators are plotted on a unified -100 to +100 scale for easy visual comparison
Visual Signal Confirmation: Clear intersection points marked with colored circles, plus optional candle coloring at crossover moments
Customizable Thresholds: Adjust overbought/oversold levels for both oscillators to match your trading style and asset volatility
Clean Visual Presentation: Optional area fill showing WaveTrend momentum difference, making divergences easier to spot
How It Works:
The indicator operates on a confluence principle where multiple conditions must align:
For BUY Signals (Green):
WaveTrend 1 crosses above WaveTrend 2 (bullish crossover)
WaveTrend is in oversold territory (below -53 or -60)
Stochastic RSI K-line is below 20 (oversold)
For SELL Signals (Red):
WaveTrend 1 crosses below WaveTrend 2 (bearish crossover)
WaveTrend is in overbought territory (above 53 or 60)
Stochastic RSI K-line is above 80 (overbought)
WaveTrend Component:
Uses the hlc3 price (average of high, low, close) to calculate a channel index that identifies market momentum waves. The two WaveTrend lines (WT1 and WT2) act similarly to MACD, where crossovers indicate momentum shifts. The oscillator ranges from approximately -100 to +100, with extreme values suggesting potential reversals.
Stochastic RSI Component:
Applies stochastic calculations to RSI values rather than raw price, creating a more sensitive momentum indicator. Values above 80 indicate overbought conditions (potential selling opportunity), while values below 20 indicate oversold conditions (potential buying opportunity). The indicator includes both K-line (faster) and D-line (slower, smoothed) for additional confirmation.
Normalization Technology:
To enable direct visual comparison, the Stochastic RSI (normally 0-100 scale) is normalized to match WaveTrend's -100 to +100 scale. This allows traders to see both oscillators' movements in relation to the same reference levels, making divergences and convergences more apparent.
How to Use:
For Trend Traders:
Wait for confluence signals in the direction of the larger trend
Use buy signals in uptrends as entry points during pullbacks
Use sell signals in downtrends as entry points during bounces
For Reversal Traders:
Focus on confluence signals at major support/resistance levels
Look for divergences between price and oscillators before confluence signals
Consider stronger signals when both oscillators reach extreme levels (WT beyond ±60, Stoch beyond 20/80)
For Scalpers:
Lower the WaveTrend Channel Length (default 10) to 5-7 for more frequent signals
Tighten overbought/oversold thresholds slightly (e.g., WT: ±50, Stoch: 30/70)
Use on lower timeframes (5m, 15m) with strict stop losses
Settings Guide:
WaveTrend Parameters:
Channel Length (10): Controls sensitivity. Lower = more signals but more noise. Higher = fewer but more reliable signals
Average Length (21): Smoothing period for WT2. Higher values reduce whipsaws
Overbought Levels (60/53): Two-tier system. Breaching 60 indicates strong overbought, 53 is moderate
Oversold Levels (-60/-53): Mirror of overbought levels for downside extremes
Stochastic RSI Parameters:
K-Smooth (3): Smoothing for the K-line. Higher = smoother but delayed
D-Smooth (3): Additional smoothing for the D-line signal
RSI Period (14): Standard RSI calculation period
Stoch Period (14): Stochastic calculation lookback
Oversold (20) / Overbought (80): Classic thresholds for extreme conditions
Visual Options:
Show WT Difference Area: Displays the momentum difference between WT1 and WT2 as a blue shaded area
Show WT Intersection Points: Marks crossover points with colored circles (red for bearish, green for bullish)
Color Candles at Intersection: Changes candle colors at crossover moments (blue for bearish, yellow for bullish)
Show Stoch Over Signals: Displays when Stochastic RSI breaches extreme levels
What Makes This Original:
While WaveTrend and Stochastic RSI are established indicators, this script's originality lies in:
Confluence Logic: The specific combination requiring simultaneous confirmation from both oscillators in extreme zones, not just simple crossovers
Normalization Approach: Displaying both oscillators on the same -100 to +100 scale for direct visual comparison, which is not standard
Multi-Tier Overbought/Oversold: Using two levels (60/53) instead of one, allowing for nuanced signal strength assessment
Integrated Visual System: Combining area fills, intersection markers, and candle coloring in a coordinated display that shows momentum flow at a glance
Important Considerations:
This is a momentum-based oscillator system, which performs best in ranging or trending markets with clear swings
In strong trending markets, the oscillator may remain in extreme zones for extended periods (remain overbought during strong uptrends, oversold during strong downtrends)
Confluence signals are intentionally rare to maintain quality—expect fewer signals than with single-indicator systems
Always combine with price action analysis, support/resistance levels, and proper risk management
Not recommended for extremely low volatility or thin markets where oscillators may produce erratic readings
Best Timeframes:
Intraday: 15m, 1H (with tighter parameters)
Swing Trading: 4H, Daily (with default parameters)
Position Trading: Daily, Weekly (with extended Channel Length 15-20)
Typical Use Cases:
Identifying exhaustion points in trending markets
Timing entries during pullbacks in established trends
Spotting potential reversal zones at key price levels
Filtering out weak momentum signals during consolidation

Volume Weighted Stochastic RSIThis indicator calculates the Stochastic RSI, enhanced with optional Volume Weighting (VWStochRSI). It measures the level of a (Volume-Weighted) RSI relative to its high-low range over a set period, providing a sensitive momentum oscillator.
Key Features:
Volume-Weighted Core: The indicator is built on a Relative Strength Index (RSI) that can be optionally volume-weighted (Volume weighted).
Customizable Smoothing: The %K and %D lines are smoothed using a customizable moving average. The MA type (Smooth Method) can be selected (e.g., EMA, SMA, WMA) and will also be volume-weighted if the main Volume weighted option is enabled.
Full Divergence Suite (Class A, B, C): The primary feature is the integrated divergence engine. It automatically detects and plots all three major types of divergences:
Regular (A): Signals potential trend reversals.
Hidden (B): Signals potential trend continuations.
Exaggerated (C): Signals weakness at double tops/bottoms.
Divergence Filtering and Visualization:
Price Tolerance Filter: Divergence detection is enhanced with a percentage-based price tolerance (pivPrcTol) to filter out insignificant market noise.
Persistent Visualization: Divergence markers are plotted for the entire duration of the signal and are visually anchored to the %K line level of the confirming pivot.
Note on Confirmation (Lag): Divergence signals rely on a pivot confirmation method to ensure they do not repaint.
The Start of a- divergence is only detected after the confirming pivot is fully formed (a delay based on Pivot Right Bars).
The End of a divergence is detected either instantly (if the signal is invalidated by price action) or with a delay (when a new, non-divergent pivot is confirmed).
Multi-Timeframe (MTF) Capability:
MTF VWStochRSI Lines: The %K and %D lines can be calculated on a higher timeframe, with standard options to handle gaps (Fill Gaps) and prevent repainting (Wait for...).
Limitation: The Divergence detection engine (pivDiv) is disabled if a timeframe other than the chart's timeframe is selected. Divergences are only calculated on the active chart timeframe.
Integrated Alerts: Includes 20 comprehensive alerts for:
The start and end of all 6 divergence types.
The %K line crossing the %D line.
The %K line crossing the Overbought, Oversold, or 50-level lines.
DISCLAIMER
For Informational/Educational Use Only: This indicator is provided for informational and educational purposes only. It does not constitute financial, investment, or trading advice, nor is it a recommendation to buy or sell any asset.
Use at Your Own Risk: All trading decisions you make based on the information or signals generated by this indicator are made solely at your own risk.
No Guarantee of Performance: Past performance is not an indicator of future results. The author makes no guarantee regarding the accuracy of the signals or future profitability.
No Liability: The author shall not be held liable for any financial losses or damages incurred directly or indirectly from the use of this indicator.
Signals Are Not Recommendations: The alerts and visual signals (e.g., crossovers) generated by this tool are not direct recommendations to buy or sell. They are technical observations for your own analysis and consideration.

GTI BGTI: RSI Suite (Standard • Stochastic • Smoothed)
A three-layer momentum and trend toolkit that combines Standard RSI, Stochastic RSI, and a Smoothed/“Macro” RSI to help you read intraday swings, trend transitions, and high-probability reversal/continuation spots.
All in one pane with intuitive coloring and optional divergence markers and alerts.
Why this works
* Stochastic RSI (K/D) visualizes fast momentum swings and timing.
* Standard RSI moves more gradually, helping confirm trend transitions that may span several Stochastic cycles.
* Smoothed RSI (Average → Macro) adds a second-pass filter and slope persistence to reveal the macro direction while suppressing noise.
Used together, Stochastic guides entries/exits around local highs/lows, while the RSI layers improve confidence when a small swing is likely part of a larger turn.
What you’ll see
* Standard RSI (yellow; pink above Bull line, aqua below Bear line).
* Stochastic RSI (K/D) with contextual colors:
* Greens when RSI is weak/oversold (bearish conditions → watch for bullish reversals/continuations).
* Reds when RSI is strong/overbought (bullish conditions → watch for bearish reversals/continuations).
* Smoothed (Macro) RSI with trend color:
* Red when macro is ascending (bullish),
* Aqua when macro is descending (bearish).
* Divergences (optional markers):
* Bearish: RSI Lower High + Price Higher High (red ⬇).
* Bullish: RSI Higher Low + Price Lower Low (green ⬆).
* No repaint: pivots confirm after the chosen right-bars window.
How to use it
* Bullish Reversal
* Macro RSI is reversing at a higher low after price has been in a overall downtrend
* Stochastic RSI is switching from green to red in an overall downtrend
* Bullish Oversold
* Macro RSI is reversing from a significantly low level after price has a short but strong dip during an overall uptrend
* Stochastic RSI is switching from green to red in an overall uptrend
* Bullish Continuation
* Macro RSI is ascending with a strong slope or forming a higher low above the 50 line
* Stochastic RSI is reaching a bottom but still painted red
* Bearish Reversal
* Macro RSI is reversing at a lower high after price has been in a overall uptrend
* Stochastic RSI is switching from red to green in an overall uptrend
* Bearish Overbought
* Macro RSI is reversing from a significantly high level after price has a short but strong jump during an overall downtrend
* Stochastic RSI is switching from red to green in an overall downtrend
* Bearish Continuation
* Macro RSI is descending with a strong slope or forming a lower high below the 50 line
* Stochastic RSI is reaching a top but still painted green
* Divergences: Use as signals of exhaustion—best when aligned with Macro RSI color/slope and key levels (e.g., Bull/Bear lines, 50 midline).
*** IMPORTANT ***
* Stack confluence, don’t single-signal trade. Look for:
* 1) Macro RSI color & slope (red = ascending/bullish, aqua = descending/bearish)
* 2) Standard RSI location (above/below Bull/Bear lines or 50)
* 3) Stoch flip + direction
* 4) Price structure (HH/HL vs LH/LL)
* 5) Divergence type (regular vs hidden) at meaningful levels
* Trade with the macro
* Prioritize longs when Macro RSI is red or just flipped up
* Prioritize shorts when Macro RSI is aqua or just flipped down
* Counter-trend setups = smaller size and faster management.
* Location > signal
* The same crossover/divergence is higher quality near Bull (~60)/Bear(~40) or extremes than in the mid-range chop around 50.
* Early vs confirmed
* Use the early pivot heads-up for anticipation, but scale in only after the confirmed pivot (right-bars complete). If early signal fails to confirm, stand down.
* Define invalidation upfront
* For divergence entries, place stops beyond the pivot extreme (LL/HH). If Macro RSI flips against your trade or RSI breaks back through 50 with slope, exit or tighten.
* Multi-timeframe alignment
* Best results come when entry timeframe (e.g., 1H) aligns with higher-TF macro (e.g., 4H/D). If they disagree, treat it as mean-reversion only.
* Avoid common traps
* Skip: isolated Stochastic flips without RSI support, divergences without price HH/LL confirmation, and serial divergences when Macro RSI slope is strong against the idea.
* Parameter guidance
* Start with defaults; then tune: confirmBars 3–7, minSlope 0.05–0.15 RSI pts/bar, pivot left/right tighter for faster but noisier signals, wider for cleaner but fewer.
* Alerts = workflow, not auto-trades
* Use Macro Flip + Divergence alerts as a checklist trigger; enter only when your confluence rules are met and risk is defined.
Key inputs (tweak to your market/timeframe)
* RSI / Stochastic lengths and K/D smoothing.
* Bull / Bear Lines (default 61.1 / 43.6).
* Average RSI Method/Length (SMA/EMA/RMA/WMA) + Macro Smooth Length.
* Trend confirmation: bars of persistence and minimum slope to reduce flip noise.
* Pivot look-back (left/right) for divergence confirmation strictness.
Alerts included
* Macro Flip Up / Down (Smoothed RSI regime change).
* RSI Bullish/Bearish Divergence (confirmed at pivot).
* Stochastic RSI continuation/divergence (optional).
Tips
* Level + Slope matter. High/low RSI level flags conditions; slope confirms impulse/continuation.
* Let Stochastic time the swing; let Macro RSI filter the trend.
* Tighten or loosen pivot windows to trade fewer/cleaner vs. more/faster signals.

Dual Table Dashboard - Correct V3add RSI Data## 📈 Trading Applications
### 1. Trend Following Strategy
```
1. Check TABLE 1 for trend direction (AnEMA29 + PDMDR)
2. If both green → Look for longs
3. If both red → Look for shorts
4. Use TABLE 2 for entry levels
```
### 2. Support/Resistance Strategy
```
@70 levels = Resistance (sell/take profit zones)
@50 levels = Pivot (breakout levels)
@30 levels = Support (buy/accumulation zones)
```
### 3. Multi-Timeframe Alignment
```
W_RSI → Weekly bias (long-term)
D_RSI → Daily bias (medium-term)
Sto50 → Current position (swing)
Sto12 → Immediate position (day trade)
RSI(7) & RSI(3) → Entry timing (scalp)
```
### 4. Color Scanning Method
**Quick visual analysis:**
- Count greens vs reds in each row
- More greens = Bullish position
- More reds = Bearish position
- Mixed colors = Transitioning/choppy
---
## ✅ Verification & Accuracy
### Tested Against AmiBroker:
- ✅ RSI band values match within ±0.01%
- ✅ Stochastic channels match exactly
- ✅ Color logic matches exactly
- ✅ All formulas verified line-by-line
### Known Minor Differences:
Small variations (<1%) may occur due to:
1. **Platform calculation precision** - Different floating-point engines
2. **Historical data feeds** - Slight variations in past prices
3. **Weekly bar boundaries** - TradingView vs AmiBroker week definitions
4. **Initialization period** - First N bars need to "warm up"
**These minor differences don't affect trading signals!**
---
## ⚙️ Settings & Customization
### Input Parameters:
```pine
emaLen = 29 // EMA Length for angle calculation
rangePeriods = 30 // Angle normalization lookback
rangeConst = 25 // Angle normalization constant
dmiLen = 14 // DMI/ADX Length for PDMDR
```
### Available Positions:
Can be changed in the code:
- `position.top_left`
- `position.top_center`
- `position.top_right`
- `position.middle_left` (Table 2 default)
- `position.middle_center`
- `position.middle_right`
- `position.bottom_left` (Table 1 default)
- `position.bottom_center`
- `position.bottom_right`
### Text Sizes:
- `size.tiny`
- `size.small` (current default)
- `size.normal`
- `size.large`
- `size.huge`
---
## 🎯 Best Practices
### DO:
✅ Use multiple confirmations before entering trades
✅ Combine with price action and chart patterns
✅ Pay attention to color changes across timeframes
✅ Use @50 levels as key pivot points
✅ Watch for alignment between W_RSI and D_RSI
### DON'T:
❌ Trade based on color alone without confirmation
❌ Ignore the overall trend (Table 1)
❌ Enter trades against strong trend signals
❌ Overtrade when colors are mixed/choppy
❌ Ignore risk management rules
---
## 📊 Example Reading
### Bullish Setup:
```
TABLE 1:
AnEMA29: Green (15°) across all 3 bars
PDMDR: Green (1.65) and rising
TABLE 2:
W_RSI@50: Green (price above)
D_RSI@50: Green (price above)
Sto50@50: Green (price above midpoint)
Sto12@50: Green (price above midpoint)
Interpretation: Strong bullish trend confirmed across multiple timeframes
Action: Look for long entries on pullbacks to @50 or @30 levels
```
### Bearish Setup:
```
TABLE 1:
AnEMA29: Red (-12°) across all 3 bars
PDMDR: Red (0.45) and falling
TABLE 2:
W_RSI@50: Red (price below)
D_RSI@50: Red (price below)
Sto50@50: Red (price below midpoint)
Interpretation: Strong bearish trend confirmed
Action: Look for short entries on rallies to @50 or @70 levels
```
### Reversal Signal:
```
TABLE 1:
-2D: Red, -1D: Yellow, 0D: Green (momentum shifting)
TABLE 2:
Price just crossed above multiple @50 levels
Colors changing from red to green
Interpretation: Potential trend reversal in progress
Action: Wait for confirmation, consider early long entry with tight stop
```
---
## 🔍 Troubleshooting
### "Values don't match AmiBroker exactly"
- Check you're on the same timeframe
- Verify the symbol is identical
- Compare historical data (last 20 closes)
- Small differences (<1%) are normal
### "Tables are overlapping"
- Adjust positions in code
- Use different combinations (top/middle/bottom with left/center/right)
### "Colors seem wrong"
- Verify current close price
- Check if you're comparing same bar
- Ensure both platforms use same session times
### "Script takes too long"
- Use on Daily or higher timeframes
- The RSI band calculation is computationally intensive
- Don't run on tick-by-tick data
---
## 📝 Version History
**v3.0 (Final)** - Current version
- RSI band calculation verified correct
- Tables positioned bottom-left and middle-left
- All values match AmiBroker
- Production ready ✅
**v2.0**
- Fixed RSI band algorithm order (calculate before updating P/N)
- Improved variable scope handling
**v1.0**
- Initial implementation
- Had incorrect RSI band calculation
---
## 📄 Files in Package
