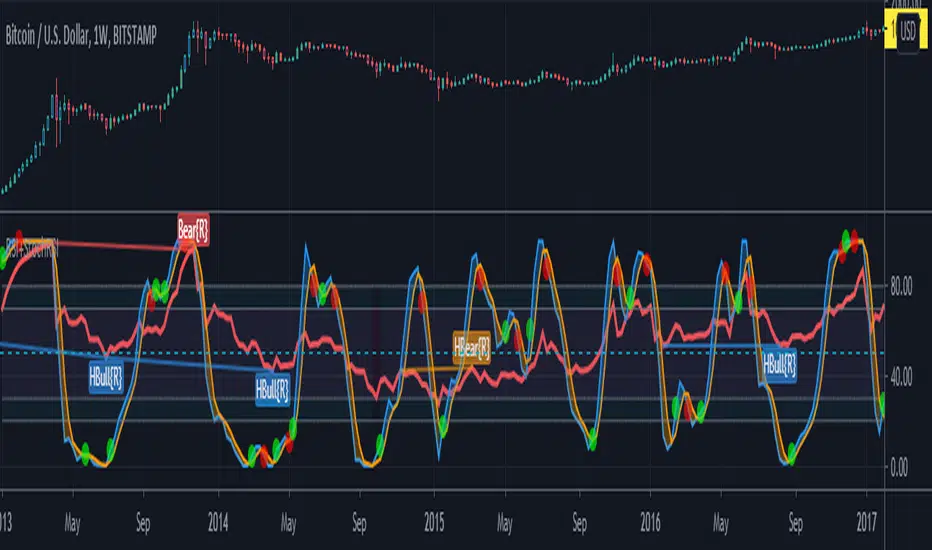
[AU] Waves+ Waves+ v0R7b
Plus version of Waves with components from both Waves Advanced and Mnemosyne. Essentially, Waves+ is highly configurable hybrid wavetrend oscillator and Fibonacci oscillator.
Slow wavetrend component replaced by Follower/Base from Mnemosyne indicator
TTM Squeeze Loose/Strict + Explosion Zones now enabled by default
Extreme Caution Fast Wavetrend Line, Fast wavetrend and Extreme Caution Fast WT cross signal now available
Disabled/removed to speed up script performance and load time: Divergence component, stoch k crossovers, T1 signals. Draw objects reduced from 89 to 64 to conform to Pinescript v4 requirements.
Large inactive code blocks stripped/removed to speed up performance and load time
Stokastik Osilatör

Smurf_Disco_1This is one of the primary indicators for the Smurf_Disco suite - it is a multi-time-frame (modified) stochastic series. Helpful on its own (google MTF stochastics to find some strats and modify settings as you see fit). A part of the Disco, tho.

CBCI RSI ParallelParallel version of CBCI Cu + RSI w/ SMA and EMA. It's both indicators, but combined into one indicator space with an adjustable bidirectional offset for the spacing and location.
According to Constance Brown, both the CBCI and RSI are technically supposed to be used in tandem to easily spot divergences - this is an attempt to put that into practice, in one indicator, in the context of tradingview subscription limitations for non Pro/Premium users.

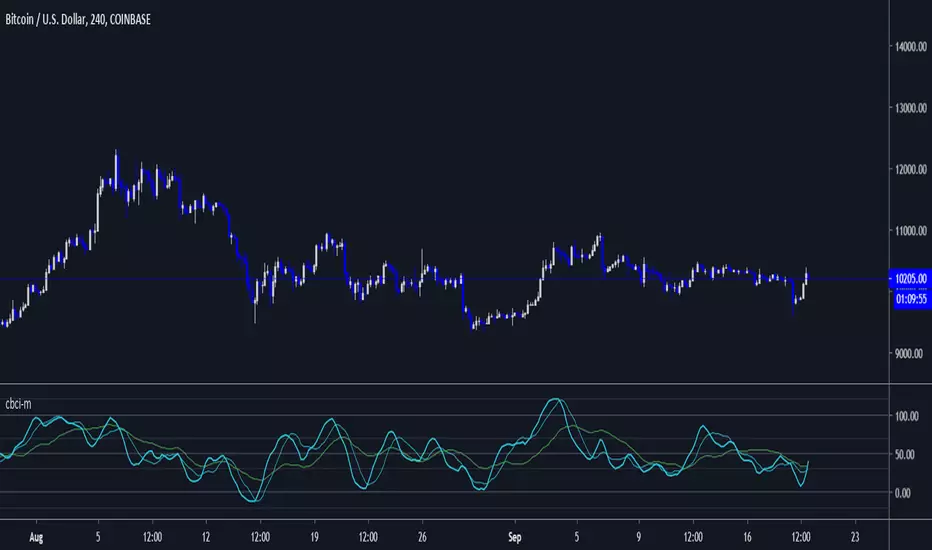
cbci-mModified CBCI with the Composite disabled by default and two additional optional EMAs + hlc3 default source.
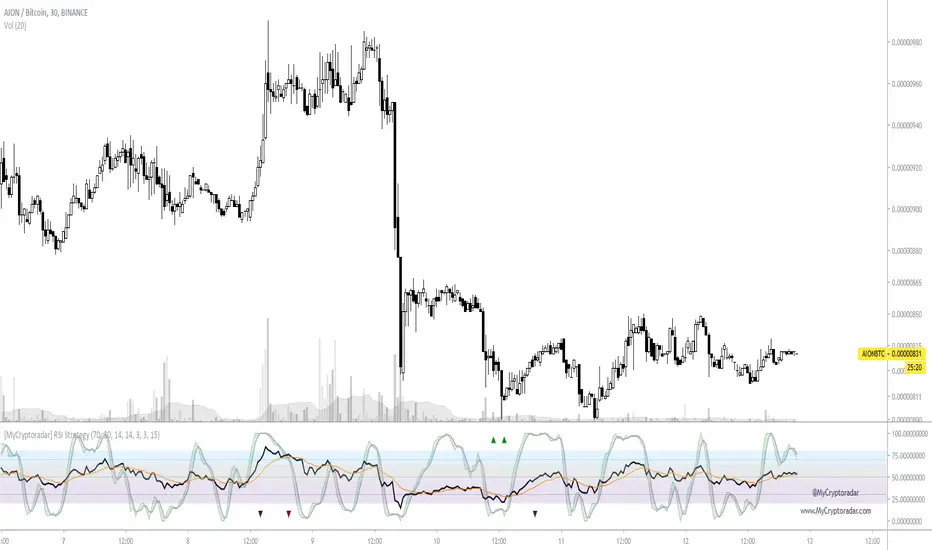
BOSS Relative Strength MeterTHE BEST FOREX, STOCKS, COMMODITIES , AND CRYPTO INDICATORS FOR TRADINGVIEW.COM
The relative strength meter (RSM) is a momentum indicator that measures the magnitude of recent price changes to evaluate overbought or oversold conditions in the price of a stock or other asset.
The RSM is displayed as a color coded meter.
GREEN: Bullish Uptrend
RED: Bearish Downtrend
YELLOW: Disbursement
Highlights:
Add to any chart or time frame
Prints on the current bar in real time
DOES NOT repaint several bars after the fact
Freedom to Tune
User can change colors
Available Here: bosscripts.com
7_Day Trial: bosscripts.com

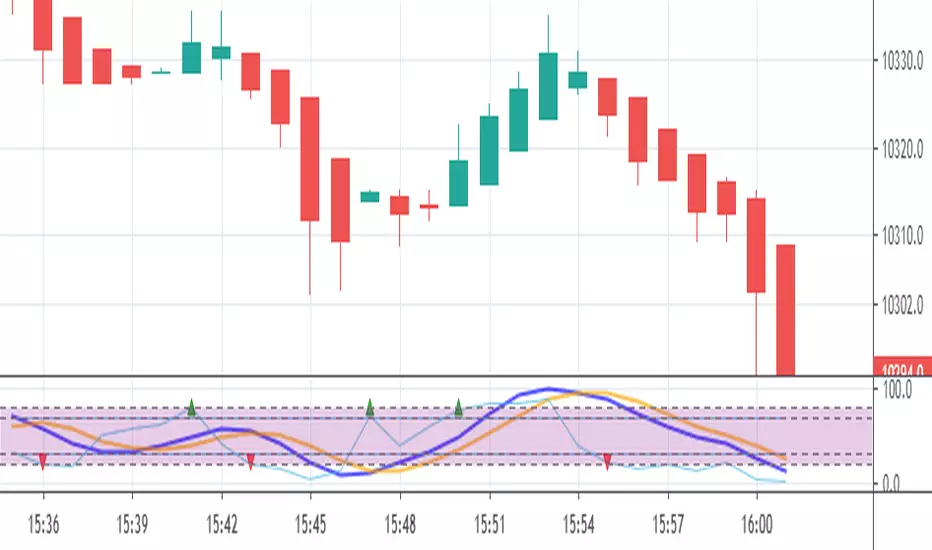
[Coingrats]RSI Divergence + StochRSIThis indicator shows the RSI and StochRSI. RSI divergence will also be marked.
- Bullish divergence - green triangle,
- Hidden bullish divergence - gray triangle
- Bearish divergence = red triangle
- Hidden bearish divergence - gray triangle
Credits to BabyWhale83 for the code to spotting divergence
WANNA TIP ME? BUY ME SOME BEERS!
BTC: 3BMEXX5JrX94ziUSoQMLEmi51WcYwphAg3
ETH: 0x541e504bb461aa141de6ddce09dc89eb16f58f9c
LTC: LPBJXzUZJksCuCK27AY2qAVYGGGiUfejok
DON'T FORGET TO LOOK AT OUR SITE MYCRYPTODARAR.COM

Function : Stochastic Oscillator Here is the Stochastic Oscillator function.
Now you can easily use length with mutable variables !!


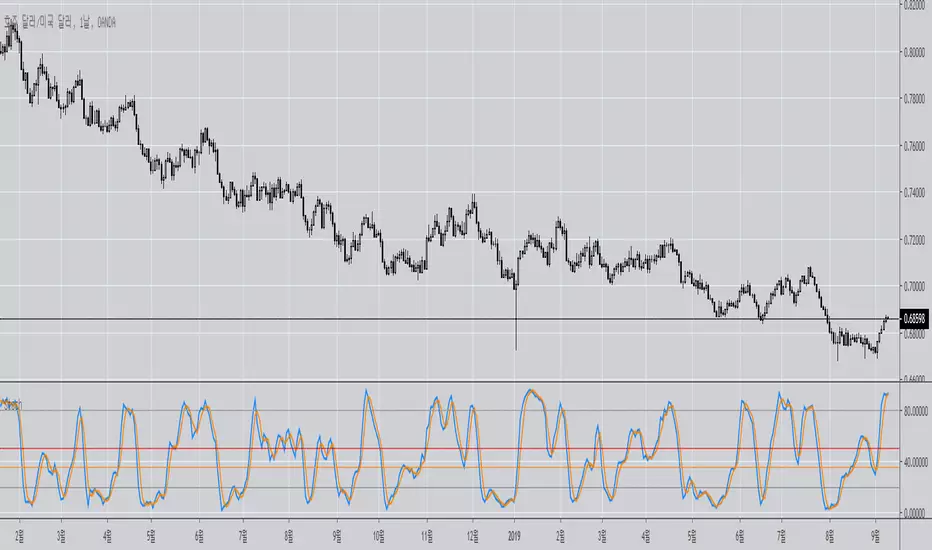
Stochastic [Gu5]To know if we are in range, I recommend my other indicator "Trend Channel Gu5"
Stochastic shows overbought / oversold
--
Para saber cuando no hay tendencia y estamos en rango, recomiendo usar mi indicador "Trend Channel Gu5"
El cruce de K & D nos muestra cundo el mercado esta en sobre-compra o sobre-venta
Las alertas con banderas ayudan a visualizar mas claramente, evitando las alertas duplicadas

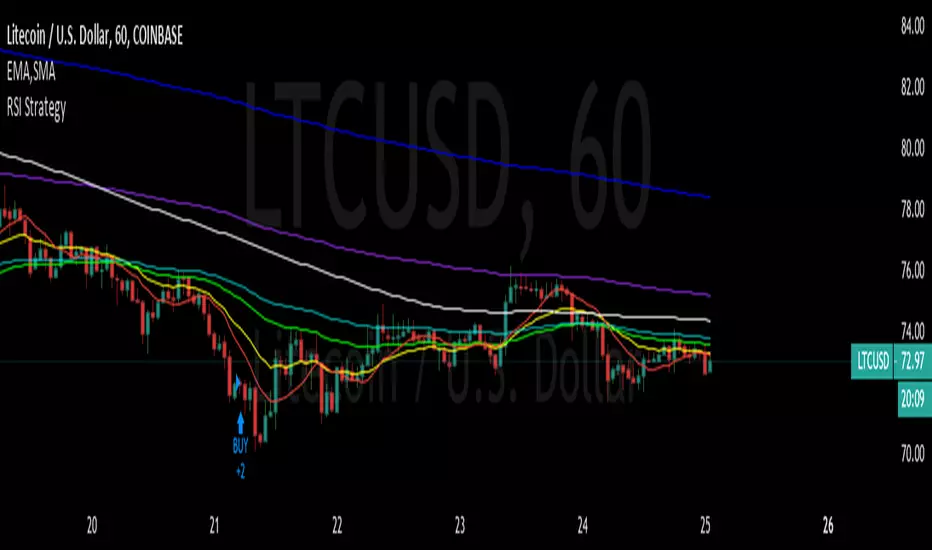
CCI Stochastic and a quick lesson on Scalping & Trading SystemsHello traders
Still on holidays but I don't and will never forget you <3
I realize more and more that you guys don't only want some indicators and learn about pinescript. You also want some guidance and get some mentors providing you with comprehensive and simple trading methods and tricks.
I'm against those posting many scripts a day that in the end will make you lose your money because they don't give you the methodology to use them
It might look nice on the charts but we're not here to do some painting.... but to improve our lifestyle right :)
The today indicator is based on an indicator that I used for scalping : Fxcodebase CCI Stochastic
A CCI stochastic is very reactive and allows us to take many scalps trades per day with a few pips/USD gain for each trade. I don't recommend novice traders to use it and I strongly recommend everyone reading my disclaimer below basically saying "I'm not a financial advisor, don't be dumb, stay safe"
(I also recommend the few scripts copy-pasters to read my disclaimer as well)
What's a novice trader, sir? Well... thanks for asking. A novice trader is any trader with less than 5 years of live trading experience
From a pinescript perspective, this script will be however interesting for everyone :)
How to use it?
The indicator gives 3 possible entries for Longs and Shorts:
- Arrows at Enter - Will give signals whenever the Stoch CCI will enter in the BUY/SELL zone
- Arrows at Exit - Will give signals whenever the Stoch CCI will exit the BUY/SELL zone
- Arrows at Center - Signals whenever the Stoch CCI will cross the mid-line (50)
All arrows have different colors because ... painting is cool and nice.... kidding.... it gives clearer and more readable signals on the chart (but painting sir...)
A possible trading method could be to use the 3 modes at the same time to get the maximum of opportunities.
The safer bet is to use the "Arrows at Exit" only mode but for those who want to accumulate more scalping positions, adding the "Arrows at Enter" mode is an option as well. In other words, you accumulate a few scalping positions whenever the Stoch CCI get in the BUY/SELL zone and will stop accumulating whenever it will exit the BUY/SELL zone
You can add a few extra positions whenever the Stoch CCI will cross the mid-line as it often translates in a trend continuation
Life hack
Very important note : (probably the most important gem I shared until now) The inputs set by default will have to be changed for your asset/timeframe and can't be generic for everything. You have to play with the inputs until the signals will make sense to you
The indicator/strategy with a unique configuration that you'll never check or update according to the market condition DOES NOT exit.
If you find such a tool and prove me that you're making constant gains with it over a year, please patent it and then show it to me as I'd like to study it to replicate :) But most likely this is a myth/unicorn
Who I am to say this? Well, I worked in a Bank with real traders and I have a good sense of what works and what will certainly not work
My guru said scalping crypto in 1 second timeframe was the way to get rich quick. Do you agree sir?
But in trading, this is not because you take the maximum of trades possible that your gains will increase. This is the contrary.
There is a strong and proven inverse correlation between the number of trades taken and how fast you'll burn your capital. A swing trader taking 2/3 trades a month is more likely to beat 99% of the scalpers out there trying to predict all market movements. (and I'm not even talking about how dangerous it is to scalp with leverage)
You're starting to know me a bit more right now. I prefer to tell you what you need to hear vs what you want to hear because the second option doesn't allow to stay in the game very long.
I might lose some futures clients along the way by saying that but for my own conscience and ethics, I prefer to warn about the true risks of trading and to select who you listen very carefully (the advice also works for me, if you feel what I said doesn't make sense, this is totally your right but I hope this is because I'm french and not because of the content ^^).
See you tomorrow for another indicator or idea
Love you all
Dave
____________________________________________________________
Be sure to hit the thumbs up. Building those indicators take a lot of time and likes are always rewarding for me :) (tips are accepted too)
- If you want to suggest some indicators that I can develop and share with the community, please use my personal TRELLO board
- I'm an officially approved PineEditor/LUA/MT4 approved mentor on codementor. You can request a coaching with me if you want and I'll teach you how to build kick-ass indicators and strategies
Jump on a 1 to 1 coaching with me
- You can also hire for a custom dev of your indicator/strategy/bot/chrome extension/python
Disclaimer:
Trading involves a high level of financial risk, and may not be appropriate because you may experience losses greater than your deposit. Leverage can be against you.
Do not trade with capital that you can not afford to lose. You must be aware and have a complete understanding of all the risks associated with the market and trading. We can not be held responsible for any loss you incur.
Trading also involves risks of gambling addiction.
Please notice I do not provide financial advice - my indicators, strategies, educational ideas are intended to provide only some source code for anyone interested in improving their trading
The proprietary indicators and strategies developed by Best Trading Indicator, the object of intellectual property rights are and remain the exclusive property of Best Trading Indicator, at the exclusion of images and videos and texts free of rights or provided by the Company or external legal or physical person.
No assignment of intellectual property rights is carried out through these Terms and Conditions.
Any total or partial reproduction, modification or use of these properties for any reason whatsoever is strictly prohibited without the express written authorization of the Company.

Scott's MTF: RSI with ema and stochasticMultiple time frame rsi and stoch may be useful for backtesting.... like... one won't have to switch between time frames when using candle replay mode.

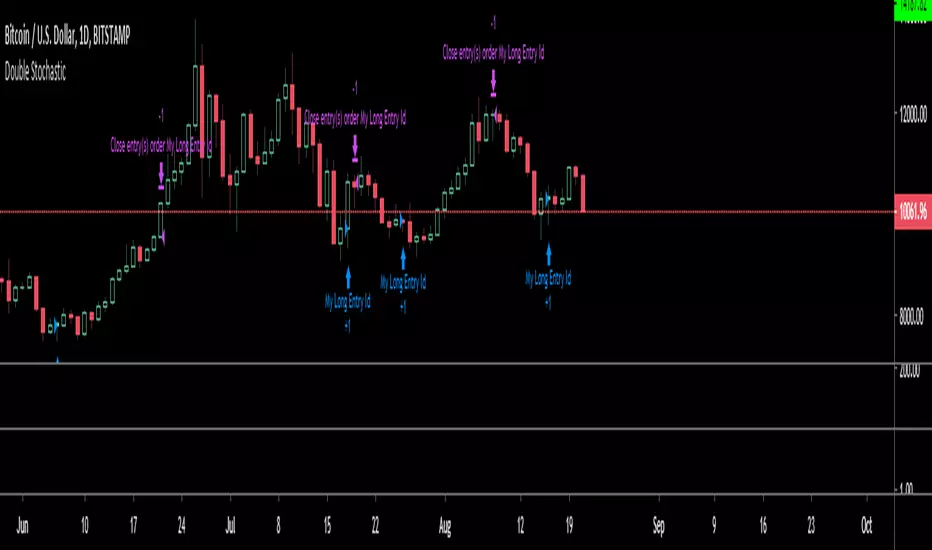
Double StochasticUses two sets of stochastic's to find bull/bear conditions tested on BTC daily and Gold etf weekly charts
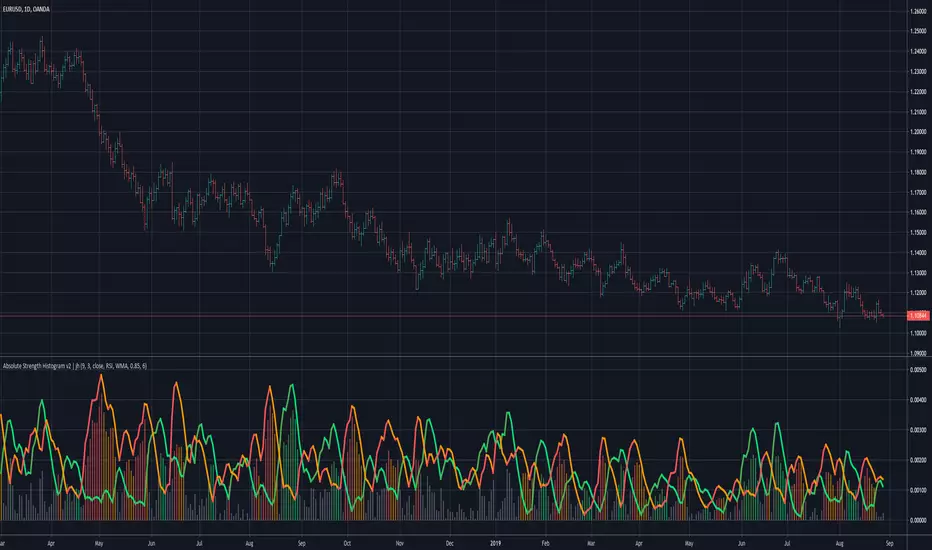
Absolute Strength Histogram v2 | jhv2 changes the way the histogram is plotted.
Histogram shows the strength and can be used to identify trending or ranging periods.
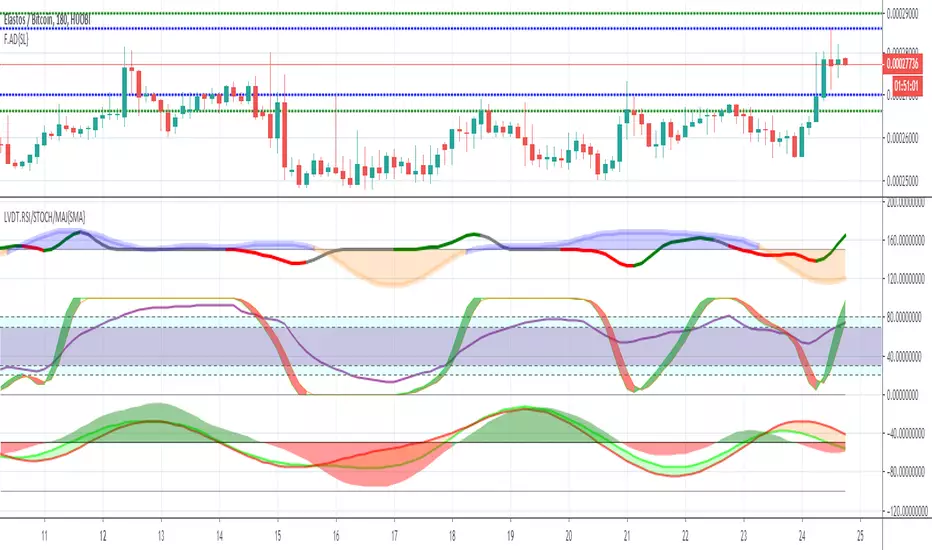
LIVIDITIUM RSI/STOCH/MAJ Oscillator Set {SMA}LVDT RSI oscillator
LVDT STOCHASTIC-RSI oscillator
LVDT MAJ (Momentum/Acceleration/Jerk) oscillators + signals ( Default = Disabled)
~JuniAiko
(=^~^=)v~
Absolute Strength Histogram | jhOriginal ASH code from alexgrover
Some changes:
- Change the price to SMA with Period of 1 with reference to the original MT4 code
- Added a few more MAs

CRSI & StochRSI ESHMAN v3This indicator was created to back a strategy. uses CRSI and StochRSI. Indicator may not be useful without the underlying strategy.
Publisher take no responsibility for your loss. Use at your own risk.
Added crossover and crossunder.
CRSI & Stoch RSI EshmanThis indicator is combination of CRSI and Stoch RSI. This indicator is created to back a strategy to catch all Long and Short rallies. There are additional confirmations required for trade which are only mentioned in the underlying strategy.
The publisher take no responsibility of your loss. Use at your own risk.

True Strength V2True strength using two stochastic's and a VWMA , can use for cycle indication as well

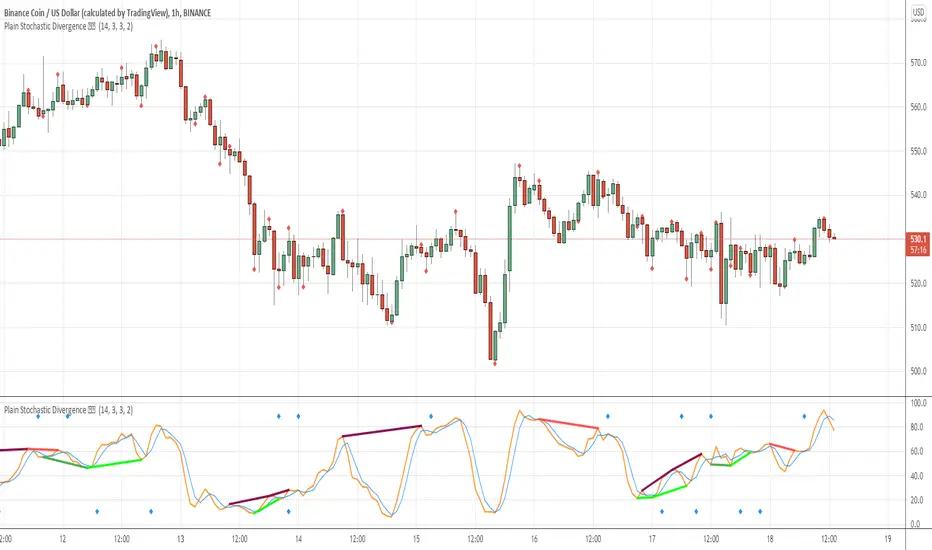
Plain Stochastic Divergence Stochastic Divergence
Plain simple way of calculating divergences
We all have times when we want to see just the divergences and nothning else
This script is minimalised to visualize that
references :
// stochastic // divergence // stoch //