Modern Portfolio TheoryModern Portfolio Theory
The indicator is designed to apply the principles of Modern Portfolio Theory, a financial theory developed by Harry Markowitz. MPT aims to maximize portfolio returns for a given level of risk by diversifying investments.
User Inputs:
Users can customize various parameters, including the bar scale, risk-free rate, and the start year for the portfolio. Additionally, users can assign weights to different assets (symbols) in the portfolio.
Asset Selection:
Users can choose up to 10 different symbols (assets) for the portfolio. The script supports a variety of symbols, including cryptocurrencies such as BTCUSD and ETHUSD.
Weights and Allocation:
Users can assign weights to each selected asset, determining its percentage allocation in the portfolio. The script calculates the total portfolio weight to ensure it equals 100%. If total portfolio weight is lower then 100% you will see orange color with additional cash % bellow
If total portfolio weight is bigger then 100% you will see red big % warning.
Warning: (Total Weight must be 100%)
Cash Mode:
Risk and Return Calculation:
The script calculates the daily returns and standard deviation for each selected asset. These metrics are essential for assessing the risk and return of each asset, as well as the overall portfolio.
Scatter Plot Visualization:
The indicator includes a scatter plot that visualizes the risk-return profile of each asset. Each point on the plot represents an asset, and its position is determined by its risk (X-axis) and return (Y-axis).
Portfolio Optimization:
The script calculates the risk and return of the overall portfolio based on the selected assets and their weights. Based on the selected assets and their weights user can create optimal portfolio with preferable risk and return.
It then plots the portfolio point on the scatter plot, indicating its risk-return profile.
Additional Information:
The indicator provides a table displaying information about each selected asset, including its symbol, weight, and total portfolio weight. The table also shows the total portfolio weight and, if applicable, the percentage allocated to cash.
Visualization and Legend:
The script includes visual elements such as a legend, capital allocation line (CAL), and labels for risk-free rate and key information. This enhances the overall understanding of the portfolio's risk and return characteristics.
User Guidance:
The script provides informative labels and comments to guide users through the interpretation of the scatter plot, risk-return axes, and other key elements.
Interactivity:
Users can interact with the indicator on the TradingView platform, exploring different asset combinations and weightings to observe the resulting changes in the portfolio's risk and return.
In summary, this Pine Script serves as a comprehensive tool for traders and investors interested in applying Modern Portfolio Theory principles to optimize their portfolio allocations based on individual asset characteristics, risk preferences, and return
Standart Sapma

Z-score changeAs a wise man once said that:
1. beginners think in $ change
2. intermediates think in % change
3. pros think in Z change
Here is the "Z-score change" indicator that calculates up/down moves normalized by standard deviation (volatility) displayed as bar chart with 1,2 and 3 stdev levels.

CARNAC Elasticity IndicatorThe CARNAC Elasticity Indicator (EI) is a technical analysis tool designed for traders and investors using TradingView. It calculates the percentage deviation of the current price from an Exponential Moving Average (EMA) and helps traders identify potential overbought and oversold conditions in a financial instrument.
Key Features:
EMA Length: Users can customize the length of the Exponential Moving Average (EMA) used in the calculations by adjusting the "EMA Length" parameter in the indicator settings.
Percentage Deviation: The indicator calculates the percentage deviation of the current price from the EMA. Positive values indicate prices above the EMA, while negative values indicate prices below the EMA.
Maximum Deviations: The indicator tracks the maximum positive (above EMA) and negative (below EMA) percentage deviations over time, allowing traders to monitor extreme price movements.
Bands: Upper and lower bands are displayed on the indicator chart at 100 and -100, respectively. Additionally, dashed middle bands at 50 and -50 provide reference points for moderate deviations.
Dynamic Color Coding: The indicator uses dynamic color coding to highlight the current percentage deviation. It turns red for values above 50 (indicating potential overbought conditions), green for values below -50 (indicating potential oversold conditions), and purple for values in between.
How to Use:
Overbought Conditions: Watch for the percentage deviation to cross above 50, indicating potential overbought conditions. This might be a signal to consider selling or taking profits.
Oversold Conditions: Look for the percentage deviation to cross below -50, signaling potential oversold conditions. This could be an opportunity to consider buying or entering a long position.
Historical Extremes: Keep an eye on the upper and lower bands (100 and -100) to identify historical extremes in percentage deviation.
The CARNAC Elasticity Indicator can be a valuable tool for traders seeking to identify potential trend reversals and assess the strength of price movements. However, it should be used in conjunction with other technical analysis tools and risk management strategies for comprehensive trading decisions.

Rolling VWAP [QuantraSystems]Rolling VWAP
Introduction
The Rolling VWAP (R͜͡oll-VWAP) indicator modernizes the traditional VWAP by recalculating continuously on a rolling window, making it adept at pinpointing market trends and breakout points.
Its dual functionality includes both the dynamic rolling VWAP and a customizable anchored VWAP, enhanced by color-coded visual cues, thereby offering traders valuable flexibility and insight for their market analysis.
Legend
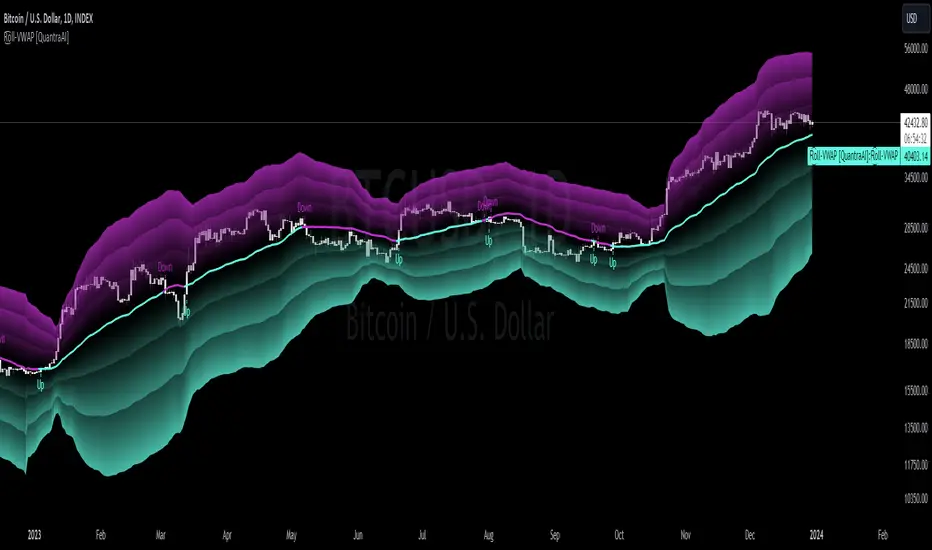
In the Image you can see the BTCUSD 1D Chart with the R͜͡oll-VWAP overlay.
You can see the individually activatable Standard Deviation (SD) Bands and the main VWAP Line.
It also features a Trend Signal which is deactivated by default and can be enabled if required.
Furthermore you can find the coloring of the VWAP line to represent the Trend.
In this case the trend itself is defined as:
Close being greater than the VWAP line -> Uptrend
Close below the VWAP line -> Downtrend
Notes
The R͜͡oll-VWAP can be used in a variety of ways.
Volatility adjusted expected range
This aims to identify in which range the asset is likely to move - according to the historical values the SD Bands are calculated and thus their according probabilities displayed.
Trend analysis
Trending above or below the VWAP shows up or down trends accordingly.
S/R Levels
Based on the probability distribution the 2. SD often works as a Resistance level and either mid line or 1. SD lines can act as S/R levels
Unsustainable levels
Based on the probability distributions a SD level of beyond 2.5, especially 3 and higher is hit very seldom and highly unsustainable.
This can either mean a mean reversion state or a momentum slowdown is necessary to get back to a sustainable level.
Please note that we always advise to find more confluence by additional indicators.
Traders are encouraged to test and determine the most suitable settings for their specific trading strategies and timeframes.
Methodology
The R͜͡oll-VWAP is based on the inbuilt TV VWAP.
It expands upon the limitations of having an anchored timeframe and thus a limited data set that is being reset constantly.
Instead we have integrated a rolling nature that continuously calculates the VWAP over a customizable lookback.
To also keep the base utility it is possible to use the anchored timeframes as well.
Furthermore the visualization has been improved and we added the coloring of the main VWAP line according to the Trend as stated above.
The applicable Trend signals are also part of that.
The parameter settings and also the visualizations allow for ample customizations by the trader.
For questions or recommendations, please feel free to seek contact in the comments.
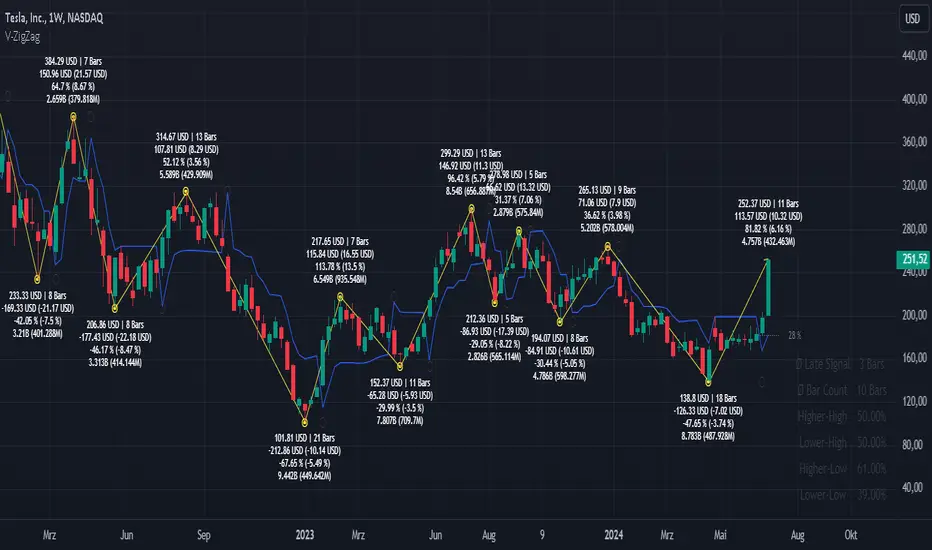
Volatility ZigZagIt calculates and plots zigzag lines based on volatility and price movements. It has various inputs for customization, allowing you to adjust parameters like source data, length, deviation, line styling, and labeling options.
The indicator identifies pivot points in the price movement, drawing lines between these pivots based on the deviation from certain price levels or volatility measures.
The script labels various data points at the ZigZag pivot points on the chart. These labels provide information about different aspects of the price movement and volume around these pivot points. Here's a breakdown of what gets labeled:
Price Change: Indicates the absolute and average percentage change between the two pivot points. It displays the absolute or relative change in price as a percentage. Additionally, the average absolute price increase or the average rate of increase can also be labeled.
Volume: Shows the total volume and average volume between the two pivot points.
Number of Bars: Indicates the number of bars between the current and the last pivot point.
Reversal Price: Displays the price of the reversal point (the previous pivot).
Machine Learning: STDEV Oscillator [YinYangAlgorithms]This Indicator aims to fill a gap within traditional Standard Deviation Analysis. Rather than its usual applications, this Indicator focuses on applying Standard Deviation within an Oscillator and likewise applying a Machine Learning approach to it. By doing so, we may hope to achieve an Adaptive Oscillator which can help display when the price is deviating from its standard movement. This Indicator may help display both when the price is Overbought or Underbought, and likewise, where the price may face Support and Resistance. The reason for this is that rather than simply plotting a Machine Learning Standard Deviation (STDEV), we instead create a High and a Low variant of STDEV, and then use its Highest and Lowest values calculated within another Deviation to create Deviation Zones. These zones may help to display these Support and Resistance locations; and likewise may help to show if the price is Overbought or Oversold based on its placement within these zones. This Oscillator may also help display Momentum when the High and/or Low STDEV crosses the midline (0). Lastly, this Oscillator may also be useful for seeing the spacing between the High and Low of the STDEV; large spacing may represent volatility within the STDEV which may be helpful for seeing when there is Momentum in the form of volatility.
Tutorial:
Above is an example of how this Indicator looks on BTC/USDT 1 Day. As you may see, when the price has parabolic movement, so does the STDEV. This is due to this price movement deviating from the mean of the data. Therefore when these parabolic movements occur, we create the Deviation Zones accordingly, in hopes that it may help to project future Support and Resistance locations as well as helping to display when the price is Overbought and Oversold.
If we zoom in a little bit, you may notice that the Support Zone (Blue) is smaller than the Resistance Zone (Orange). This is simply because during the last Bull Market there was more parabolic price deviation than there was during the Bear Market. You may see this if you refer to their values; the Resistance Zone goes to ~18k whereas the Support Zone is ~10.5k. This is completely normal and the way it is supposed to work. Due to the nature of how STDEV works, this Oscillator doesn’t use a 1:1 ratio and instead can develop and expand as exponential price action occurs.
The Neutral (0) line may also act as a Support and Resistance location. In the example above we can see how when the STDEV is below it, it acts as Resistance; and when it’s above it, it acts as Support.
This Neutral line may also provide us with insight as towards the momentum within the market and when it has shifted. When the STDEV is below the Neutral line, the market may be considered Bearish. When the STDEV is above the Neutral line, the market may be considered Bullish.
The Red Line represents the STDEV’s High and the Green Line represents the STDEV’s Low. When the STDEV’s High and Low get tight and close together, this may represent there is currently Low Volatility in the market. Low Volatility may cause consolidation to occur, however it also leaves room for expansion.
However, when the STDEV’s High and Low are quite spaced apart, this may represent High levels of Volatility in the market. This may mean the market is more prone to parabolic movements and expansion.
We will conclude our Tutorial here. Hopefully this has given you some insight into how applying Machine Learning to a High and Low STDEV then creating Deviation Zones based on it may help project when the Momentum of the Market is Bullish or Bearish; likewise when the price is Overbought or Oversold; and lastly where the price may face Support and Resistance in the form of STDEV.
If you have any questions, comments, ideas or concerns please don't hesitate to contact us.
HAPPY TRADING!

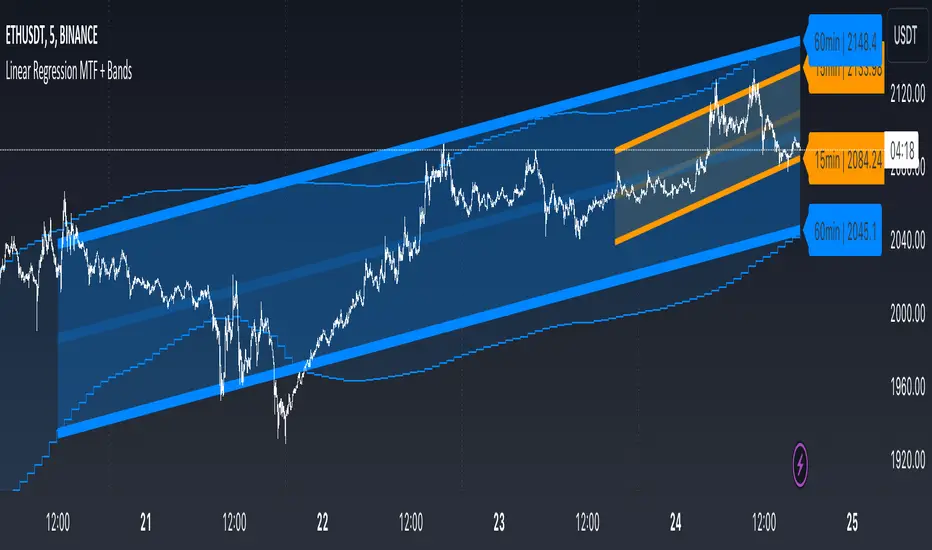
Linear Regression MTF + Bands
Multiple Time Frames (MTFs): The indicator allows you to view linear regression trends over three different time frames (TF1, TF2, TF3) simultaneously. This means a trader can observe short, medium, and long-term trends on a single chart, which is valuable for understanding overall market direction and making cross-timeframe comparisons.
Linear Regression Bands: For each time frame, the indicator calculates linear regression bands. These bands represent the expected price range based on past prices. The middle line is the linear regression line, and the upper and lower lines are set at a specified deviation from this line. Traders can use these bands to spot potential overbought or oversold conditions, or to anticipate future price movements.
History Bands: Looking at linear regression channels can be deceiving if the user does not understand the calculation. In order to see where the channel was at in history the user can display the history bands to see where price actual was in a non-repainting fashion.
Customization Options: Traders can customize various aspects of the indicator, such as whether to display each time frame, the length of the linear regression (how many past data points it considers), and the deviation for the bands. This flexibility allows traders to adapt the indicator to their specific trading style and the asset they are analyzing.
Alerts: The script includes functionality to set alerts based on the price crossing the upper or lower bands of any time frame. This feature helps traders to be notified of potential trading opportunities or risks without constantly monitoring the chart.
Examples
The 15minute linear regression is overlayed onto a 5 minute chart. We are able to see higher timeframe average and extremes. The average is the middle of the channel and the extremes are the outer edges of the bands. The bands are non-repainting meaning that is the actual value of the channel at that place in time.
Here multiple channels are shown at once. We have a linear regression for the 5, 15, and 60 minute charts. If your strategy uses those timeframes you can see the average and overbought/oversold areas without having to flip through charts.
In this example we show just the history bands. The bands could be thought of as a "don't diddle in the middle" area if your strategy is looking for reversals
You can extend the channel into the future via the various input settings.
Z-Score - AsymmetrikZ-Score-Asymmetrik User Manual
Introduction
The Z-Score Indicator is a powerful tool used in technical analysis to measure how far a data point is from the mean value of a dataset, measured in terms of standard deviations. This indicator helps traders identify potential overbought or oversold conditions in the market.
This user manual provides a comprehensive guide on how to use the Z-Score Indicator in TradingView.
0. Quickstart
- Set the thresholds based on your asset (number of standard deviations that you consider being extreme for this asset / timeframe).
- Red background indicates a possible overbought situation, green background an oversold one.
- The color and direction of the Z-Score Line acts as a confirmation of the trend reversal.
1. Indicator Overview
The Z-Score Indicator, also known as the Z-Score Oscillator, is designed to display the Z-Score of a selected financial instrument on your TradingView chart. The Z-Score measures how many standard deviations an asset's price is from its mean (average) price over a specified period.
The indicator consists of the following components:
- Z-Score Line: This line represents the Z-Score value and is displayed on the indicator panel.
- Background Color: The background color of the indicator panel changes based on user-defined thresholds.
2. Inputs
The indicator provides several customizable inputs to tailor it to your specific trading preferences:
- Number of Periods: This input allows you to define the number of periods over which the Z-Score will be calculated. A longer period will provide a smoother Z-Score line but may be less responsive to recent price changes.
- Z-Score Low Threshold: Sets the lower threshold value for the Z-Score. When the Z-Score crosses below this threshold, the background color of the indicator panel changes accordingly.
- Z-Score High Threshold: Sets the upper threshold value for the Z-Score. When the Z-Score crosses above this threshold, the background color of the indicator panel changes accordingly.
3. How to Use the Indicator
Here are the steps to use the Z-Score Indicator:
- Adjust Parameters: Modify the indicator's inputs as needed. You can change the number of periods for the Z-Score calculation and set your desired low and high thresholds.
- Interpret the Indicator: Observe the Z-Score line on the indicator panel. It fluctuates above and below zero. Pay attention to the background color changes when the Z-Score crosses your specified thresholds.
4. Interpreting the Indicator
- Z-Score Line: The Z-Score line represents the current Z-Score value. When it is above zero, it suggests that the asset's price is above the mean, indicating potential overvaluation. When below zero, it suggests undervaluation.
- Background Color: The background color of the indicator panel changes based on the Z-Score's position relative to the specified thresholds. Green indicates the Z-Score is below the low threshold (potential undervaluation), while red indicates it is above the high threshold (potential overvaluation).
- Z-Score Line Color: The color of the Z-Score line shows that the Z-Score is trending up compared to its moving average. This can be used as a validation of the background color.
5. Customization Options
You can customize the Z-Score Indicator in the following ways:
- Adjust Inputs: Modify the number of periods and the Z-Score thresholds.
- Change Line and Background Colors: You can customize the colors of the Z-Score line and background by editing the indicator's script.
6. Troubleshooting
If you encounter any issues while using the Z-Score Indicator, make sure to check the following:
- Ensure that the indicator is applied correctly to your chart.
- Verify that the indicator's inputs match your intended settings.
- Contact me for more support if needed
7. Conclusion
The Z-Score Indicator is a valuable tool for traders and investors to identify potential overbought and oversold conditions in the market. By understanding how the Z-Score works and customizing it to your preferences, you can integrate it into your trading strategy to make informed decisions.
Remember that trading involves risk, and it's essential to combine technical indicators like the Z-Score with other analysis methods and risk management strategies for successful trading.

Directional Bollinger Bands PredictorThis strategy works on the principal that if Bollinger bands are closer to each other then the price is sideways and if it expands then the market is trending.
The strategy is built with a standard deviation of 2 from the EMA 20 and with a range of 0.25.
Explanation of Input Settings:
1. EMA Length: Set as a standard 20 EMA however the trader can make changes if required
2. Standard Deviation Multiplier: This depicts the value of the bands that are formed in association to the EMA value. The default is set to 2 however the same can be changed by the trader.
3. Threshold Value: The threshold Value is the percentage of squeeze within the bands that show if the market is sideways or not. The standard is set at 0.25 however it can be changed.
Unlike the standard Bollinger Bands this indicator will help the user differentiate between rangebound markets and trending markets as a result of which the user can deploy the following trading systems
A. Small reversal trades from the upper band to the lower band when the area is highlighted and the market is range bound and
B. Trend following trades when the bands start expanding and the highlight is omitted.

Credit Spreads Trend Trading Indicator
This is a credit spreads trend following indicator designed to assist credit spreads traders in identifying trends and exploring trade ideas.
High Level Overview
It is based on a 200 period moving average line and incorporates calculations related to expected moves, which are derived from the stock's historical volatility. These calculations generate bands that may suggest possible ranges and trends. For example, the green band is one standard deviation based on historical volatility above the 200 period moving average while the red band is one standard based on historical volatility below the 200 period moving average. The grey line on the chart is the 200 period moving average. Historical volatility in this instance is calculated by looking at the last 252 candles.
How You Can Use It
You can use these bands to assist in trend analysis. For instance, if the stock is above the green line, the stock typically appears to be bullish. If the stock is below the red line, the stock typically appears to be bearish. When the market is between the red line and green, the stock trends to be sideways. With this information on the trend, it can assist you in coming up with credit spread trade ideas (put credit spread = bullish and call credit spread = bearish). The credit spread trade ideas table on the chart will show case a potential trade idea based on the percentage out of the money you want to place the trade (this is set in your settings).
This indicator has taken me 6 years to build, so I hope you enjoy it :)
Algorithm breakdown
Above the green line: bullish trend
Below the red line: bearish trend
Between the red and green line: sideways market
Above the top yellow line (optional): overbought market
Below the bottom yellow line (optional): oversold market
Understand The Settings
Plot breakout arrows?: shows arrows when the stock crossed one of the major lines
Show standard deviation high and low: shows where the market will top out and bottom out (mathematically)
SMA length: the length of the midline which is a simple moving average indicator
Show credit spreads recommendation: gives you trade ideas based on the stock's trend
Percentage out of the money: how far the recommended trade idea is out of the money
Keep in mind, this indicator may serve as a tool for potential trend identification and generating credit spread trade concepts, but it's essential to conduct your research and exercise due diligence beforehand.

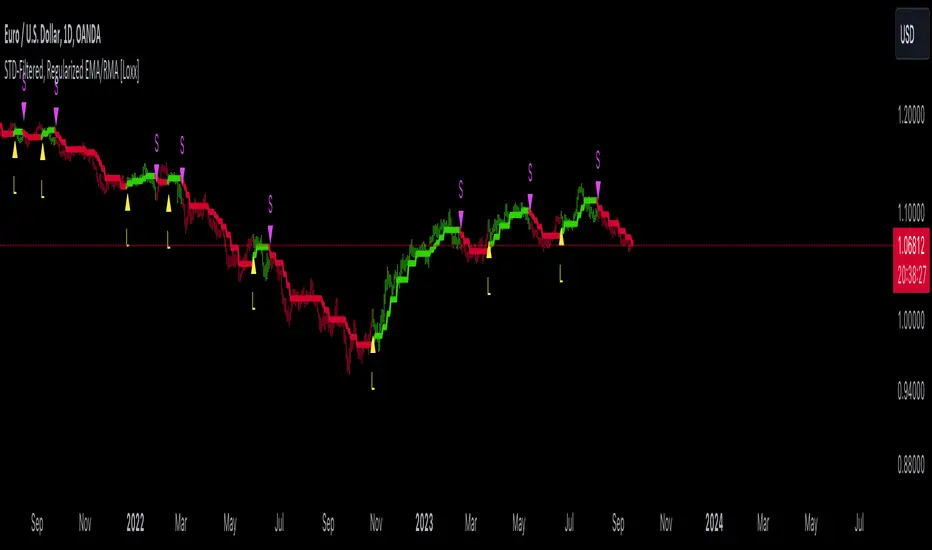
GKD-C STD-Filtered, REMA EMA/RMA [Loxx]The Giga Kaleidoscope GKD-C STD-Filtered, REMA EMA/RMA is a confirmation module included in Loxx's "Giga Kaleidoscope Modularized Trading System."
█ GKD-C STD-Filtered, REMA EMA/RMA
STD-Filtered, Regularized EMA/RMA calculates and visualizes a standard deviation (STD) filtered, regularized version of the Exponential Moving Average (EMA) or Regular Moving Average (RMA) on a trading chart.
Understanding the Regularized Moving Average
The Regularized Moving Average, as conceptualized by Chris Satchwell, offers a more responsive interpretation compared to traditional moving averages. By incorporating a smoothing mechanism using "Lambda", this approach reduces lag without compromising the data's integrity.
In the realm of technical analysis, many regard it as a preferred alternative to the standard Moving Average and Exponential Moving Average.
How Does It Stand Out from Other Moving Averages?
While analysts traditionally shorten an indicator's length or period to minimize lag, the Regularized Moving Average uses a unique approach. By embedding "Regularization" within its computation, this method introduces Lambda (often symbolized as λ-calculus). This mathematical factor tames the moving average's undue fluctuations, offering more stability through its Lambda adjustments.
Pro Tip: For those analyzing smaller intraday timeframes, consider ramping up the Lambda setting to 6.0 or even higher. When tweaking these settings, always remember to backtest and observe how it impacts signal accuracy and noise filtering.
Standard Deviation Filtering:
This filtering mechanism is designed to smoothen price data by eliminating minor fluctuations that might be considered "noise". Here's how the process works:
For every data point, the standard deviation of prices over a specified period is calculated.
This standard deviation is then multiplied by a user-defined value to determine a threshold. This threshold defines the magnitude of change required in the price for it to be considered significant.
For each price, if the absolute difference between its current and previous value is less than this threshold, the price is kept unchanged (considered insignificant and thus filtered). If the difference exceeds the threshold, the price is considered significant and remains as is.
By applying this filter, minor price variations within the threshold are disregarded, resulting in a smoother representation of the price data.
Moving Average Calculation:
The script provides an option to calculate either a regularized Exponential Moving Average (EMA) or a Regular Moving Average (RMA). Here's how these are approached:
If the EMA option is selected: A weighted formula is used where more recent prices have a higher influence on the average than older prices. This is achieved by applying a fraction that's inversely related to the chosen period. The outcome is an average that reacts more quickly to recent price changes.
If the RMA option is selected: The average is computed by giving equal weight to all prices within the chosen period.
Both these averages then undergo a regularization process. Regularization, in this context, refers to adjusting the moving average using a factor to make it potentially more sensitive or responsive to price changes.
This regularized moving average can offer a refined perspective on price trends by being more adaptive to recent changes, potentially highlighting turning points or trend continuations more effectively.
█ Giga Kaleidoscope Modularized Trading System
Core components of an NNFX algorithmic trading strategy
The NNFX algorithm is built on the principles of trend, momentum, and volatility. There are six core components in the NNFX trading algorithm:
1. Volatility - price volatility; e.g., Average True Range, True Range Double, Close-to-Close, etc.
2. Baseline - a moving average to identify price trend
3. Confirmation 1 - a technical indicator used to identify trends
4. Confirmation 2 - a technical indicator used to identify trends
5. Continuation - a technical indicator used to identify trends
6. Volatility/Volume - a technical indicator used to identify volatility/volume breakouts/breakdown
7. Exit - a technical indicator used to determine when a trend is exhausted
8. Metamorphosis - a technical indicator that produces a compound signal from the combination of other GKD indicators*
*(not part of the NNFX algorithm)
What is Volatility in the NNFX trading system?
In the NNFX (No Nonsense Forex) trading system, ATR (Average True Range) is typically used to measure the volatility of an asset. It is used as a part of the system to help determine the appropriate stop loss and take profit levels for a trade. ATR is calculated by taking the average of the true range values over a specified period.
True range is calculated as the maximum of the following values:
-Current high minus the current low
-Absolute value of the current high minus the previous close
-Absolute value of the current low minus the previous close
ATR is a dynamic indicator that changes with changes in volatility. As volatility increases, the value of ATR increases, and as volatility decreases, the value of ATR decreases. By using ATR in NNFX system, traders can adjust their stop loss and take profit levels according to the volatility of the asset being traded. This helps to ensure that the trade is given enough room to move, while also minimizing potential losses.
Other types of volatility include True Range Double (TRD), Close-to-Close, and Garman-Klass
What is a Baseline indicator?
The baseline is essentially a moving average, and is used to determine the overall direction of the market.
The baseline in the NNFX system is used to filter out trades that are not in line with the long-term trend of the market. The baseline is plotted on the chart along with other indicators, such as the Moving Average (MA), the Relative Strength Index (RSI), and the Average True Range (ATR).
Trades are only taken when the price is in the same direction as the baseline. For example, if the baseline is sloping upwards, only long trades are taken, and if the baseline is sloping downwards, only short trades are taken. This approach helps to ensure that trades are in line with the overall trend of the market, and reduces the risk of entering trades that are likely to fail.
By using a baseline in the NNFX system, traders can have a clear reference point for determining the overall trend of the market, and can make more informed trading decisions. The baseline helps to filter out noise and false signals, and ensures that trades are taken in the direction of the long-term trend.
What is a Confirmation indicator?
Confirmation indicators are technical indicators that are used to confirm the signals generated by primary indicators. Primary indicators are the core indicators used in the NNFX system, such as the Average True Range (ATR), the Moving Average (MA), and the Relative Strength Index (RSI).
The purpose of the confirmation indicators is to reduce false signals and improve the accuracy of the trading system. They are designed to confirm the signals generated by the primary indicators by providing additional information about the strength and direction of the trend.
Some examples of confirmation indicators that may be used in the NNFX system include the Bollinger Bands, the MACD (Moving Average Convergence Divergence), and the MACD Oscillator. These indicators can provide information about the volatility, momentum, and trend strength of the market, and can be used to confirm the signals generated by the primary indicators.
In the NNFX system, confirmation indicators are used in combination with primary indicators and other filters to create a trading system that is robust and reliable. By using multiple indicators to confirm trading signals, the system aims to reduce the risk of false signals and improve the overall profitability of the trades.
What is a Continuation indicator?
In the NNFX (No Nonsense Forex) trading system, a continuation indicator is a technical indicator that is used to confirm a current trend and predict that the trend is likely to continue in the same direction. A continuation indicator is typically used in conjunction with other indicators in the system, such as a baseline indicator, to provide a comprehensive trading strategy.
What is a Volatility/Volume indicator?
Volume indicators, such as the On Balance Volume (OBV), the Chaikin Money Flow (CMF), or the Volume Price Trend (VPT), are used to measure the amount of buying and selling activity in a market. They are based on the trading volume of the market, and can provide information about the strength of the trend. In the NNFX system, volume indicators are used to confirm trading signals generated by the Moving Average and the Relative Strength Index. Volatility indicators include Average Direction Index, Waddah Attar, and Volatility Ratio. In the NNFX trading system, volatility is a proxy for volume and vice versa.
By using volume indicators as confirmation tools, the NNFX trading system aims to reduce the risk of false signals and improve the overall profitability of trades. These indicators can provide additional information about the market that is not captured by the primary indicators, and can help traders to make more informed trading decisions. In addition, volume indicators can be used to identify potential changes in market trends and to confirm the strength of price movements.
What is an Exit indicator?
The exit indicator is used in conjunction with other indicators in the system, such as the Moving Average (MA), the Relative Strength Index (RSI), and the Average True Range (ATR), to provide a comprehensive trading strategy.
The exit indicator in the NNFX system can be any technical indicator that is deemed effective at identifying optimal exit points. Examples of exit indicators that are commonly used include the Parabolic SAR, the Average Directional Index (ADX), and the Chandelier Exit.
The purpose of the exit indicator is to identify when a trend is likely to reverse or when the market conditions have changed, signaling the need to exit a trade. By using an exit indicator, traders can manage their risk and prevent significant losses.
In the NNFX system, the exit indicator is used in conjunction with a stop loss and a take profit order to maximize profits and minimize losses. The stop loss order is used to limit the amount of loss that can be incurred if the trade goes against the trader, while the take profit order is used to lock in profits when the trade is moving in the trader's favor.
Overall, the use of an exit indicator in the NNFX trading system is an important component of a comprehensive trading strategy. It allows traders to manage their risk effectively and improve the profitability of their trades by exiting at the right time.
What is an Metamorphosis indicator?
The concept of a metamorphosis indicator involves the integration of two or more GKD indicators to generate a compound signal. This is achieved by evaluating the accuracy of each indicator and selecting the signal from the indicator with the highest accuracy. As an illustration, let's consider a scenario where we calculate the accuracy of 10 indicators and choose the signal from the indicator that demonstrates the highest accuracy.
The resulting output from the metamorphosis indicator can then be utilized in a GKD-BT backtest by occupying a slot that aligns with the purpose of the metamorphosis indicator. The slot can be a GKD-B, GKD-C, or GKD-E slot, depending on the specific requirements and objectives of the indicator. This allows for seamless integration and utilization of the compound signal within the GKD-BT framework.
How does Loxx's GKD (Giga Kaleidoscope Modularized Trading System) implement the NNFX algorithm outlined above?
Loxx's GKD v2.0 system has five types of modules (indicators/strategies). These modules are:
1. GKD-BT - Backtesting module (Volatility, Number 1 in the NNFX algorithm)
2. GKD-B - Baseline module (Baseline and Volatility/Volume, Numbers 1 and 2 in the NNFX algorithm)
3. GKD-C - Confirmation 1/2 and Continuation module (Confirmation 1/2 and Continuation, Numbers 3, 4, and 5 in the NNFX algorithm)
4. GKD-V - Volatility/Volume module (Confirmation 1/2, Number 6 in the NNFX algorithm)
5. GKD-E - Exit module (Exit, Number 7 in the NNFX algorithm)
6. GKD-M - Metamorphosis module (Metamorphosis, Number 8 in the NNFX algorithm, but not part of the NNFX algorithm)
(additional module types will added in future releases)
Each module interacts with every module by passing data to A backtest module wherein the various components of the GKD system are combined to create a trading signal.
That is, the Baseline indicator passes its data to Volatility/Volume. The Volatility/Volume indicator passes its values to the Confirmation 1 indicator. The Confirmation 1 indicator passes its values to the Confirmation 2 indicator. The Confirmation 2 indicator passes its values to the Continuation indicator. The Continuation indicator passes its values to the Exit indicator, and finally, the Exit indicator passes its values to the Backtest strategy.
This chaining of indicators requires that each module conform to Loxx's GKD protocol, therefore allowing for the testing of every possible combination of technical indicators that make up the six components of the NNFX algorithm.
What does the application of the GKD trading system look like?
Example trading system:
Backtest: Multi-Ticker CC Backtest
Baseline: Hull Moving Average
Volatility/Volume: Hurst Exponent
Confirmation 1: Advance Trend Pressure as shown on the chart above
Confirmation 2: uf2018
Continuation: Coppock Curve
Exit: Rex Oscillator
Metamorphosis: Baseline Optimizer
Each GKD indicator is denoted with a module identifier of either: GKD-BT, GKD-B, GKD-C, GKD-V, GKD-M, or GKD-E. This allows traders to understand to which module each indicator belongs and where each indicator fits into the GKD system.
█ Giga Kaleidoscope Modularized Trading System Signals
Standard Entry
1. GKD-C Confirmation gives signal
2. Baseline agrees
3. Price inside Goldie Locks Zone Minimum
4. Price inside Goldie Locks Zone Maximum
5. Confirmation 2 agrees
6. Volatility/Volume agrees
1-Candle Standard Entry
1a. GKD-C Confirmation gives signal
2a. Baseline agrees
3a. Price inside Goldie Locks Zone Minimum
4a. Price inside Goldie Locks Zone Maximum
Next Candle
1b. Price retraced
2b. Baseline agrees
3b. Confirmation 1 agrees
4b. Confirmation 2 agrees
5b. Volatility/Volume agrees
Baseline Entry
1. GKD-B Baseline gives signal
2. Confirmation 1 agrees
3. Price inside Goldie Locks Zone Minimum
4. Price inside Goldie Locks Zone Maximum
5. Confirmation 2 agrees
6. Volatility/Volume agrees
7. Confirmation 1 signal was less than 'Maximum Allowable PSBC Bars Back' prior
1-Candle Baseline Entry
1a. GKD-B Baseline gives signal
2a. Confirmation 1 agrees
3a. Price inside Goldie Locks Zone Minimum
4a. Price inside Goldie Locks Zone Maximum
5a. Confirmation 1 signal was less than 'Maximum Allowable PSBC Bars Back' prior
Next Candle
1b. Price retraced
2b. Baseline agrees
3b. Confirmation 1 agrees
4b. Confirmation 2 agrees
5b. Volatility/Volume agrees
Volatility/Volume Entry
1. GKD-V Volatility/Volume gives signal
2. Confirmation 1 agrees
3. Price inside Goldie Locks Zone Minimum
4. Price inside Goldie Locks Zone Maximum
5. Confirmation 2 agrees
6. Baseline agrees
7. Confirmation 1 signal was less than 7 candles prior
1-Candle Volatility/Volume Entry
1a. GKD-V Volatility/Volume gives signal
2a. Confirmation 1 agrees
3a. Price inside Goldie Locks Zone Minimum
4a. Price inside Goldie Locks Zone Maximum
5a. Confirmation 1 signal was less than 'Maximum Allowable PSVVC Bars Back' prior
Next Candle
1b. Price retraced
2b. Volatility/Volume agrees
3b. Confirmation 1 agrees
4b. Confirmation 2 agrees
5b. Baseline agrees
Confirmation 2 Entry
1. GKD-C Confirmation 2 gives signal
2. Confirmation 1 agrees
3. Price inside Goldie Locks Zone Minimum
4. Price inside Goldie Locks Zone Maximum
5. Volatility/Volume agrees
6. Baseline agrees
7. Confirmation 1 signal was less than 7 candles prior
1-Candle Confirmation 2 Entry
1a. GKD-C Confirmation 2 gives signal
2a. Confirmation 1 agrees
3a. Price inside Goldie Locks Zone Minimum
4a. Price inside Goldie Locks Zone Maximum
5a. Confirmation 1 signal was less than 'Maximum Allowable PSC2C Bars Back' prior
Next Candle
1b. Price retraced
2b. Confirmation 2 agrees
3b. Confirmation 1 agrees
4b. Volatility/Volume agrees
5b. Baseline agrees
PullBack Entry
1a. GKD-B Baseline gives signal
2a. Confirmation 1 agrees
3a. Price is beyond 1.0x Volatility of Baseline
Next Candle
1b. Price inside Goldie Locks Zone Minimum
2b. Price inside Goldie Locks Zone Maximum
3b. Confirmation 1 agrees
4b. Confirmation 2 agrees
5b. Volatility/Volume agrees
Continuation Entry
1. Standard Entry, 1-Candle Standard Entry, Baseline Entry, 1-Candle Baseline Entry, Volatility/Volume Entry, 1-Candle Volatility/Volume Entry, Confirmation 2 Entry, 1-Candle Confirmation 2 Entry, or Pullback entry triggered previously
2. Baseline hasn't crossed since entry signal trigger
4. Confirmation 1 agrees
5. Baseline agrees
6. Confirmation 2 agrees

STD-Filtered, Regularized EMA/RMA [Loxx]STD-Filtered, Regularized EMA/RMA calculates and visualizes a standard deviation (STD) filtered, regularized version of the Exponential Moving Average (EMA) or Regular Moving Average (RMA) on a trading chart.
█ Understanding the Regularized Moving Average
The Regularized Moving Average, as conceptualized by Chris Satchwell, offers a more responsive interpretation compared to traditional moving averages. By incorporating a smoothing mechanism using "Lambda", this approach reduces lag without compromising the data's integrity.
In the realm of technical analysis, many regard it as a preferred alternative to the standard Moving Average and Exponential Moving Average.
█ How Does It Stand Out from Other Moving Averages?
While analysts traditionally shorten an indicator's length or period to minimize lag, the Regularized Moving Average uses a unique approach. By embedding "Regularization" within its computation, this method introduces Lambda (often symbolized as λ-calculus). This mathematical factor tames the moving average's undue fluctuations, offering more stability through its Lambda adjustments.
Pro Tip: For those analyzing smaller intraday timeframes, consider ramping up the Lambda setting to 6.0 or even higher. When tweaking these settings, always remember to backtest and observe how it impacts signal accuracy and noise filtering.
█ Standard Deviation Filtering:
This filtering mechanism is designed to smoothen price data by eliminating minor fluctuations that might be considered "noise". Here's how the process works:
For every data point, the standard deviation of prices over a specified period is calculated.
This standard deviation is then multiplied by a user-defined value to determine a threshold. This threshold defines the magnitude of change required in the price for it to be considered significant.
For each price, if the absolute difference between its current and previous value is less than this threshold, the price is kept unchanged (considered insignificant and thus filtered). If the difference exceeds the threshold, the price is considered significant and remains as is.
By applying this filter, minor price variations within the threshold are disregarded, resulting in a smoother representation of the price data.
█ Moving Average Calculation:
The script provides an option to calculate either a regularized Exponential Moving Average (EMA) or a Regular Moving Average (RMA). Here's how these are approached:
If the EMA option is selected: A weighted formula is used where more recent prices have a higher influence on the average than older prices. This is achieved by applying a fraction that's inversely related to the chosen period. The outcome is an average that reacts more quickly to recent price changes.
If the RMA option is selected: The average is computed by giving equal weight to all prices within the chosen period.
Both these averages then undergo a regularization process. Regularization, in this context, refers to adjusting the moving average using a factor to make it potentially more sensitive or responsive to price changes.
This regularized moving average can offer a refined perspective on price trends by being more adaptive to recent changes, potentially highlighting turning points or trend continuations more effectively.
█ Extras
Signals
Alerts
Bar coloring
Bias of Volume Share inside Std Deviation ChannelThe "Bias of Volume Share inside STD Deviation Channel" indicator is a powerful tool for traders aiming to assess market sentiment within a standard deviation (STD) price channel. This indicator calculates the bullish or bearish bias by analysing the share of volume within the standard deviation channel and provides valuable insights for decision-making.
Usage:
This indicator is a valuable tool for traders seeking to gain in-depth insights into market sentiment within a specified price channel. By focusing on price movements that fall within the standard distribution range and filtering out noise and market manipulations, it provides a clear view of prevailing bullish or bearish biases. Traders can leverage this information to make well-informed trading decisions that align with current market conditions, enhancing their trading strategies and potential for success.
Please ensure you review and adhere to the terms of the Mozilla Public License 2.0, as outlined in the indicator's source code.

Advanced Weighted Residual Arbitrage AnalyzerThe Advanced Weighted Residual Arbitrage Analyzer is a sophisticated tool designed for traders aiming to exploit price deviations between various asset pairs. By examining the differences in normalized price relations and their weighted residuals, this indicator provides insights into potential arbitrage opportunities in the market.
Key Features:
Multiple Relation Analysis: Analyze up to five different asset relations simultaneously, offering a comprehensive view of potential arbitrage setups.
Normalization Functions: Choose from a variety of normalization techniques like SMA, EMA, WMA, and HMA to ensure accurate comparisons between different price series.
Dynamic Weighting: Residuals are weighted based on their correlation, ensuring that stronger correlations have a more pronounced impact on the analysis. Weighting can be adjusted using several functions including square, sigmoid, and logistic.
Regression Flexibility: Incorporate linear, polynomial, or robust regression to calculate residuals, tailoring the analysis to different market conditions.
Customizable Display: Decide which plots to display for clarity and focus, including normalized relations, weighted residuals, and the difference between the screen relation and the average weighted residual.
Usage Guidelines:
Configure the asset pairs you wish to analyze using the Symbol Relations group in the settings.
Adjust the normalization, volatility, regression, and weighting functions based on your preference and the specific characteristics of the asset pairs.
Monitor the weighted residuals for deviations from the mean. Larger deviations suggest stronger arbitrage opportunities.
Use the difference plot (between the screen relation and average weighted residual) as a quick visual cue for potential trade setups. When this plot deviates significantly from zero, it indicates a possible arbitrage opportunity.
Regularly update and adjust the parameters to account for changing market conditions and ensure the most accurate analysis.
In the Advanced Weighted Residual Arbitrage Analyzer , the value set in Alert Threshold plays a crucial role in delineating a normalized band. This band serves as a guide to identify significant deviations and potential trading opportunities.
When we observe the plots of the green line and the purple line, the Alert Threshold provides a boundary for these plots. The following points explain the significance:
Breach of the Band: When either the green or purple line crosses above or below the Alert Threshold , it indicates a significant deviation from the mean. This breach can be interpreted as a potential trading signal, suggesting a possible arbitrage opportunity.
Convergence to the Mean: If the green line converges with the purple line , it denotes that the price relation has reverted to its mean. This convergence typically suggests that the arbitrage opportunity has been exhausted, and the market dynamics are returning to equilibrium.
Trade Execution: A trader can consider entering a trade when the lines breach the Alert Threshold . The return of the green line to align closely with the purple line can be seen as a signal to exit the trade, capitalizing on the reversion to the mean.
By monitoring these plots in conjunction with the Alert Threshold , traders can gain insights into market imbalances and exploit potential arbitrage opportunities. The convergence and divergence of these lines, relative to the normalized band, serve as valuable visual cues for trade initiation and termination.
When you're analyzing relations between two symbols (for instance, BINANCE:SANDUSDT/BINANCE:NEARUSDT ), you're essentially looking at the price relationship between the two underlying assets. This relationship provides insights into potential imbalances between the assets, which arbitrage traders can exploit.
Breach of the Lower Band: If the purple line touches or crosses below the lower Alert Threshold , it indicates that the first symbol (in our example, SANDUSDT ) is undervalued relative to the second symbol ( NEARUSDT ). In practical terms:
Action: You would consider buying the first symbol ( SANDUSDT ) and selling the second symbol ( NEARUSDT ).
Rationale: The expectation is that the price of the first symbol will rise, or the price of the second symbol will fall, or both, thereby converging back to their historical mean relationship.
Breach of the Upper Band: Conversely, if the difference plot touches or crosses above the upper Alert Threshold , it suggests that the first symbol is overvalued compared to the second. This implies:
Action: You'd consider selling the first symbol ( SANDUSDT ) and buying the second symbol ( NEARUSDT ).
Rationale: The anticipation here is that the price of the first symbol will decrease, or the price of the second will increase, or both, bringing the relationship back to its historical average.
Convergence to the Mean: As mentioned earlier, when the green line aligns closely with the purple line, it's an indication that the assets have returned to their typical price relationship. This serves as a signal for traders to consider closing out their positions, locking in the gains from the arbitrage opportunity.
It's important to note that when you're trading based on symbol relations, you're essentially betting on the relative performance of the two assets. This strategy, often referred to as "pairs trading," seeks to capitalize on price imbalances between related financial instruments. By taking opposing positions in the two symbols, traders aim to profit from the eventual reversion of the price difference to the mean.

Opening Range Gap + Std Dev [starclique]The ICT Opening Range Gap is a concept taught by Inner Circle Trader and is discussed in the videos: 'One Trading Setup For Life' and 2023 ICT Mentorship - Opening Range Gap Repricing Macro
ORGs, or Opening Range Gaps, are gaps that form only on the Regular Trading Hours chart.
The Regular Trading Hours gap occurs between 16:15 PM - 9:29 AM EST (UTC-4)
These times are considered overnight trading, so it is useful to filter the PA (price action) formed there.
The RTH option is only available for futures contracts and continuous futures from CME Group.
To change your chart to RTH, first things first, make sure you’re looking at a futures contract for an asset class, then on the bottom right of your chart, you’ll see ETH (by default) - Click on that, and change it to RTH.
Now your charts are filtering the price action that happened overnight.
To draw out your gap, use the Close of the 4:14 PM candle and the open of the 9:30 AM candle.
How is this concept useful?
Well, It can be used in many ways.
---
How To Use The ORG
One of the ways you can use the opening range gap is simply as support and resistance
If we extend out the ORG from the example above, we can see that there is a clean retest of the opening range gap high after breaking structure to the upside and showing acceptance outside of the gap after consolidating within it.
The ORG High (4:14 Candle Close in this case) was used as support.
We then see an expansion to the upside.
Another way to implement the ORG is by using it as a draw on liquidity (magnet for price)
In this example, if we looked to the left, there was a huge ORG to the downside, leaving a massive gap.
The market will want to rebalance that gap during the regular trading hours.
The market rallies higher, rejects, comes down to clear the current days ORG low, then closes.
That is one example of how you can combine liquidity & ICT market structure concepts with Opening Range Gaps to create a story in the charts.
Now let’s discuss standard deviations.
---
Standard Deviations
Standard Deviations are essentially projection levels for ranges / POIs (Point of Interests)
By this I mean, if you have a range, and you would like to see where it could potentially expand to, you’d place your fibonacci retracement tool on and high and low of the range, then use extension levels to find specific price points where price might reject from.
Since 0 and 1 are your Range High and Low respectively, your projection levels would be something like 1.5, 2, 2.5, and 3, for the extension from your 1 Fib Level, and -0.5, -1, -1.5, and -2 for your 0 Fib level.
The -1 and 2 level produce a 1:1 projection of your range low and high, meaning, if you expect price to expand as much as it did from the range low to range high, then you can project a -1 and 2 on your Fib, and it would show you what ICT calls “symmetrical price”
Now, how are standard deviations relevant here?
Well, if you’ve been paying attention to ICT’s recent videos, you would’ve caught that he’s recently started using Standard Deviation levels on breakers.
So my brain got going while watching his video on ORGs, and I decided to place the fib on the ORG high and low and see what it’d produce.
The results were very interesting.
Using this same example, if we place our fib on the ORG High and Low, and add some projection levels, we can see that we rejected right at the -2 Standard Deviation Level.
---
You can see that I also marked out the EQ (Equilibrium, 50%, 0.5 of Fib) of the ORG. This is because we can use this level as a take profit level if we’re using an old ORG as our draw.
In days like these, where the gap formed was within a consolidation, and it continued to consolidate within the ORG zone that we extended, we can use the EQ in the same way we’d use an EQ for a range.
If it’s showing acceptance above the EQ, we are bullish, and expect the high of the ORG to be tapped, and vice versa.
---
Using The Indicator
Here’s where our indicator comes in play.
To avoid having to do all this work of zooming in and marking out the close and open of the respective ORG candles, we created the Opening Range Gap + Standard Deviations Indicator, with the help of our dedicated Star Clique coder, a1tmaniac.
With the ORG + STD DEV indicator, you will be able to view ORG’s and their projections on the ETH (Electronic Trading Hours) chart.
---
Features
Range Box
- Change the color of your Opening Range Gap to your liking
- Enable or disable the box from appearing using the checkbox
Range Midline
- Change the color of your Opening Range Gap Equilibrium
- Enable or disable the midline from appearing using the checkbox
Std. Dev
- Add whichever standard deviation levels you’d like.
- By default, the indicator comes with 0.5, 1, 1.5, and 2 standard deviation levels.
- Ensure that you add a comma ( , ) in between each standard deviation level
- Enable or disable the standard deviations from appearing using the opacity of the color (change to 0%)
Labels / Offset
- Adjust the offset of the label for the Standard Deviations
- Enable or disable the Labels from appearing using the checkbox
Time
- Adjust the time used for the indicators range
- If you’d like to use this for a Session or ICT Killzone instead, adjust the time
- Adjust the timezone used for the time referenced
- Options are UTC, US (UTC-4, New York Local Time) or UK (UTC+1, London Time)
- By default, the indicator is set to US

Excalibur Trading System [Dare]✦ INTRODUCTION
The core goal in the Excalibur Trading System is attaining an optimal entry - fading the masses, selling others' buys, buying others' sells, and trading along true tops and bottoms where price manipulation commonly occurs. Executions are most successful intraday and when aligned with HTF price action while still maintaining a systematic approach in analysis and risk management. Use of this tool is not recommended for the uninitiated trader; it takes intense focus, dedicated practice, and unwavering confidence to wield this successfully. Please go through the guide I’ve provided which contains comprehensive coverage of all the elements below which, in the context of this post, are meant to depict a general idea of what the indicator is meant to accomplish.
✦ INDICATOR DETAILS
System Overview
System Components
Indicator Settings
Plotting Interpretation
Postscript
✦ SYSTEM OVERVIEW
Type of System
This is a mechanical system which requires zero discretion. While trading with an objective approach offers several advantages, it's important to note that it is not foolproof. Market conditions can change, and indicators can provide false signals. The accuracy is not 100% and even following it perfectly, as with any strategy, one will incur losses.
Objective Decision-making - No emotional bias, no fear.
Consistent - A repeatable approach that eliminates impulsivity.
Easily tested - Strategy performance can be measured universally no matter who is using it, in both forward and backtesting.
No Guesswork - Provides specific entry and exit signals with a systematic procedure.
Predefined Rules - Controls risk and enforces discipline.
Simple and Clear - Reduces complexity and confusion.
Performance in Various Market Conditions
Excalibur is meant to catch reversals and second-stage continuations, but trending days should be avoided. It has been tested and used in live market conditions in Index Futures, during the regular NY Session, on the 1m Timeframe, targeting ≥2.5RR Ratio. Outcomes will vary by trader due to factors such as risk tolerance, entry opportunities taken, human error and psychological barriers. Historical performance is not a guarantee of future results.
✦ SYSTEM COMPONENTS
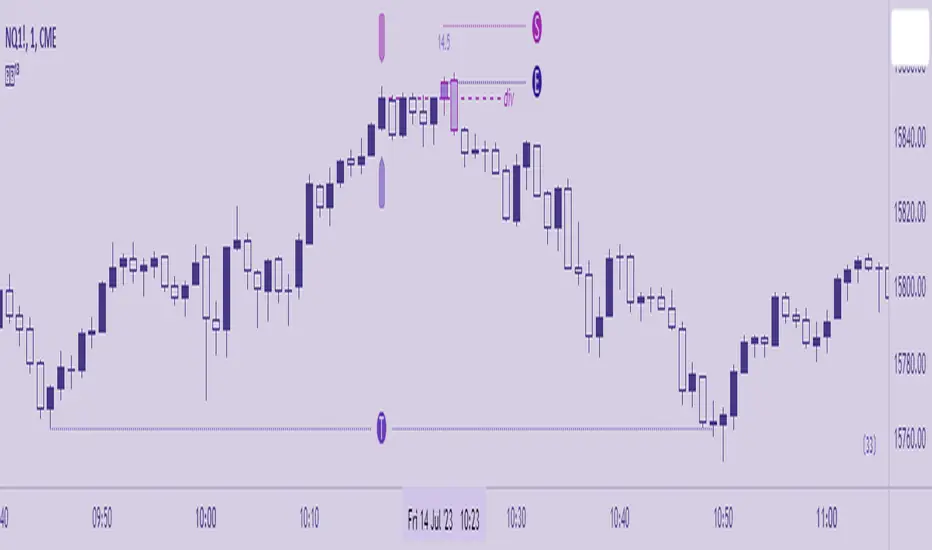
Setup Schematic
The premise for all setups is the same. We are identifying manipulation above a previous high (bearish) or below a previous low (bullish) in anticipation of a reversal. This indicator is meant to be used as a measuring tool to quantify that manipulation taking place using Hi's and Lo's as identified by the Bar , which is based on a standard deviation calculation. The Fu tag is meant to be used to find Divergence at custom pivots, not predetermined lookback periods - this is similar to SMT - Smart Money Technique, but this Divergence references bodies vs. wicks and the execution of the trade is at the extreme pivot vs. the weak pivot.
Using the Bar as a guide, the trader will set the Hi/Lo tags and the indicator will automatically calculate the Threshold, the point beyond which one’s Entry resides when Divergence is also present. A valid entry plots as a Polaris star below (bullish) and above (bearish) the current bar in their respective scenarios.
Bullish Setup
(1) Place the Lo tag at the current threshold as signified by the Bar.
(2) Search for Divergence with price action below that threshold by using the Fu tag at extreme bodies of recent swing lows.
(3) Wait for a bullish Entry to plot, confirmed at candle close.
Bearish Setup
(1) Place the Hi tag at the current threshold as signified by the Bar.
(2) Search for Divergence with price action above that threshold by using the Fu tag at extreme bodies of recent swing highs.
(3) Wait for a bearish Entry to plot, confirmed at candle close.
The indicator collects the OHLC values of the target asset candles based on the trader’s Hi/Lo placement, compares them to up to two assets, and plots an entry depending on the context of the setup. The entry method, like the setup composition, is based on minute Divergences in price between the assets and other criteria related to how the candles close relative to each other.
✦ INDICATOR SETTINGS
Options
This line controls the colors of the Polaris (✦) and the squares in the Manipulation Bar. Manipulation can be measured using either mathematical calculation (ᴀʟᴘʜᴀ) or OHLC data-points (ʙᴇᴛᴀ). The Polaris denotes a time and price of possible reversal at an extreme low or high - deselect this line to hide it.
⋆ This line controls colors of the Tags and Candles - Bullish, Bearish, and All. To customize, switch to ᴄᴜsᴛᴏᴍ. If the Divergence Candles are not consistently visible, change the Visual Order to Front on the chart by selecting the indicator Title then More. To hide, deselect this line.'
The third and fourth lines controls the visibility of the Manipulation Bar, Matrix Tags, Advisor Arrows and Invalidation Labels.
Time
By default, the times for Hi, Lo and Fu are set to 09:00, 09:30 and 09:15 respectively. The date will need to be manually adjusted at the beginning of each trading day.
Price
By default, the charted Asset is assumed to be ES1! (E-Mini S&P 500 Continuous Contract) . If the trader would like to chart a different Asset, be sure to adjust Assets I and II to valid comparisons so that the indicator can accurately detect price divergences.
Risk
Input the account size and percentage one intends to risk. To pyramid, indicate the quantity the position to be divided into. In MT4 or 5, right-click a symbol then Specification. The Contract Size field contains the Units per Lot. Use the various options to customize the table format and visibility.
The tooltips (i) will be available in the UI in case the trader will ever need to refer to them for the information above.
✦ PLOTTING INTERPRETATION
Matrix Tags
Guided by the manipulation bar, the trader will use Hi and Lo tags to measure the manipulation threshold. The Fu tag measures either bullish or bearish divergences depending on the placement of the Hi/Lo tags.
Manipulation Bar
The squares plotted together form a bar and indicate whether a candle is or isn’t plotting a new manipulation threshold (creating a new Hi or Lo ). The trader should always use the current Hi or Lo .
Advisor Arrows
The arrows are meant to signify a possible valid entry in the temporary period of time between the candle open and close. They give advance notice that the trader should be looking for divergences using the Fu tag to attain a confirmed entry (Polaris) on that particular candle as it is forming.
Entry Signal
The Polaris denotes a time and price of trade execution. As long as the Matrix tags are placed correctly, this is a valid signal to place a position in the direction indicated. Entry price is at the candle close, regardless of the next candle’s open price.
Risk Labels and Table
This is an automatic calculation for Stop placement based on average true range (valid only for indices with a 0.25pt tick value. A future version may allow for customization of this feature for assets not based on ticks, like forex pairs). The table (by default at the bottom right) will display the trader's position size based on the inputs.
Divergence Candles
Using the Fu tag, the trader can select swing highs and lows to determine if divergence is occurring above and below them, respectively. Divergence is maintained as long as the colored candles are printed consecutively. Referring to the charts of Assets I and II in a separate layout window is recommended but not required.
✦ POSTSCRIPT
I forged this sword, Excalibur, in pursuit of my highest aspiration - to create a legacy and provide a gift to my friends, family, and all those burdened by obligations that limit them from living what they would consider to be a fulfilling life. Those free to pursue the ambitions they truly value are the ones who change their communities and even the world for the better.
~Dare.
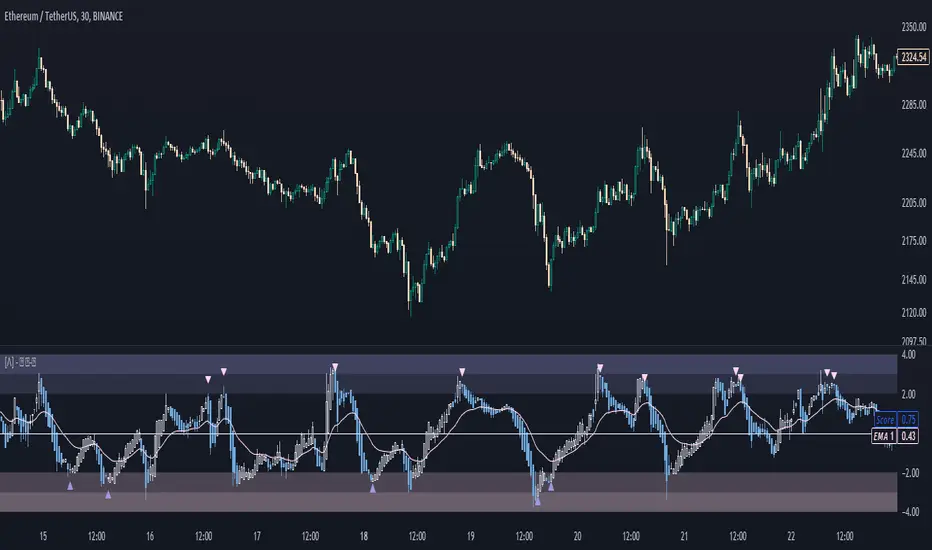
Z-Score Heikin-Ashi TransformedThe Z-Score Heikin-Ashi Transformed (𝘡 𝘏-𝘈) indicator is a powerful technical tool that combines the principles of Z-Score and Heikin Ashi to provide traders with a smoothed representation of price movements and a standardized measure of market volatility.
The 𝘡 𝘏-𝘈 indicator applies the Z-Score calculation to price data and then transforms the resulting Z-Scores using the Heikin Ashi technique. Understanding the individual components of Z-Score and Heikin Ashi will provide a foundation for comprehending the methodology and unique features of this indicator.
Z-Score:
Z-Score is a statistical measure that quantifies the distance between a data point and the mean, relative to the standard deviation. It provides a standardized value that allows traders to compare different data points on a common scale. In the context of the 𝘡 𝘏-𝘈 indicator, Z-Score is calculated based on price data, enabling the identification of extreme price movements and the assessment of their significance.
Heikin Ashi:
Heikin Ashi is a popular charting technique that aims to filter out market noise and provide a smoother representation of price trends. It involves calculating each candlestick based on the average of the previous candle's open, close, high, and low prices. This approach results in a chart that reduces the impact of short-term price fluctuations and reveals the underlying trend more clearly.
Methodology:
The 𝘡 𝘏-𝘈 indicator starts by calculating the Z-Score of the price data, which provides a standardized measure of how far each price point deviates from the mean. Next, the resulting Z-Scores are transformed using the Heikin Ashi technique. Each Z-Score value is modified according to the Heikin Ashi formula, which incorporates the average of the previous Heikin Ashi candle's open and close prices. This transformation smooths out the Z-Score values and reduces the impact of short-term price fluctuations, providing a clearer view of market trends.
This tool enables traders to identify significant price movements and assess their relative strength compared to historical data. Positive transformed Z-Scores indicate that prices are above the average, suggesting potential overbought conditions, while negative transformed Z-Scores indicate prices below the average, suggesting potential oversold conditions. Traders can utilize this information to identify potential reversals, confirm trend strength, and generate trading signals.
Utility:
The indicator offers valuable insights into price volatility and trend analysis. By combining the standardized measure of Z-Score with the smoothing effect of Heikin Ashi, traders can make more informed trading decisions and improve their understanding of market dynamics. 𝘡 𝘏-𝘈 can be used in various trading strategies, including identifying overbought or oversold conditions, confirming trend reversals, and establishing entry and exit points.
Note that the 𝘡 𝘏-𝘈 should be used in conjunction with other technical indicators and analysis tools to validate signals and avoid false positives. Additionally, traders are encouraged to conduct thorough backtesting and experimentation with different parameter settings to optimize the effectiveness of the indicator for their specific trading approach.
Key Features:
Optional Reversion Doritos
Adjustable Reversion Threshold
2 Adjustable EMAs
Example Charts:
See Also:
On Balance Volume Heikin-Ashi Transformed
Regularized-Moving-Average Oscillator SuiteThe Regularized-MA Oscillator Suite is a versatile indicator that transforms any moving average into an oscillator. It comprises up to 13 different moving average types, including KAMA, T3, and ALMA. This indicator serves as a valuable tool for both trend following and mean reversion strategies, providing traders and investors with enhanced insights into market dynamics.
Methodology:
The Regularized MA Oscillator Suite calculates the moving average (MA) based on user-defined parameters such as length, moving average type, and custom smoothing factors. It then derives the mean and standard deviation of the MA using a normalized period. Finally, it computes the Z-Score by subtracting the mean from the MA and dividing it by the standard deviation.
KAMA (Kaufman's Adaptive Moving Average):
KAMA is a unique moving average type that dynamically adjusts its smoothing period based on market volatility. It adapts to changing market conditions, providing a smoother response during periods of low volatility and a quicker response during periods of high volatility. This allows traders to capture trends effectively while reducing noise.
T3 (Tillson's Exponential Moving Average):
T3 is an exponential moving average that incorporates additional smoothing techniques to reduce lag and provide a more responsive indicator. It aims to maintain a balance between responsiveness and smoothness, allowing traders to identify trend reversals with greater accuracy.
ALMA (Arnaud Legoux Moving Average):
ALMA is a moving average type that utilizes a combination of linear regression and exponential moving average techniques. It offers a unique way of calculating the moving average by providing a smoother and more accurate representation of price trends. ALMA reduces lag and noise, enabling traders to identify trend changes and potential entry or exit points more effectively.
Z-Score:
The Z-Score calculation in the Regularized-MA Oscillator Suite standardizes the values of the moving average. It measures the deviation of each data point from the mean in terms of standard deviations. By normalizing the moving average through the Z-Score, the indicator enables traders to assess the relative position of price in relation to its mean and volatility. This information can be valuable for identifying overbought and oversold conditions, as well as potential trend reversals.
Utility:
The Regularized-MA Oscillator Suite with its unique moving average types and Z-Score calculation offers traders and investors powerful analytical tools. It can be used for trend following strategies by analyzing the oscillator's position relative to the midline. Traders can also employ it as a mean reversion tool by identifying peak values above user-defined deviations. These features assist in identifying potential entry and exit points, enhancing trading decisions and market analysis.
Key Features:
Variety of 13 MA types.
Potential reversal point bubbles.
Bar coloring methods - Trend (Midline cross), Extremities, Reversions, Slope
Example Charts:

Anchored Three Sigma RangeThis indicator serves to display the standard deviation model based on open price from the selected anchored timeframe. Per statistics the price may stay within the three sigma range most of the time, most significantly within first sigma range 68% of the time.
If price breaks the statistical probabilities and out of the three sigma range entirely it could be considered anomalous and perhaps useful for trade planning, use the fib extensions in various ways to have dynamic profit targets, support or resistance.
How is this different
This indicator differs from others in that I've not really seen any others generating solely horizontal levels, anchored from open price and including fib extensions.
How to use
To use this indicator add to the chart, select anchor timeframe, fib display mode and adjust style to liking. Depending on trade plans use the range breaks, consolidations or fib extensions as required.
One could utilize range consolidation for advanced options neutral trades, range breaks for scalping directionally or high fib extensions for rejection based trades. Based on timeframe anchorage there could be some really amazing combinations for any style of trading, comment any unique findings!
What markets
This indicator can be used on anything that has a price :D
Conditions
Any condition is applicable.

Standard Deviation Buy Sell Signals [UOI]The "Standard Deviation Buy Sell Signals" which is a Mean and VWAP Deviation Super Pack that includes many additional features is an advanced technical analysis tool designed to assist traders in making well-informed decisions in the financial markets. It incorporates various functions and calculations to provide a comprehensive analysis of price movements, trends, and potential trading opportunities in different timeframes. The Super Pack combines elements of volume-weighted average price (VWAP), mean calculation on multiple time frames, standard deviation signals and bands, overbought and oversold signals, measures of central tendency, and multiple time frame calculations of mean reversion. A truly unique indicator.
Here is the details of the supper pack and what is included:
1. VWAP (Volume-Weighted Average Price): The Mean and VWAP Deviation Super Pack includes VWAP, which calculates the average price of a security weighted by its trading volume. This helps traders identify the average price at which a significant amount of trading activity has occurred and can serve as a reference point for determining whether the current price is overvalued or undervalued.
2. Standard Deviation Signals and Bands: The Super Pack incorporates standard deviation signals and bands to measure the volatility of price movements. By calculating the standard deviation of price data, it identifies price levels that deviate significantly from the average, indicating potential overbought or oversold conditions. The standard deviation bands provide visual boundaries that help traders assess the likelihood of a price reversal or continuation. The bands are hidden to avoid too many lines but you can enable them in the setting. See image below:
3. Overbought and Oversold Signals: Using the standard deviation calculations, the Mean and VWAP Deviation Super Pack generates overbought and oversold signals. These signals indicate when a security's price has moved to an extreme level, suggesting a potential reversal or correction in the near future. Traders can use these signals to time their entries or exits in the market. You can change the RSI number in the setting to get more or less signals.
4. Measures of Central Tendency: The Super Pack incorporates measures of central tendency, such as the mean, median, or mode, to provide a sense of the average or typical price behavior. These measures help traders identify the prevailing trend or price direction and assess the likelihood of a trend continuation or reversal. This provide reassurance of whether price is too far from center in multiple time frames.
5. Multiple Time Frame Calculation of Mean Reversion: The Mean and VWAP Deviation Super Pack employs multiple time frame calculations to identify mean reversion opportunities. It compares the current price with the historical average price over different time periods, allowing traders to identify situations where the price has deviated significantly from its mean and is likely to revert back to its average value. This can be useful for swing trading or short-term trading strategies.
By combining these various functions, the Mean and VWAP Deviation Super Pack provides traders with a comprehensive analysis of price dynamics, trend strength, potential reversals, and mean reversion opportunities. It aids in making more informed trading decisions and improving overall trading performance.
Why is this super pack indicator an essential trading strategy for every trader:
Standard deviation and mean reversion are valuable tools for traders, especially when the market is in a ranging phase. A ranging market is characterized by price movements that oscillate between defined support and resistance levels, with no clear trend in either direction. In such market conditions, standard deviation and mean reversion strategies can be particularly effective. Here's why:
1. Standard Deviation: Standard deviation is a statistical measure that quantifies the volatility or dispersion of price data around its average. In a ranging market, where prices tend to fluctuate within a certain range, standard deviation can help identify overbought and oversold levels. When the price reaches the upper end of the range, the standard deviation bands widen, indicating higher volatility and a potential selling opportunity. Conversely, when the price reaches the lower end of the range, the bands narrow, suggesting lower volatility and a potential buying opportunity. Traders can use these signals to anticipate price reversals and take advantage of the predictable nature of ranging markets.
2. Mean Reversion: Mean reversion is a concept that suggests prices tend to move back toward their average or mean over time. In a ranging market, where prices repeatedly move between support and resistance levels, mean reversion strategies can be highly effective. By identifying when the price has deviated significantly from its mean, traders can anticipate a potential reversal back toward the average. When the price reaches extreme levels, indicating overbought or oversold conditions, traders can enter positions in the opposite direction, expecting the price to revert to its mean. Mean reversion strategies can be implemented using various indicators, including Bollinger Bands, moving averages, or standard deviation bands.
3. Range Boundaries: In a ranging market, the upper and lower boundaries of the price range serve as reliable reference points for traders. Standard deviation and mean reversion strategies capitalize on the repetitive nature of price movements within these boundaries. Traders can set their entry and exit points based on the standard deviation bands or mean reversion signals to take advantage of price reversals near the range boundaries. By properly identifying and reacting to these levels, traders can profit from the price oscillations within the range.
4. Risk Management: Standard deviation and mean reversion strategies provide traders with clear entry and exit points, allowing for effective risk management. By placing stop-loss orders beyond the range boundaries or the standard deviation bands, traders can limit their potential losses if the price continues to move against their positions. Additionally, by taking profits near the opposite range boundary or when the price reverts back to the mean, traders can secure their gains and maintain a disciplined approach to trading.
Standard deviation and mean reversion strategies offer traders a systematic approach to capitalize on ranging markets. But the cherry on top is the overbought and oversold signals:
The concept of overbought and oversold levels is widely used in technical analysis to identify potential reversals in price trends. Typically, indicators like the Relative Strength Index (RSI) are employed to determine when an asset may be overbought or oversold. However, you have developed a unique approach by incorporating an interactive variable with RSI and Average True Range (ATR) to create a distinct overbought and oversold signal. Here's why this approach stands out:
1. Divergence: Your approach introduces a divergence concept by combining RSI and ATR. Traditionally, overbought and oversold signals rely solely on RSI readings. However, by considering the interaction between RSI and ATR, you bring a new dimension to these signals. The divergence occurs when the RSI indicates overbought conditions while simultaneously ATR crosses over into bearish territory, or when the RSI signals oversold conditions along with ATR crossing over into bullish territory. This divergence adds an extra layer of confirmation to the overbought and oversold signals.
2. Reduced False Signals: The incorporation of ATR in conjunction with RSI helps filter out false signals that may occur during trending market conditions or short squeezes. Trend days or periods of increased volatility can cause RSI to remain in overbought or oversold territory for an extended period, generating numerous signals that may not be reliable. By considering the crossing of ATR into bearish or bullish territory, your approach adds a dynamic element to the signal generation process. This interactive variable helps ensure that the overbought and oversold signals are not solely based on RSI getting hot, reducing the likelihood of false signals during trending or volatile periods.
3. Improved Timing: The interaction between RSI and ATR provides a more nuanced approach to timing overbought and oversold signals. By waiting for the ATR to confirm the RSI signal, you introduce an additional condition that enhances the precision of the timing. The bearish or bullish crossover of ATR serves as a confirmation that market conditions align with the overbought or oversold signal indicated by RSI. This combined approach allows for more accurate entry or exit points, increasing the potential profitability of trades.
4. Customization and Adaptability: By creating this interactive variable with RSI and ATR, you have developed a customizable approach that can be adapted to different trading styles and preferences. Traders can adjust the sensitivity of the signals by modifying the parameters of the RSI and ATR. This flexibility allows for a personalized trading experience and enables traders to align the signals with their specific risk tolerance and market conditions.
This approach to overbought and oversold signals utilizing RSI and ATR introduces a unique perspective to technical analysis. By incorporating divergence and interactive variables, you enhance the reliability of these signals while reducing false readings. This approach provides improved timing and adaptability, making it a valuable tool for traders seeking to identify potential reversals in price trends with greater accuracy and confidence.
HOW to avoid fake signals?
When it comes to trading with standard deviation as a strategy, it's important to note that on extreme trend days, this indicator may generate false signals. This occurs because standard deviation is primarily designed to measure volatility and deviations from the mean in a range-bound market. During strong trending periods, the price tends to move in one direction with minimal deviations, rendering the standard deviation less effective.
To avoid trading based solely on standard deviation during extreme trend days, it is advisable to incorporate additional indicators that can provide insights into the stock's trend or squeeze conditions. These indicators can help determine whether the market is experiencing a strong trend or a squeeze, allowing you to avoid false signals generated by standard deviation.
By utilizing complementary indicators such as trend-following indicators (e.g., moving averages, trendlines) or volatility indicators (e.g., Bollinger Bands), you can gain a more comprehensive understanding of the market environment. These indicators can help confirm whether the stock is in a trending phase or experiencing a squeeze, helping you avoid entering trades solely based on standard deviation during these extreme trend days.
In summary, while standard deviation is a valuable tool in range-bound markets, it may produce unreliable signals on extreme trend days. By incorporating other indicators that provide insights into the stock's trend or squeeze conditions, traders can better assess the market environment and avoid false signals generated by standard deviation during these periods. This approach enhances the overall effectiveness and accuracy of trading strategies, leading to more informed and profitable decision-making.
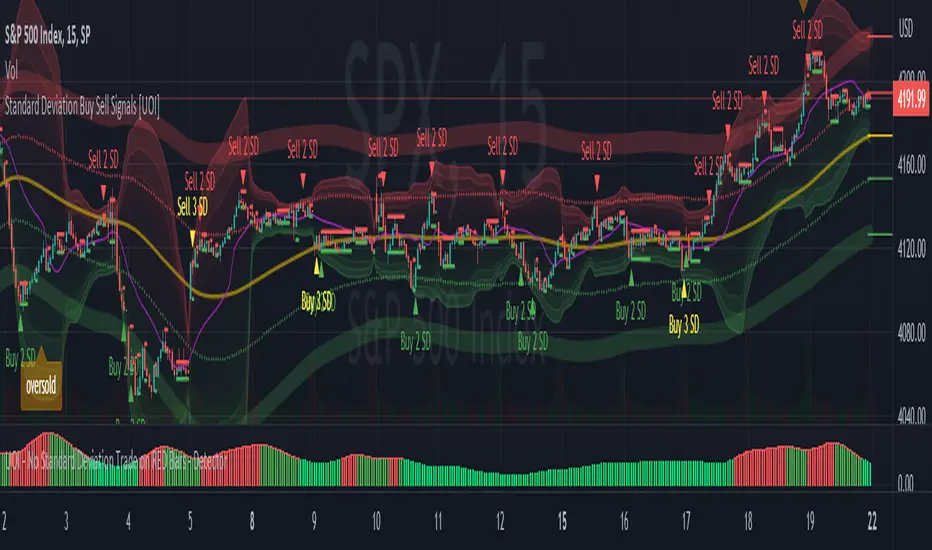
Master Supertrend [Trendoscope]Are you a fan of supertrend? Me too!! Here is a supertrend indicator which provides multiple variation options to chose from.
🎲 Introduction
Supertrend is a popular technical indicator used by traders to identify potential trend reversals and determine entry and exit points in financial markets. It is a trend-following indicator that combines price and volatility to generate its signals. Generally supertrend is calculated based on ATR and multiplier value which is used for calculation of stops. In these adaptions, we look to provide few variations to classical methods.
🎲 Variations
Following variations are provided in the form of settings.
🎯 Range Type
Instead of ATR, different types of ranges can be used for stop calculation. Here is the complete list used in the script.
Plus/Minus Range - Calculates plus range and minus range for each candle and uses them for different sides of stop calculation
Ladder ATR - Based on the existing concept of Ladder ATR defined in Supertrend-Ladder-ATR
True Range - True range derived from standard function ta.tr
Standard Deviation - Standard deviation of close prices
🎯 Applied Calculation
In standard ATR, rma of TR is used for calculations. But, the application calculation provides option to users to use different mechanisms. It can be a type of moving average or few other types of calculations.
Available values are
sma
ema
hma
rma
wma
high
median
medianHigh (Highest of the last N medians)
medianLow (Lowest of the last N medians)
🎯 Other options
Few other options provided are
Use Close Price - If selected stops are calculated based on the close price instead of high/low prices
Wait for Close If selected, change of supertrend direction is calculated based on close price instead of high/low prices
Diminishing Stop Distance - When selected, stop distance for the trend direction can only reduce and cannot increase. This option is useful for keeping the tight stops on strong trends.
🎯 Plus Minus Range
One of the range type used is Plus/Minus Range. What it means and how are these ranges calculated? Let's have a look.
Plus Range is an upward movement of a candle from its last price or open price whichever is lower.
Minus Range is a downward movement of a candle from its last price or open price whichever is higher.
This divides True Range into two separate range for positive and negative side.
Here are the simple settings in nutshell which reflects the same.
L&S Volatility IndexOverview
L&S Volatility Index is a tool designed to helps traders identify overpriced or underpriced moments in the market and adjust their trading strategies accordingly.
Calculations
This tool calculates how far the price is from the 21-period simple moving average as a ratio of the average historical volatility calculated over the last 21 candles.
How It Works
A L&S Volatility Index with a value greater than 30% may indicate that the asset is overpriced or underpriced relative to its average price.
How To Use
If the L&S Volatility Index > 30, the asset is overpriced or underpriced. This means that there is a good probability of initiating a mean reversion.
If the L&S Volatility Index < 30, the asset is in a fair price region. This means that it is acceptable to buy or sell in that price region.
Where To Use
Mean Reversion Strategy
Breakout Strategy
What Makes it Original
There is already an indicator that use a normalized calculation and a different approach to calculate historical volatility, whereas this script calculation is non-normalized and historical volatility is calculated using Don Fishback's formula. All calculations are used as originally described.
Credits
The L&S Volatility Index indicator was originally written by L&S Educação Financeira.
Historical Volatility calculation is based on the book "Odds: The Key to 90% Winners" written by Don Fishback.

Intraday Mean Reversion Money Performance indicatorThe diagram shows Money Performance when buying stocks for 10 000 at every buy signal from the Intraday Mean Reversion indicator.
The indicator is best used in combination with Intraday Mean Reversion Main Indicator
The rules for trading are: Buy on Open price if the Intraday Mean Reversion Main indicator gives a buy signal. Sell on the daily close price.
According to my knowledge it is not possible to create a PineScript strategy based on these rules, because the indicator is used on Day to Day graph. Therefore this indicator can be used to analyze Money performance of this strategy.
The lines show the performance of the Intraday Mean Reversion Strategy, based on the different levels in the strategy (from 0.5 Standard deviation to 1.1 standard deviation)
Using this indicator it is possible to find stocks that often reverse towards mean after open.
Use this strategy on stocks with high positive performance. Do not use on stocks with negative performance.