Simple and Exponential MAAllow moving averages to be displayed without needing to use up multiple charting indicators individually (20, 50, 100, 200, 300 lengths for both EMA and SMA)
Sma
Moving Averages
Set up to 3 SMA and 3 EMA. Thus, a total of 6 moving averages if you really like. This is a great means by which to easily identify which moving average setup is constantly being tested.
Change the lengths of each moving average.
Change styling of each moving average.
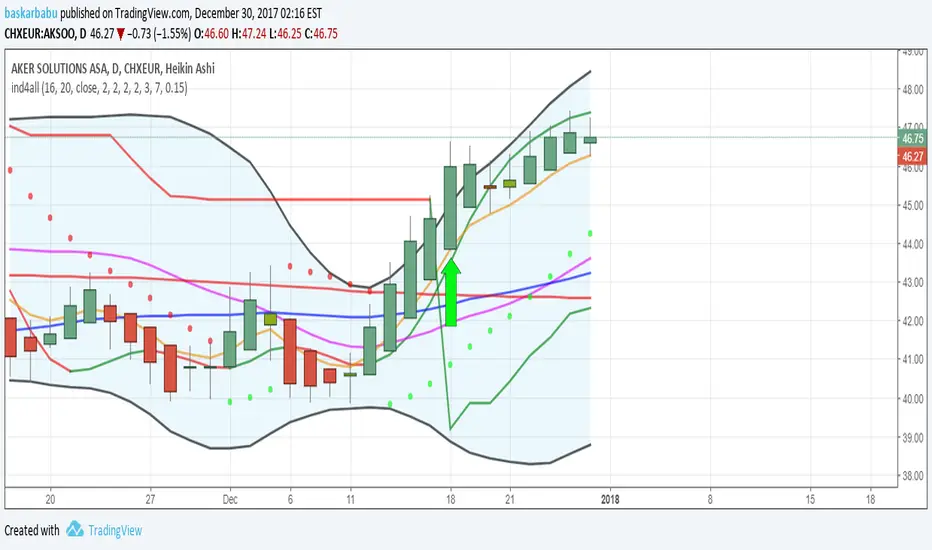
CMYK RMI◊ Introduction
I started using this script because of its fast reaction, and good tell for buy/sell moments on a short timescale.
For larger timescales, the overall trend should be taken into account regarding the levels.
In the future i will update this indicator, to automatically adjust those.
◊ Origin
The Relative Momentum Index was developed by Roger Altman and was introduced in his article in the February, 1993 issue of Technical Analysis of Stocks & Commodities magazine.
While RSI counts up and down days from close to close, the Relative Momentum Index counts up and down days from the close relative to a close x number of days ago.
This results in an RSI that is smoother.
◊ Adjustments
CMYK color theme applied.
Four levels to indicate intensity.
Two Timescales, to overview the broader trend, and fast movements.
◊ Usage
RMI indicates overbought and oversold zones, and can be used for divergence and trend analysis.
◊ Future Prospects
Self adjusting levels, relative to an SMA trend.
Alternative RMI, which functions as an overlay.
◊ ◊ ◊ ◊ ◊ ◊ ◊ ◊ ◊ ◊ ◊ ◊ ◊ ◊ ◊ ◊ ◊ ◊ ◊ ◊ ◊ ◊ ◊ ◊ ◊ ◊ ◊ ◊ ◊ ◊ ◊ ◊ ◊ ◊ ◊ ◊ ◊ ◊ ◊ ◊ ◊ ◊ ◊ ◊ ◊ ◊ ◊ ◊ ◊ ◊ ◊ ◊ ◊ ◊ ◊ ◊ ◊ ◊ ◊ ◊ ◊ ◊ ◊ ◊ ◊ ◊ ◊ ◊ ◊ ◊ ◊ ◊ ◊ ◊ ◊ ◊ ◊ ◊ ◊ ◊ ◊ ◊ ◊ ◊ ◊ ◊ ◊ ◊ ◊ ◊ ◊ ◊ ◊ ◊ ◊ ◊ ◊ ◊ ◊ ◊ ◊ ◊ ◊ ◊ ◊ ◊


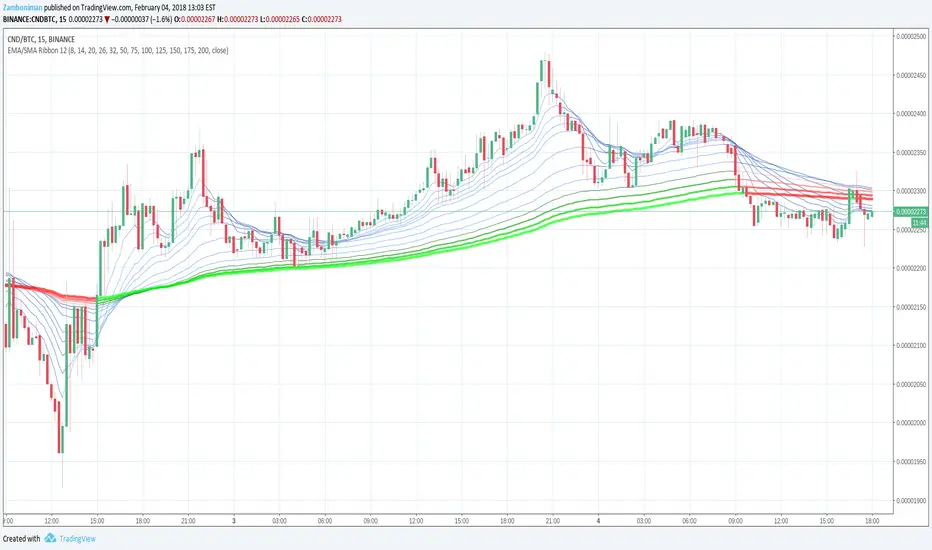
Exponential/Simple Moving Average Ribbon 12Due to popular demand (one person asked) this is an updated version of my EMA 12 indicator.
This indicator will show up to twelve moving averages at a time in a single indicator. Or, to put it another way, a moving average ribbon.
You can turn individual MAs off or on at your discretion, to show from none to twelve at a time, to better visualize support and resistance areas off of MAs as well as MA crossings.
You can also, of course, adjust the length/period of each of the MAs at your discretion.
In this version, most significantly, you can select either exponential moving average or simple moving average as well for each individual MA.
For the last four MA lines, the color will change from red when bearish to green when bullish. There is also a much more subtle color change in the other MA lines as well.
TEMA - Triple Moving Averages (50,100,200)Three Moving Averages in a single indicator, very useful if you are a free user and want to save some indicator slots.
Enjoy it :)


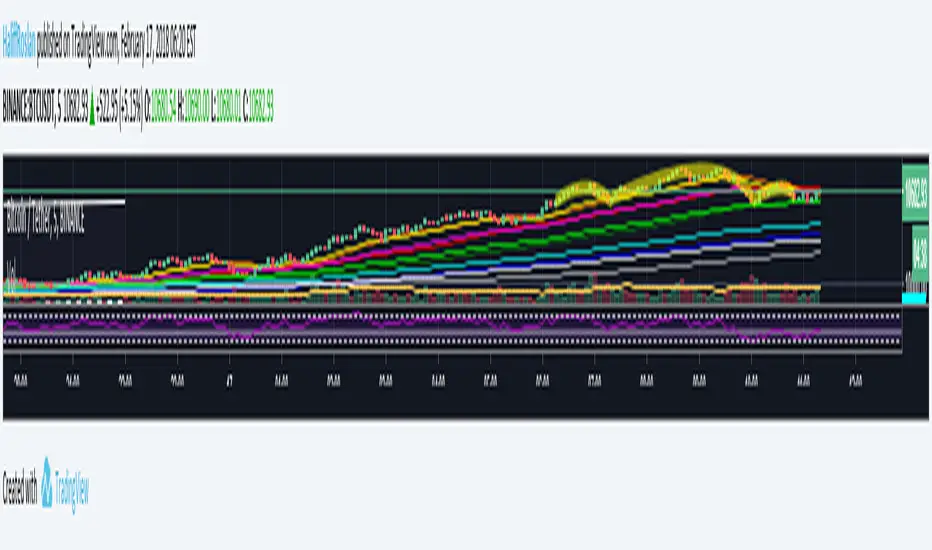
6 Simple Blue & 5 Exponential Yellow Moving Averages6 simple and 5 exponential Moving Averages in one indicator.
I made this because its not always easy to tell what average the price might be bouncing off from when you only have a couple at a time.
For some reason, the defaults aren't working.
To fix this, just open the configuration for the indicator after the first time that you load it.
Then check/uncheck the box and set the time period.
If anyone knows how I can fix this in the code, please let me know.
Blue indicators are simple and the Yellow are exponential.
Thinner more transparent lines are shorter term averages and Thicker lines are longer term averages.
I modeled it after the source of several other scripts which had less averages

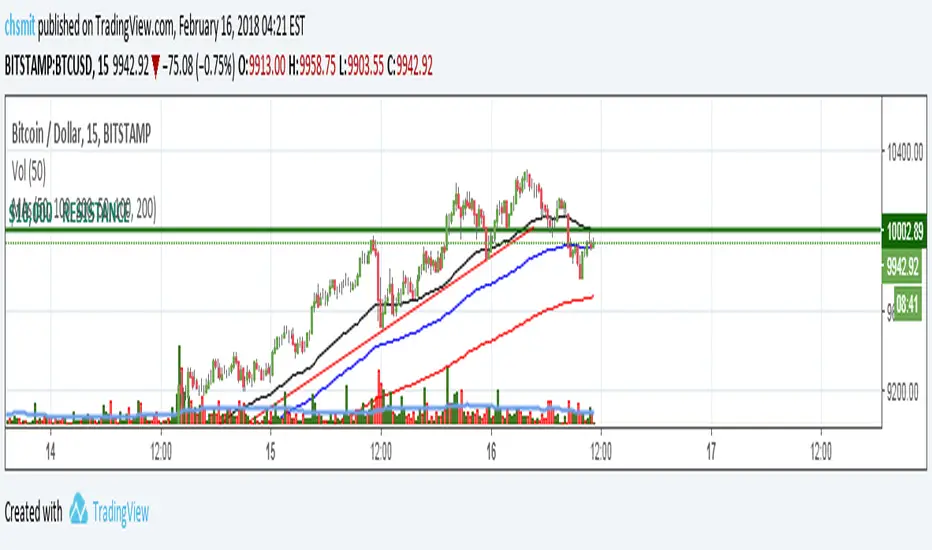
3SMAThis script plots three Simple Moving Averages instead of just one.
Support me going through grad school!
www.linkedin.com
BTC tip jar: 1Mv1s7nLaTsRoLai5WXEGg8doisXuiPUXy
ETH tip jar: 0x6113DDD23D0D5aCad3d1f8640A8A571E9Cb86cB8
LTC tip jar: LYvyoqTSWxa22TQw3E7818xy4AfYNi6xcm
BCH tip jar: 1GC7oZ7MhLkamKCDdZFnUfV21SKWq84VdY

Log-space Simple Moving Average (Set of 3)For convenience, bundles 3 moving averages at 50, 100, and 200

Ultra RSI [DW]This is an RSI Variation with six different averaging methods to choose from.
The averaging methods I've included in this script are:
- Exponential Moving Average
- Simple Moving Average
- Smoothed Moving Average
- Weighted Moving Average
- Volume Weighted Moving Average
- Arnaud Legoux Moving Average
Each method produces a different, yet significant gauge of relative strength.
Custom bar colors are included.

Ultra MACD [DW]This is a variation of Gerald Appel's MACD with seven moving average source types to choose from.
The MA types I've included in this script are:
- Kaufman's Adaptive Moving Average
- Geometric Moving Average
- Hull Moving Average
- Volume Weighted Moving Average
- Least Squares Moving Average
- Arnaud Legoux Moving Average
- Exponential Moving Average
Custom bar color scheme is included with two different colorization methods - one based on the MACD, and the other based on the histogram.

All indicators in one!All indicators in one!
Hull MA (2 colors) + Bollinger Bands + 6 EMA + 50 SMA + 200 SMA + Parabolic SAR + SUPER TREND (2 colors) + Doji signals (yellow)
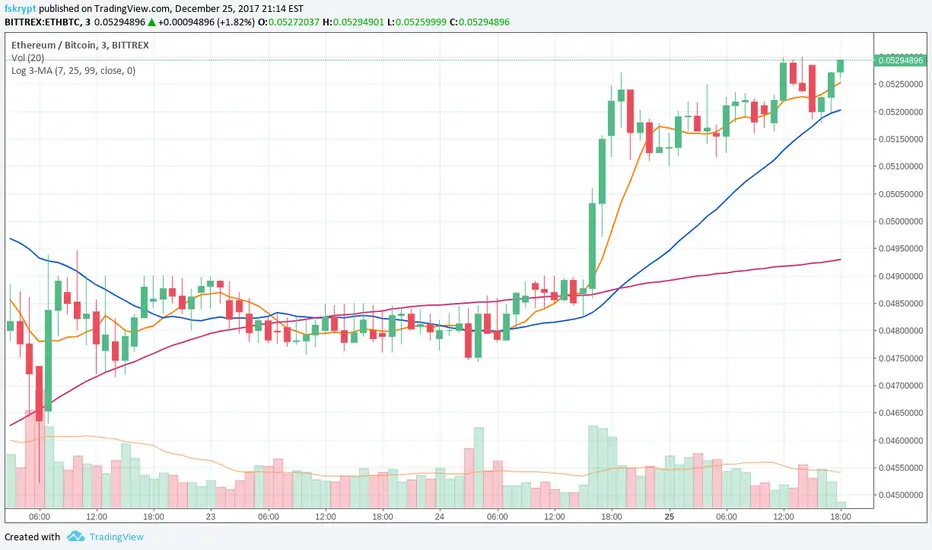
Triple Log-scale MA (Binance style)A combo of 3 MAs for traders who grew accustomed to using Binance MA settings
TSMA by Binko121Triple simple moving average. Use this to plot three averages with a single indicator instead of three individual ones.
Defaults are configured for 50, 100 and 200 interval averages. Adjust interval lengths to your desires.

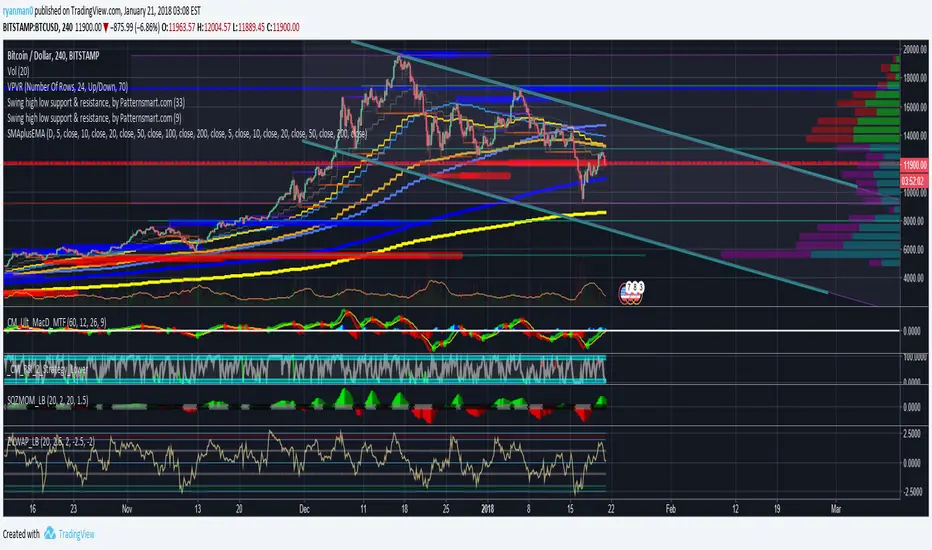
DepthHouse - Moving Average ChannelsThe indicator Moving Average Channels was created for experimental purposes due to the parabolic moves BTC has made in the recent past.
How it works:
The basis, or center line, is a standard moving average that is set by the user.
The bands are then a customizable percentage of the basis.
Which based on the settings, could serve as possible support and resistance.
DepthHouse – Moving Average Channels has been published for you all to see and try for yourselves.
Maybe this indicator has uses elsewhere? If you find something feel free to post it in the comments below!
If you like this indicator, please drop a like or comment!
They are very much appreciated!
Be sure to go to my profile and check out my other indicators!

EMA and SMA SpreadI had hard time to find a simple script to show EMA and SMA spread.
Bonus add for PT users :)
Set "buy_value" as you have in PAIRS.properties to show you when your buys will become potential.

Triple MASuper simple.
Three simple moving averages all in a single indicator for your convenience.
Default values:
MA 1 - 20
MA 2 - 50
MA 3 - 100
If you like this or any of my other scripts - please consider chucking some BTC my way ;) 1LbFxAYJSVPxirT8eW31QHaGbySHyPYgMq

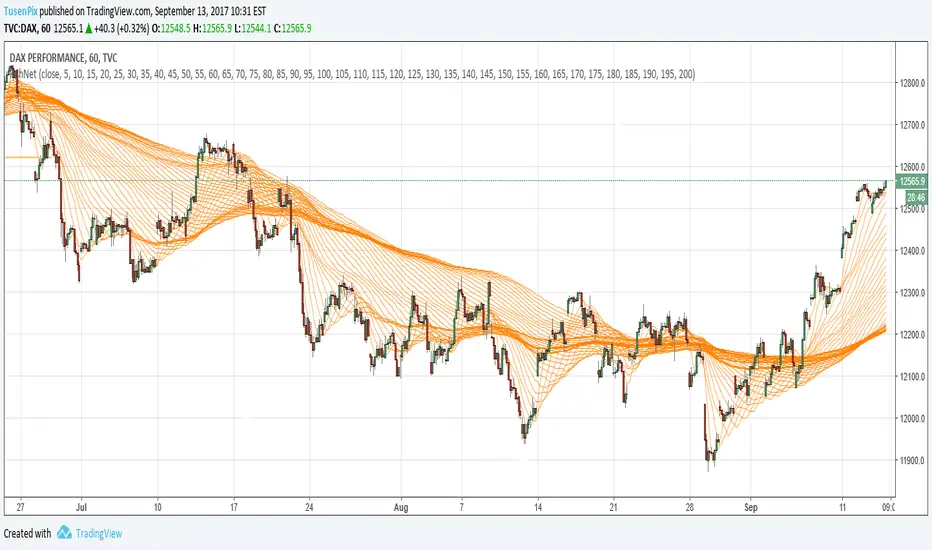
FishNet SMAMoving averages 1-200 that create this FishNet pattern. Works well on all timeframes and together they form resistens and support levels.
Simple and Exponential Moving AveragesThis script graphs 5 SMAs (20, 50, 100, 150, 200) and 5 EMAs (20, 50, 100, 150, 200). The first group uses blue and orange colors whereas the second one uses green and red. When a bar closes below a moving average, either orange or red will be used depending on which type of moving average and which period. In bullish mode, we show blue and green. Moving average periods are configurable, and you can hide the MAs you don't want.

High TimeFrame Multiple MABe vigilant to the levels used by swing traders trading on weekly and monthly charts. Often they use SMA with periods of 3,5,8.

[naoligo] 10x MA (H, D, W, M)This one is based on "Generic 8x MA Plotter" indicator, by @LazyBear.
It will plot three Moving Averages based on current time interval and seven based on chosen periods by hour, day, week and month. You will be able to see where is, for example, a 50 days SMA when using a 5 minutes time interval chart. I find it very useful to analyze, in a snap, possible price ranges and enter/exit points. All reference values are from setups known and used by traders.
Cons: Use it wisely, because if you choose to plot all the 10 Moving Averages, he will consume a lot of the computer resources.
Enjoy!!
Edit: I forgot to mention that you can choose between EMA or SMA for each time interval, that are distributed in:
2x MA Hour;
2x MA Day;
2x MA Week;
1x MA Month.
I've tried to keep the code as simple as possible, so you can increase that number or modify the Moving Average that each time interval will use.
Peace!
