Multiple Moving Averages {Cybernetwork}Multiple moving average (MA) plots in a single script.
Can select between different MA types, and enable/disable a particular MA in the settings.
Enjoy. :)
Basit Hareketli Ortalama (SMA)

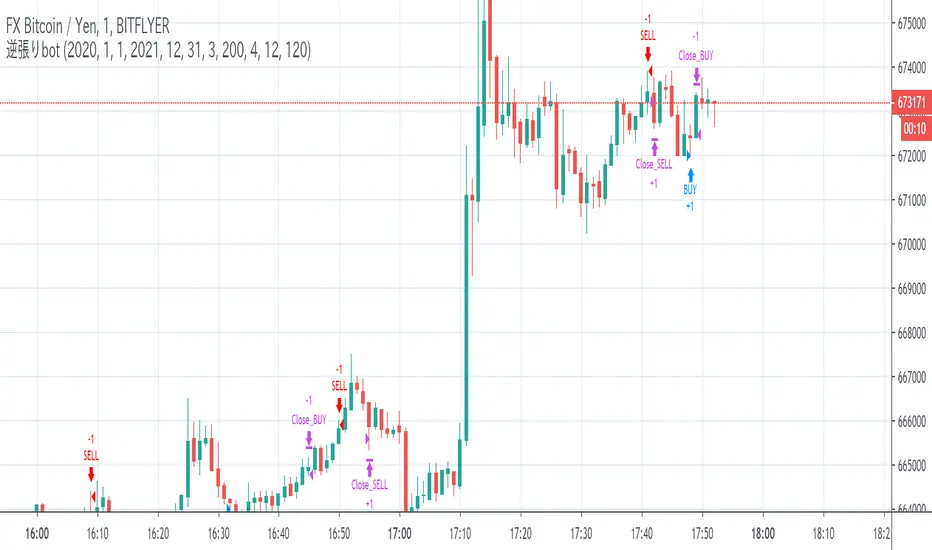
bot strategy1分足逆張りです.この前公開したのよりは遥かに高性能(なはず)です.strategy.exitでstop使ってます.少し詳しくは英文で.
This strategy is the counter trade strategy that I am actually trying to implement, and is realized by a simple combination of 3 indicators (maybe 2 ?. eg. sma ). There is no plan to release the strategy, but it is a script that I personally expect because I am hooked on how to stop the contrarian and the timing of entry. I don't use "security" ,but using strategy.enter(limit) and strategy.exit(stop). It seems that the performance is better than the publicly available "stoploss" because it is not a specific price (eg. 500) range but a variable according to the market price. Since all entry, close, and stop values are shown in the graph, it is possible to find the value back from that value. Good luck.
※Tested environment : FXBTCJPY , 1min
[fikira] MTF MA/EMA'sHere is my take on MA/EMA's and MTF, based on the most excellent work of
"PineCoders" (MTF Selection Framework functions)!
The big advantage is that on 1 image you can easily see where
price is compared to different MA/EMA's (each of different Time Frames).
This gives a lot of Support and Resistance area's!
Includes:
- MA/EMA 20
- MA/EMA 50
- MA/EMA 100
- MA/EMA 200
The present Time Frame MA/EMA has a coloured circle at the side.
Each can be altered in length (the length is visible at the side and changed with the settings)
Each has an extra 4 different Time Frames (multiple settings possible)
Crossover and crossunder MA/EMA 50 with 100 (Silver Cross) and 200 (Golden Cross) is included.
The present Time Frame Cross has a "o" above the Cross
Time Frame 1 Cross has a "1" above the Cross
Time Frame 1 Cross has a "2" above the Cross
Time Frame 1 Cross has a "3" above the Cross
Time Frame 1 Cross has a "4" above the Cross

HIROroom mix indicator「ALL」Moon phases 2020 for Japan
月の満ち欠け 2020年度 日本向け
Full Moon is Purple line
満月は紫色
New Moon is Red line
新月は赤色
ーーーーーーーーーーーーーーーー
Planet orbit cycle Line
惑星の公転周期
Bulu Line : MERCUR
青:水星
Yellow Line : VENUS
黄色:金星
Green Line : EARTH
緑:地球
Orange Line : MSRS
オレンジ:火星
A line that divides one lap into four
1周を4分割したライン
ーーーーーーーーーーーーーーーー
EMA、SMA period can be set
Background used KDJ、SMA logic
When the background is green, there is a chance to buy and when it is red, there is a chance to sell
複数のEMA、SMAを表示できます。
EMA、SMAの期間が設定でき、表示/非表示の設定も可能です。
背景にはKDJのロジックを使用しています。
背景が緑色の時は買いのチャンスで、赤色の時は売りのチャンスです

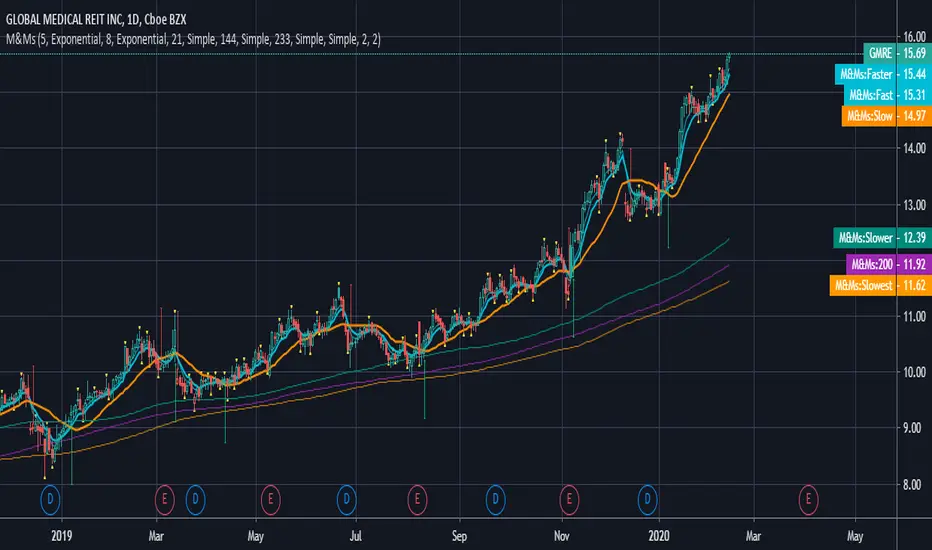
M&Ms - Multiple Moving Average Indicators This version includes Simple, Exponential and Weighted Moving Averages.
TFs Golden Cross - Status BoxThis simple strategy demonstrates the use of Pine Script version 4 "label" feature to show status box.
This box can display anything, in this case it shows current market position, current profit and close price. It renders the box in green if profit is positive, red if negative and blue if neutral.

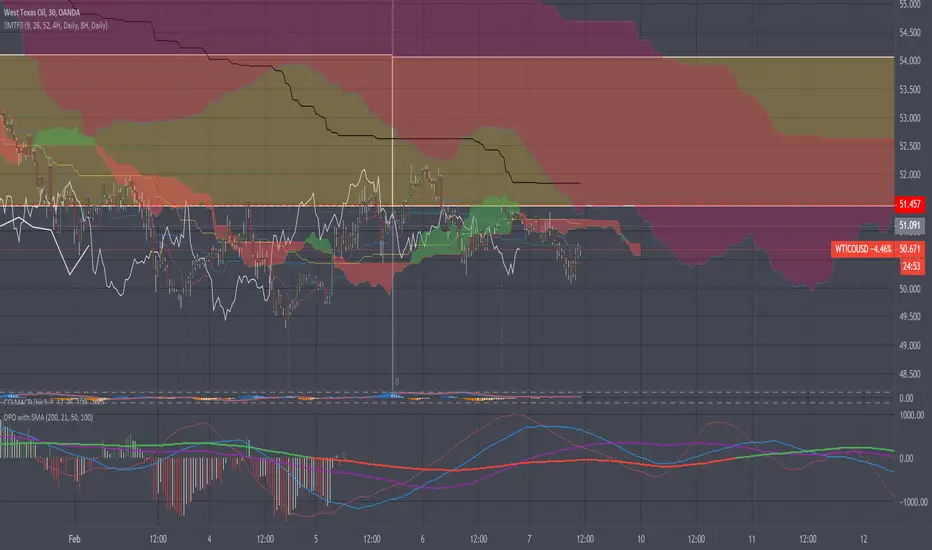
Detrended Price Oscillator with projected SMAHaven't seen any DPO scripts like this one...
Dpo is generaly use to find cycles in the market rather than prices trends.
As you can see a centralized Dpo is ploted with barsback *actual is shown behing actual price timeline.
Using timeline diferences between the two last highest or the two last lowest histogram bands can give you an aproximation of those market cycles.
Dpo SMA's trends can also be use to compare actual price timeline direction in 3 ways...
#-1: Is the actual price (candles) trend is against or with the dpo SMA's (convergence;divergence) ?
#-2: Is the actual price trend is condensed or dispersed ( criticals values)?
#-3: Does the dpo SMA's are near or far from the dpo cycle bottoms or cycle tops ?
Make sure to know that this indicator isn't a trading reccomandation and may not be suited for your trading style as well that it can be badly interpreted. USE WITH CAUTIONS !
//----Coder----//
R.V.
//----Thanx----//
[fikira] Fibma/Fibema StrategyMy strategy regarding the Fibma/Fibema lines (also see my Fibma/Fibema study)
You can enable/disable each strategy to see what
works best in what timeframe
Thanks!
[fikira] Fibonacci MA / EMA's (Fibma / Fibema)I've made SMA/EMA's NOT based on the principle of the 2(1+1), 3(2+1),
5(3+2), 8(5+3), 13(8+5), 21(13+8), 34(21+13), 55(34+21), ... numbers,
but based on these following Fibonacci numbers:
0,236
0,382
0,500
0,618
0,764
1
Ending up with 2 series of Fibma / Fibema:
"Tiny Fibma / Fibema":
24, 38, 50, 62, 76, 100
"Big Fibma / Fibema":
236, 382, 500, 618, 764, 1000
IMHO it is striking how these lines often act as Resistance/Support,
although (except the 50, 100 & 500) they are not typical MA/EMA's.
They perform very well on every Timeframe as well!
Week:
3 Days:
1 Day:
4h:
1h:
Even on the 15 minutes:
Or 5':
Things to watch for:
Price compared to the Tiny or Big Fibma / Fibema (below or above)
Price compared to important Fibma / Fibema (for example below or
above MA 236, MA 764, MA 1000, ...)
Crossing of Fibma / Fibema 24/76, 236/764 and 38/62, 382/618
(bullish crossover = Lime coloured "cloud", bearish crossunder = Red coloured "cloud"),
...
I've made a change in barcolor if the close crosses the "Big Fibma / Fibema 500"
If price closes above MA/EMA 500, the first bar is yellow coloured,
if price stays above this level, candles are coloured lime/orange (= very bullish)
If price closes under MA/EMA 500, the first bar is purple,
if price stays under this level, candles are standard coloured (= very bearish)
Strategy will follow,
Thanks!

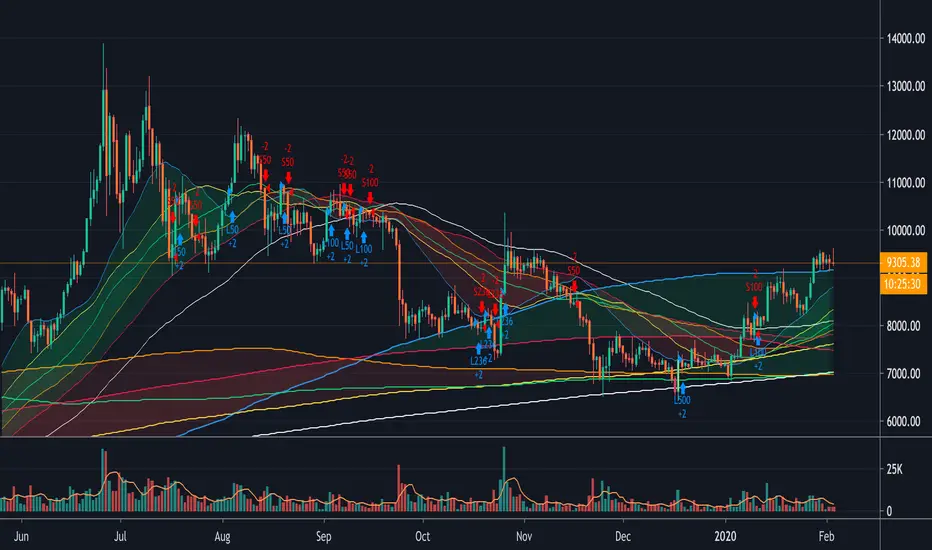
MA 12, MA 24, RSI OB-OS, CCI by WP@SITechDeveloped by Worachart Pirunruk, MD - Siam Intelligence Technology
This is the signal that generates based on 4 Technical Analysis Tools:
1. SMA 12,
2. SMA 26,
3. RSI 14,3,3
4. CCI
Signal to Buy/Long when the RSI below Dynamic oversold line based on close price back 60 bars.
Parameter. This signal doesn't have to best TP point, I'm working on improvement, now. Btw, don't forget to calculate you Margin Level. I'll teach you guys later of how to calculate.
Have fun Trading guys, and don't forget to give back to others. Because, Giving is Receiving."
WP@SITech

Price Average [Indicator]It is an index that shows the average price when you buy the same quantity every minute, every hour, every day, every week, every month.
The value at the n-bar is equal to the value of the n moving average.
You can specify a start date and an end date.
매분, 매시, 매일, 매주, 매월 동일한 수량을 매수 했을때의 평단가를 보여주는 지표입니다.
n봉에서의 값은 n평균이동선의 값과 동일합니다.
시작 날짜와 종료 날짜를 지정할 수 있습니다.

sma dipsparity and sdvFXBTCJPY 1min contrarian script (2020/1/30)
1分足の逆張りです.
If you want to use other timescale, need to change disparity rate and sdv.
To display disparity(sma) and standard deviation, and to draw a hline(pine function) a certain valu. And lets think. I thought disparity rate 1~1.3 or -1~-1.3 are able to use constrarian trade (and sdv>600).
In bottom, disparity index is auxiliary. It is different from the multiple in the script to make the value easier to understand.
Sorry if the expiration date of the script has expired.

ZFelds' MA Squad A Spread of 6 Exponential Moving Averages and 2 Simple Moving Averages.
Based on the Moving Average spread/combination used by Eric Krown but slightly altered to allow for a 9EMA as well as a 10SMA and 200SMA.
Order is as follows:
9e
21e
50e
89e
200e
377e
10s
200s

SMA-EMA RainorThis script consolidates in a single indicator 6 selectable EMA or SMA with different lengths, the value used is by default the closing of the candle
SMA'S are moving averages of the price (in this case the closing of the candle), on the other hand EMA'S are moving weighted averages of the closing of the candle.

Pair Trade cryptoPair trade for crypto with inputs:
* length of correlation and moving average
* trade pair
* spread threshold to enter long / short
* spread threshold to exit long / short
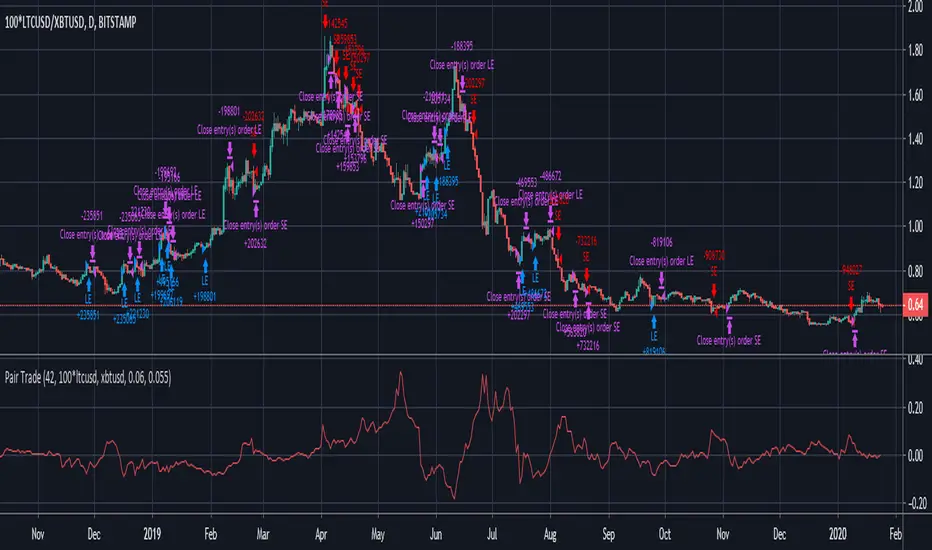
Pair TradePair trade with inputs:
* length of correlation and moving average
* trade pair
* spread threshold to enter long / short
* spread threshold to exit long / short

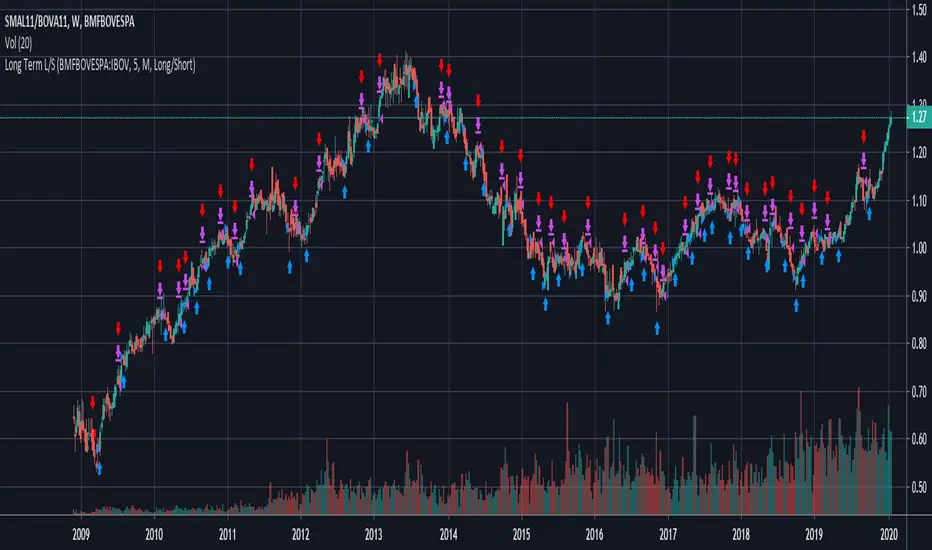
Long Term Long/Short Strategy (Pair Trading)Longing or shorting an asset ratio depending on long term trend.
Long term trend is defined by crossing of an asset or index and its SMA.
Input values:
* trend asset
* SMA configuration (periods, resolution)
* strategy: long only, long/short, short only
Simple Moving Average - ATR Trailing StopThe old adage goes "Cut losers fast and let the winners run"
With this in mind, this will plot a dynamic trailing stop by subtracting any multiplier of the Average True Range (ATR) from the SMA of your choice.

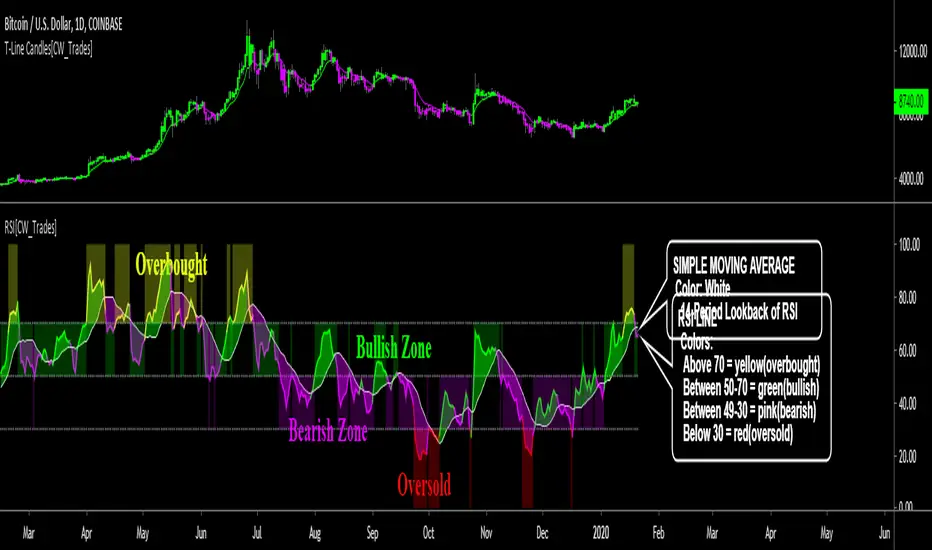
Relative Strength IndexThe relative strength index (RSI) is a momentum indicator that measures the magnitude of recent price changes to evaluate overbought or oversold conditions in the price of a stock or other asset. The RSI is displayed as an oscillator (a line graph that moves between two extremes) and can have a reading from 0 to 100. The indicator was originally developed by J. Welles Wilder Jr. and introduced in his seminal 1978 book, New Concepts in Technical Trading Systems.
Traditional interpretation and usage of the RSI are that values of 70 or above indicate that a security is becoming overbought or overvalued and may be primed for a trend reversal or corrective pullback in price. An RSI reading of 30 or below indicates an oversold or undervalued condition...more here .
-------------------------
*This indicator uses standard RSI settings of a 14-period lookback with a midline of 50, overbought level of 70 and oversold level of 30.
This RSI indicator has been modified to include a simple moving average of the RSI, adjustable overbought and oversold horizontal lines, a color-changing RSI line, color-filled RSI horizontal levels and color-filling the space between the RSI and simple moving average.
-This simple moving average(SMA) is set to a lookback period of 14 and is plotted as a white line. As the RSI moves above and below the SMA the color of the RSI changes; when above the SMA the RSI is lime, when below he SMA the RSI is pink. Lime indicates bullish momentum for RSI, pink indicates bearish momentum for RSI.
-When the RSI line is above 70 the RSI and background both turn yellow, this indicates overbought conditions.
-When the RSI line is below 30 the RSI and background both turn red, this indicates oversold conditions.
-The backgrounds fill the levels the RSI is trading between and can be turned on/off.
-The space between the RSI and SMA is filled and can be turned on/off.
-The RSI line can be set to solid or multi-color.
-The horizontal lines can be adjusted and turned on/off.
-The SMA can be adjusted.
For crypto or volatile markets, overbought and oversold levels of 80 and 20 are recommended.
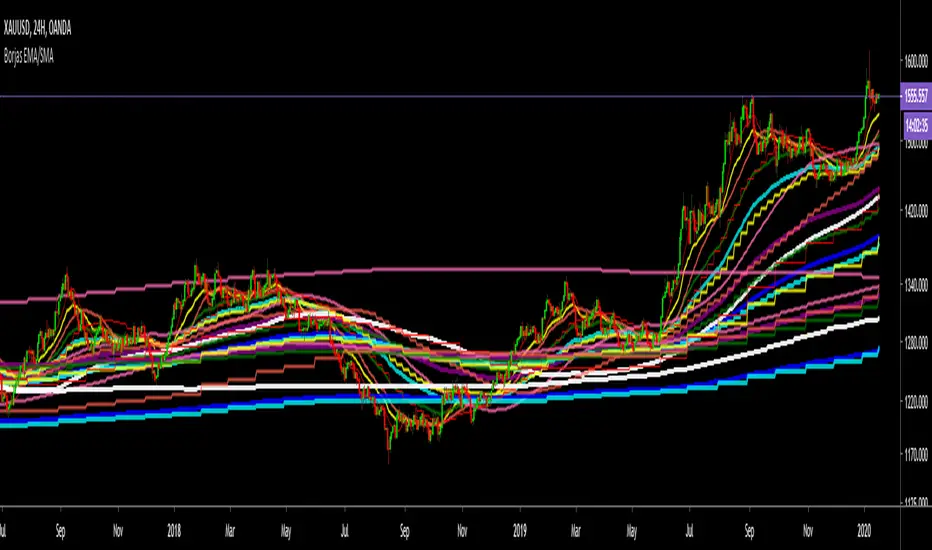
Borjas Tarh EMA/SMA Combo MTFBorjas Tarh EMA/SMA Combo MTF
Include 4 Sets of EMA s & SMA s which can apply to multiple Time Frames .
Each Moving Average can be edited or be toggled. So you can watch specific EMA s/ SMA s on other Time Frames .
© mrhashem
© Borjas Tarh Company
unRekt - KISS CrossKISS Cross is a moving average crossover and is part of the ''keeping it simple' series that have a similar color scheme. With this indicator you can select the moving average you'd like to use either SMA, EMA, WMA, or VWMA. Each moving average can be turned on or off and input changed. The first two MA's will change color on the cross from green to red depending on cross up or a cross down.

Future Label code snippet SMA Just an SMA with a label set in future candels (negative offset) code snippet
Of course u can use it instead of the nomal line.

Bollinger Band BreakoutIt is a long only strategy.
1. Buy when price breaks out of the upper band.
2. Exit has two options. Option 1 allows you to exit using lower band. Option 2 allows you to exit using moving average.
3. Option 1 preferred over option 2 if the instrument is highly volatile.
4. Slippage and commissions are not considered in the return calculation.
