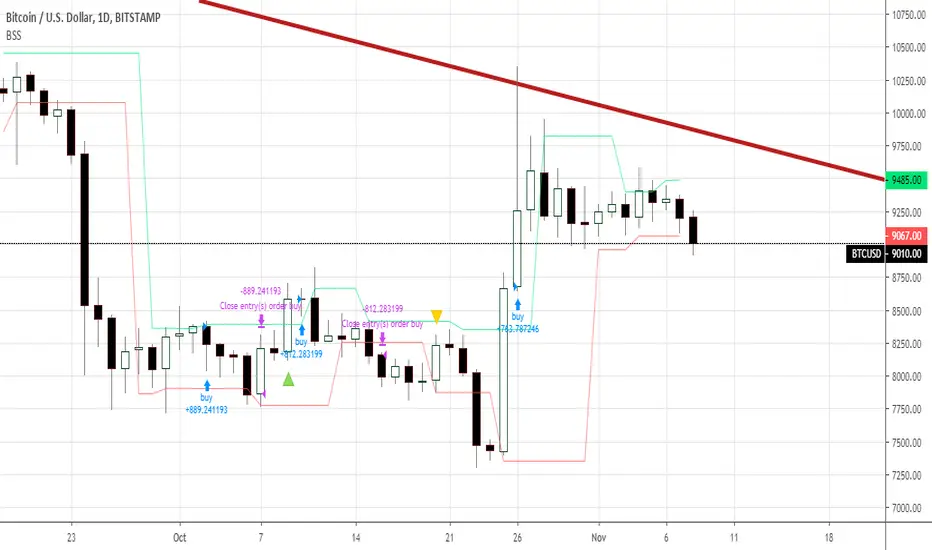
Buy Sell Stop BSSI present to you a beautiful work from me
You can use your own risks
As almost all indicators, it is not working flat market
No settings needed
30min and above time frames should be preffered
No re-paint.
Cheers ;)
About results:
+Calculated from btc born
+Commision added %0.1
+Initial capital 10k
Sellsignal
[BERA] KEANU REEVES STRATEGY TESTThis is a strategy test of my indicator.
Indicator based on Average true range.
LIME ARROW = LONG
RED ARROW = SHORT
LIME COLOR BARS IF GREEN ARROW CONDITION VALID.
RED COLOR BARS IF RED ARROW CONDITION VALID.

RSI with an Opinion (UO)This RSI has a very clear idea about when to buy and sell. It plots buy and sell signals. It is an expert system. Yes, of course, it can make some errors. You should have used stop-loss

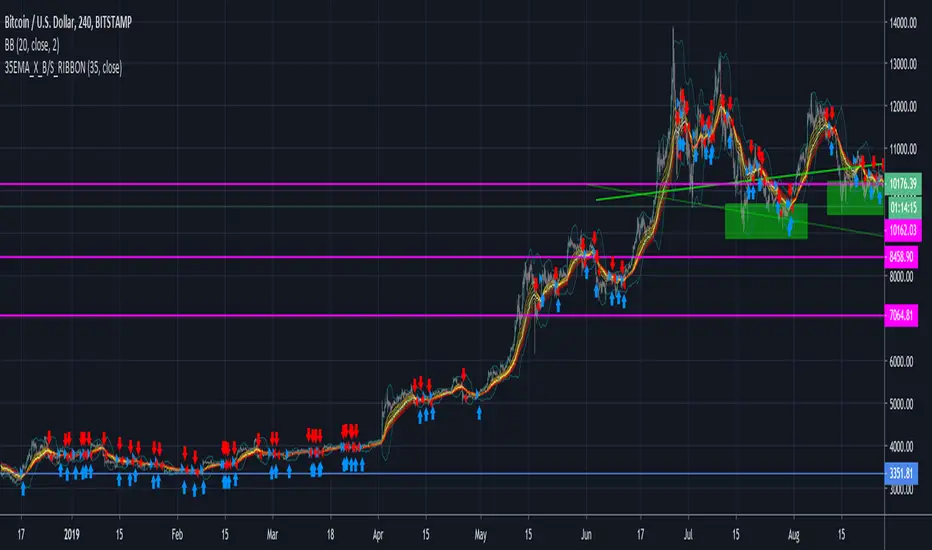
35EMA Cross BuyAndSell Strategy + RIBBON [d3nv3r]This strategy allow the user to move the EMA which control the Buy&Sell Strategy and show the EMA ribbon that can be found in the Template area.
Buy showing the ribbon and letting the user to adjust the EMA signaling the B&S strat the user can create an elaborated strategy for buyPoint and sellPoint.
The 35EMA Cross is choosen by default but I recommend to move it to find best Sell point and best Buy point as you would not react on the same EMA for a Buy signal and a Sell Signal..
It would be good to have buy signal on a EMA and the sell signal on another but that's for another Strategy to be shared.
Let me know by commenting what you would like for the next one !
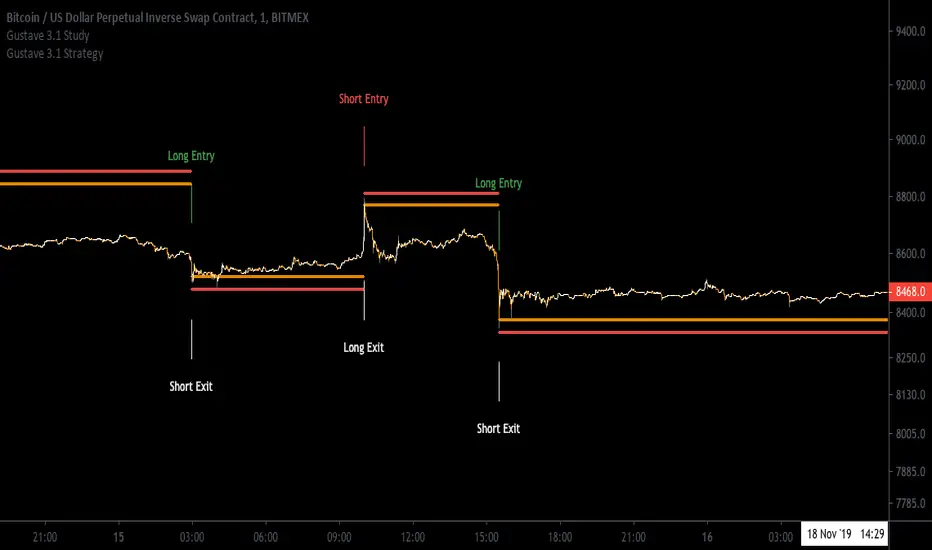
[Aill3urs V.1.0.P] Study GustaveIt's the Study of the this Strategy-Gustave you can find below.
For any info DM me.
150MA Cross BuyAndSell Strategy [d3nv3r]This is a Buy And Sell Strategy I haven't seen anywhere so i share mine.
Used on Bitcoin - daily chart - the strategy generate sell and buy indicator on crossover and crossunder the 150 simple moving average.

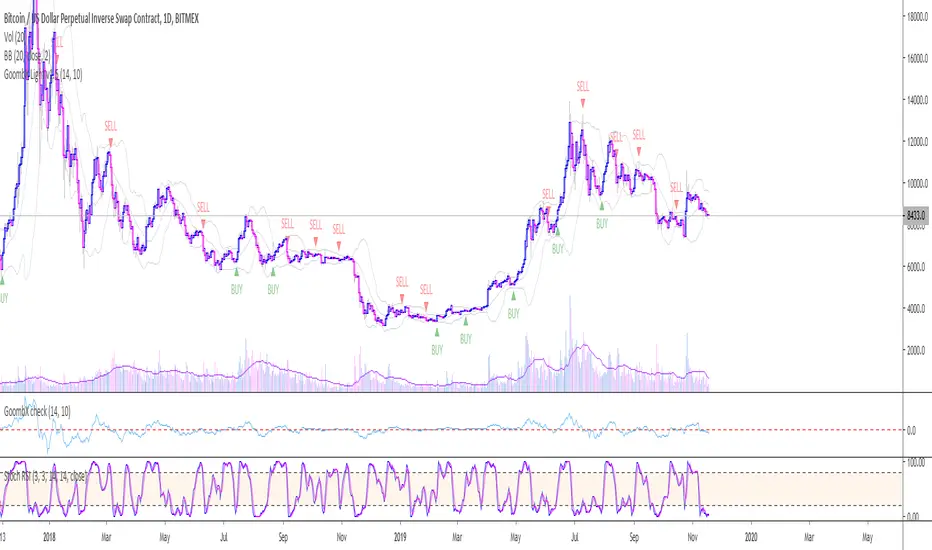
GoombX Light - Get in the trendThis is an MA and stoch RSI based indicator which looks for particular crosses to identify strong trends.
It produces clear signals for:
- BUY when it detects a significant MA cross and the right stoch RSI conditions OR when the SELL signal hits a Stop Loss (adjustable in settings)
- SELL when it detects a significant MA cross and the right stoch RSI conditions OR when the BUY signal hits a Stop Loss (adjustable in settings)
In testing it it performed best on daily chart with a 14 days Lookback window.
NOTE that a signal is only definitive once the trigger candle has closed.
I offer a full featured version which prints STOPS and trade CLOSE. Contact me on Twitter for details on how to gain access.
To setup an alert with GoombX Light, follow these steps:
- Set up GoombX Light on your chart with the desired parameters and Time Frame
- Click on alerts in the right side of the screen and then Add (+)
- Under Conditions, choose the alert you are looking for (BUY or SELL)
- Under Options, choose "Once per bar close"
- Create
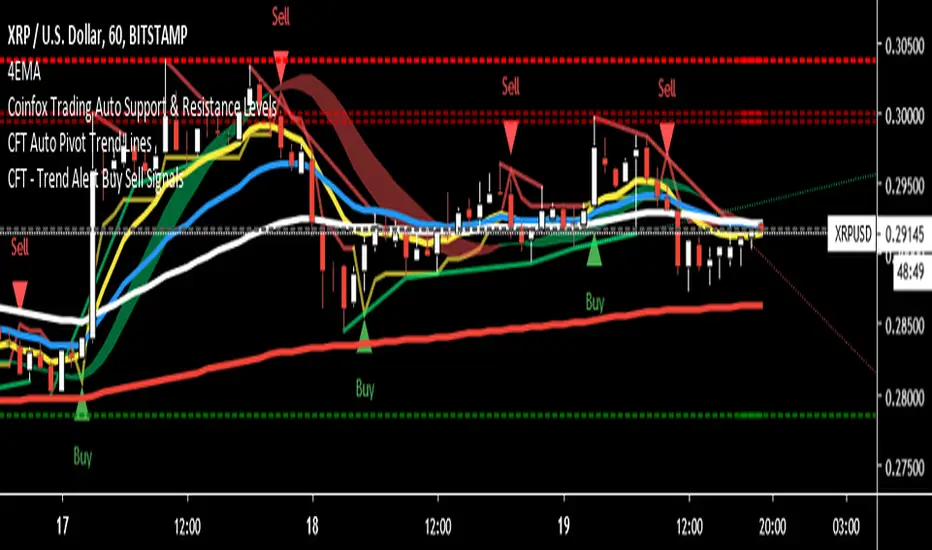
CFT Trend Alert - Buy & Sell SignalsCFT Trend Alert Buy Sell Signal is made to quickly identify possible trend changes. Our Indicator will post BUY & SELL signals at levels that may help you get in on a low risk entry.
This is best used with our CFT Auto Support Resistance Lines.
When you get a signal at support or resistance level you now have a Low risk entry area.
For any help please message me.
Thank You
Histogram Trends Strategy by SedkurThis gives to you buy-sell signal with MACD's histogram trends.
Use "Fast and Slow length" and "Trend of Histogram Number" inputs to take less or more signal.
"Trend of Histogram Number" : This means how many histogram bars the trend continues before trading.

MACD Strategy by SedkurThis gives to you buy-sell signal with MACD histogram value.
Use "Fast and Slow length" and "Buy or Sell Histogram Value" inputs to take less or more signal.

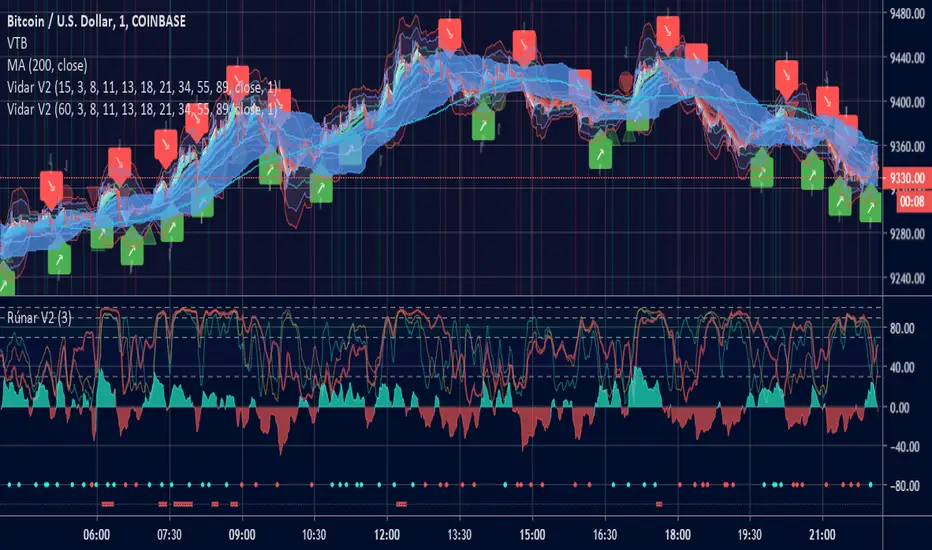
Vidar - Buy and Sell & Trend CipherHi guys, todays indicator comes from the original Odin but has seen some hefty modifications to make it far more accurate based on some recent indicators and learnings. The name comes from Vidar that avenged Odin (fitting as its predecessor).
Vidar has two gears (pawn/king) to help you understand the probability and size of the trade. Kings crowns are weighted to have a larger upside and is intended to inform the trader that a larger position can be taken if he wanted too. Pawns are more "scalp" like signals and should be treated with smaller trades or top up positions between King's crowns.
The indicator also has a simple EMA ribbon to help with trend identification as well as a manipulation trigger to help understand price action outside of signals generated. Green diamonds are bullish closes and red diamonds are very bearish closes.
As always if you want to discuss some TA or come chat about the indicators, or just hang out and chat crypto.
Buy and Sell Indicator - OnePunchOne of the Top Class Breakout, Buy and Sell Strategy for Long Term, Day Traders and Short Term Holder.
With This Script;
You Can Get Breakout Signals
You Can Get Buying Points
You Can Get Selling Points
You Can Find Out If a Stock Over Sold
You Can Find Out If a Stock Over Bought

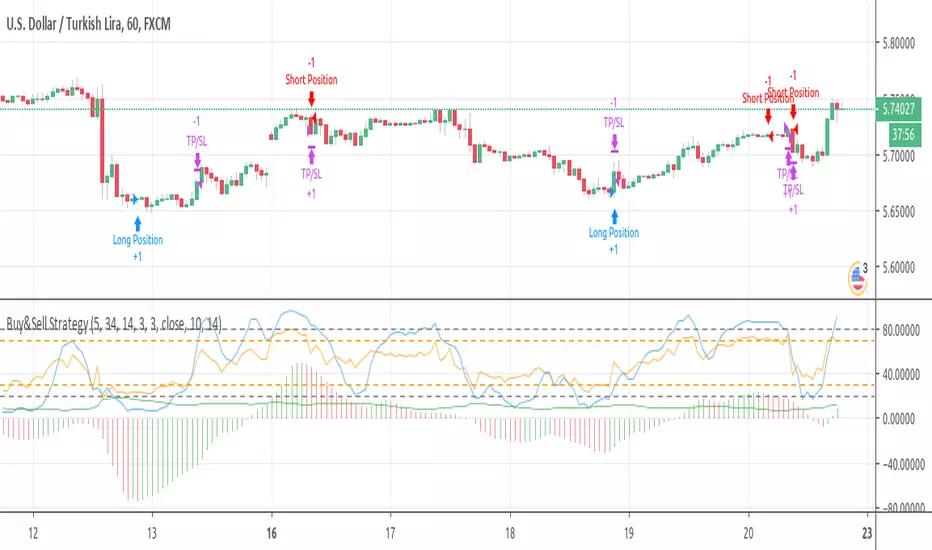
Buy&Sell Strategy depends on AO+Stoch+RSI+ATR by SerdarYILMAZThis strategy is just for training, its purpose is just learning code in pine script.
Don't make buy or sell decision with this strategy.
Turkish/Turkce
Bu strateji sadece pine script'te kodlamanın nasıl yapildigini ogrenmek icindir.
Bu stratejiye dayanarak, kesinlikle al-sat islemleri yapmayin.
How it works?
When RSI and Stoch are in oversold area and if awesome osc. turns positive, take long position. Stop loss and take profit levels were defined with ATR ind.
When RSI and Stoch are in overbought are and if awesome osc. turns negative, take short position. Stop loss and take profit levels were defined with ATR ind.
Turkish/Turkce
RSI ve Stoch asiri satım bölgesinde iken awesome pozitife döner ise long pozisyon açar, zarar kes ve kar al seviyeleri ATR indikatoru ile tanımlandı.
RSI ve Stoch asırı alım bölgesinde iken awesome negatife döner ise short pozisyon açar, zarar kes ve kar al seviyeleri ATR indikatoru ile tanımlandı.


[VIP] Trading ToolkitIndicator includes:
Auto fibonacci retracement
Auto Gannfan (modified)
Linear Regression
Buy and Sell Signal
Fibonacci extension
Moving averages
Alert includes:
When Buy signal appear
When Sell signal appear
Touch Top Linear Regression
Touch Bottom Linear Regression
Crossunder Middle Linear Regression
Crossover Middle Linear Regression
Disclaimer:
Chart colours and styles are dedicated for Dark template (soon for bright version)
More question or request trial? check links below

CoinExpert OscillatorCombined Oscillator with amazingly accurate Buy/Sell signals and alerts.
Includes warnings for possible tops, possible bottoms , etc.
Also contains many perfectly refined indicator s ( VWAP , MFI, MOM, EMA distance) that help serve making the right decisions .
Combined with CoinExpert Overlay and CoinExpert Trend it is possibly the best trading tool up to now .
This is not an indicator, this is a WINdicator!
For access and prices, add me on Discord, Amnesio#0001 or message me here, on Tradingview.

CoinExpert TrendTrend Analysis, shows clear direction of the market
Includes automatic Zig-Zag tracement to show reversals coming up & also has a refined version of different variants of MA's to show really strong support/resistance channels.
Combined with CoinExpert Oscillator and CoinExpert Overlay it is possibly the best trading tool up to now.
This is not an indicator, this is a WINdicator!
For access and prices, add me on Discord, Amnesio#0001 or message me here, on Tradingview.

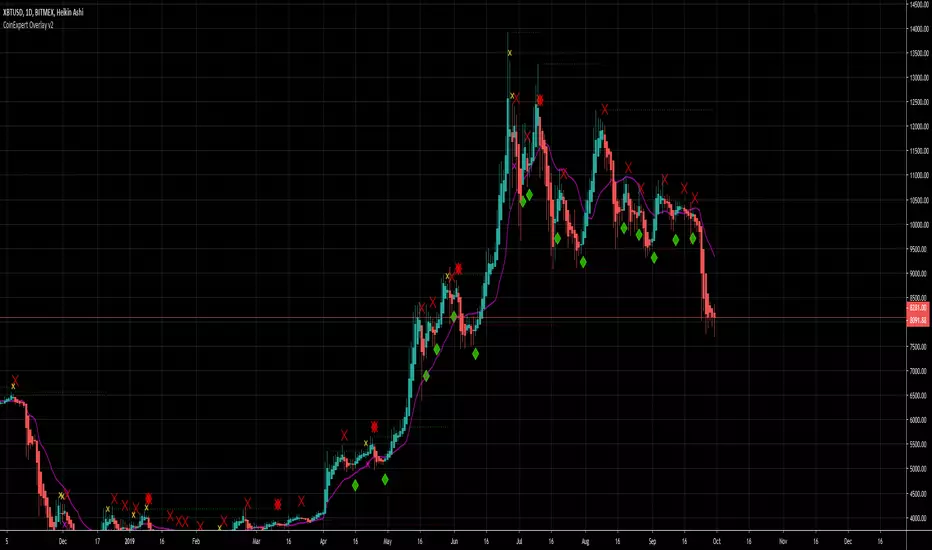
CoinExpert OverlayCandlestick and Trend Analysis with amazingly accurate Buy/Sell signals and alerts.
Includes warnings for possible tops, market manipulation , etc.
Also contains many perfectly refined indicator s ( VWMA , fast/slow EMAS/SMAS, parabolic SAR flip, auto Support/Resistance levels) that help serve making the right decisions .
Combined with CoinExpert Oscillator and CoinExpert Trend it is possibly the best trading tool up to now .
This is not an indicator, this is a WINdicator!
For access and prices, add me on Discord, Amnesio#0001 or message me here, on Tradingview.
Auto Swing Trading IndicatorAuto Swing Trading Indicator is based on 5 different technical indicators. This indicator uses these different indicators to determine the best time to BUY and SELL. This Indicator will not Repaint and signal at candle close is final.
This Indicator is best used on 4 hrs timeframe. But can be used on any timeframe.
Targets (T1) are displayed when there is a BUY signal. Targets are based on the combination of previous High and Low.
The strategy is to sell 50% at T1 and ride until the SELL signal posted.
Buy and Sell Alerts are added for this indicator. In the Alerts window, please choose the option "Once the candle closes" for best results.
More features are going to be added to this indicator.
This is an invite-only script. Please message me for access

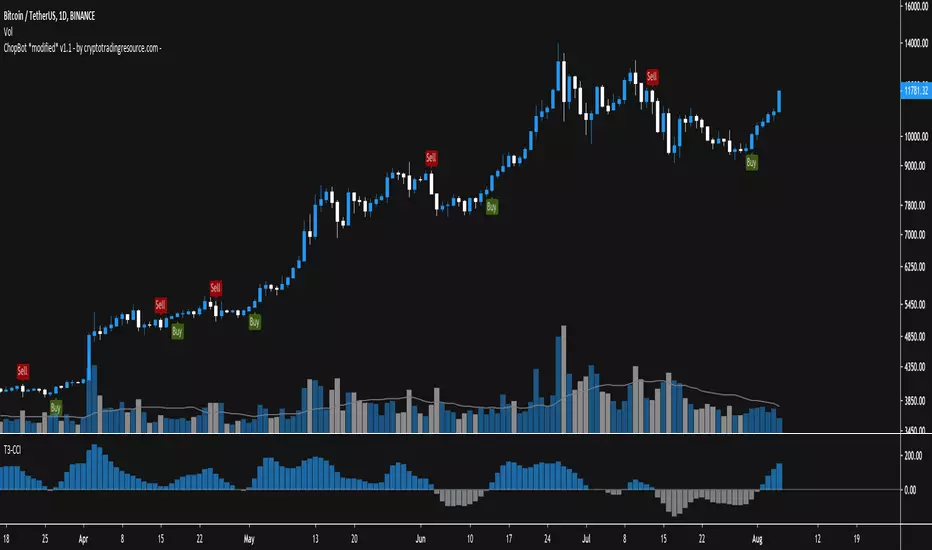
ChopBot *modified* - by cryptotradingresource.com -This is my modified version of the original strategy by @yerb
It has just a little tweak in it, but this already works out that you'll receive less signals. There is for sure more room to perfection but it looks accurate.
Try it out on different timeframes, find the best on for your asset and enjoy trading!
For included:
Buy and Sell plots
Alerts for signals (buy,sell, take profit, ema crossover/crossunder)
Double EMA
more to come.
If you use this tool, let me know if u find some issues, or share your settings with results :)
Some examples:
LINKBTC 1D
BTCUSD 1D
RVNBTC 2D
BNBBTC 1H
THETABTC 6H
Happy trading
+++ use this tool on your own risk. i'm not responsible for your loses +++
____________________________________________________________________________
BTC: 1GVRDK3HHr9CKM5SF2CGpCNXFuavB3L4j9
ETH: 0x7b825fa752b9926D3E8397cDb1d9E5473D074646
XMR: 41zL2SQS7zyZmwXKng2TeUWsMi5vMmkgSdDCjULUTvM6ichwm1E2ZDEYGt56zk9ghoM9bekhjycSwa8amtTcB2JiUet5jtg
NEO: AXja5xPDhczfm2ujHyBfpkQAAnMsXsazmb
ZEC: zcZzFkRx95cp7MtuW8wLhC5zz5RYF9QkT2uPPmhZZHc6ppXepHGgCSeAS1rtD6WFdqsM5p1gZm2gfirnrnviucsdP4aCpqU
XLM: GAXUQJSW55C7MAC4GI26NZUGIKSHFDVFRFKZCXPLMPY4HCADSDT55XK6
WAVES: 3PCMkNpMHxSraTCkwV1ENcBKa9sXbVCGjQX
BCH: qz57n04ud6mn42u00aymqkku8tfh0lk4jv9c28mjvv
____________________________________________________________________________
++++ cryptotradingresource.com ++++
____________________________________________________________________________
Easy Pro Trader IndicatorOur trading indicator is designed for swing traders. A simple but almost perfect indicator, which in itself almost an entire trading system.
You can see our indicator is available for almost every timeline. The timeline can by used in dark and light mode.
The daily timeframe is mostly the best for bigger profits.
Easy Pro Trader is not responsible for any losses you may incur as result of using our Indicator.

SEOCO - BUY/SELL indicatorThis scripts is based on RSI , Stoch RSI and some other indicators.
It provides a BUY and SELL label when loading the script and gives you also the possibility to set a BUY, SELL or BUY/SELL alert.
This script has been designed to do some swing trading on daily candles. After some adjustments it also gives a good result on the 5 minute candles.
