Relative Strength Money Flow RibbonThis is a hybrid of both the RSI and MFI indicators.
Includes options to show coloured alert bars when threshold limits are reached.
Includes:
RSI indicator - yellow line
MFI indicator - green line
Customisable limits include:
Top threshold - 80
Upper limit - 70
Middle line - 50
Lower limit - 30
Bottom limit - 20
Sellsignal

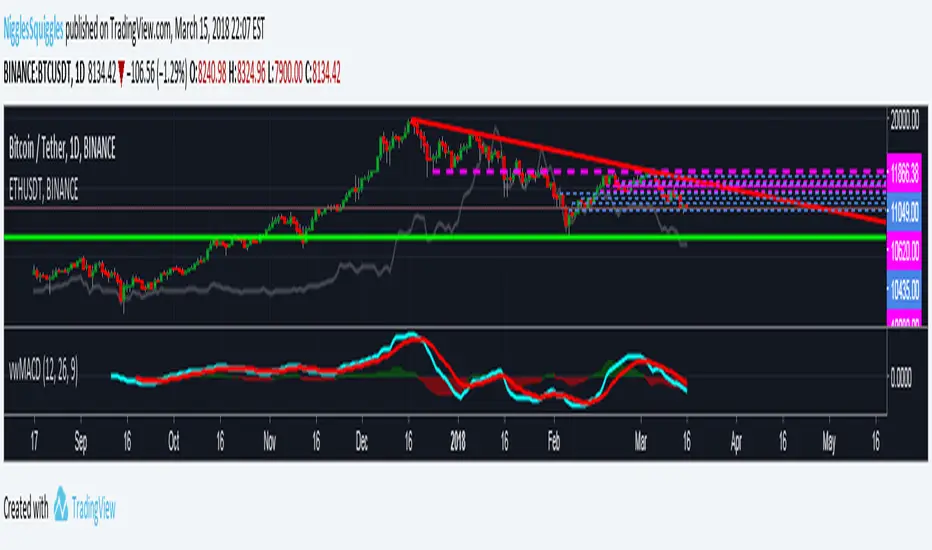
Volume Weighted MACDThis is just like the normal MACD indicator, except that the values are Volume Weighted and the Histogram changes colour depending on the positive or negative value

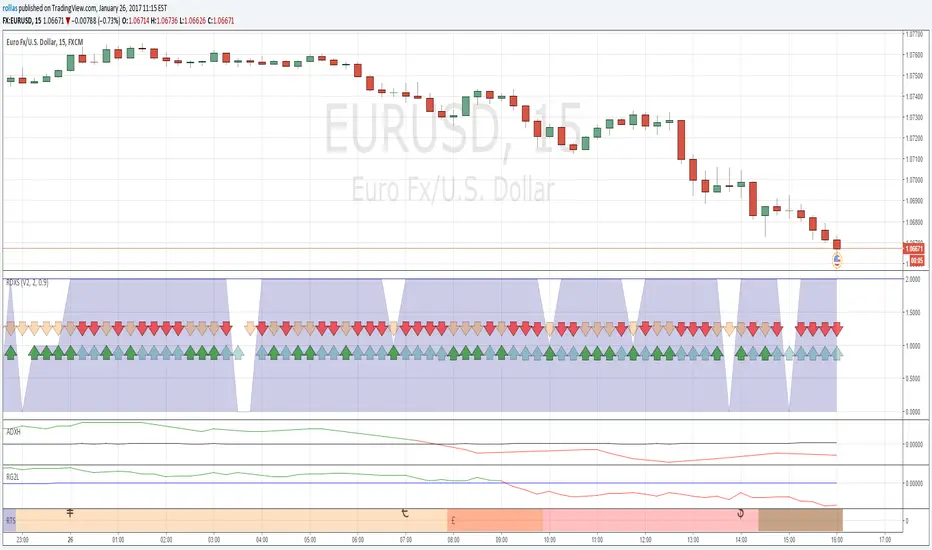
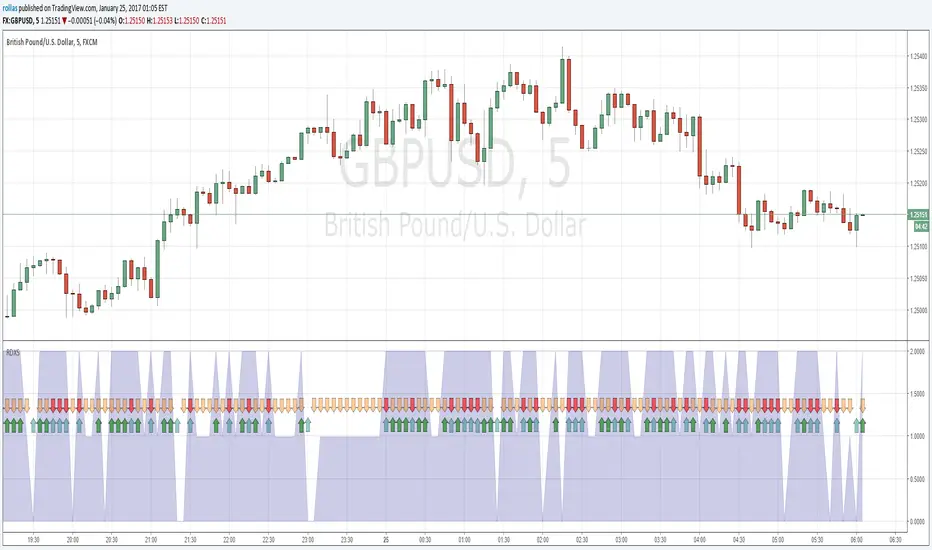
1min_&15min_Crypto_indicatorDear users,
This indicator used Fibonacci, MACD, RSI and Volume.
You just need to consider the "B" signal for Buy and "S" for sell your position...
Color candles stick are just here to confirm the position and use different setting less risky than B and S signals.
If you want to use the maximal potential of this indicator to buy and sell correctly I suggest you to buy and sell with B and S signal and to cut your position to the next B and S signal. You can also choose to cut your position to the next candle stick color... for less risky.
The backtesting of this indicator is 73.6% of good trades on 15 min candlestick and 81,6% on 1 minute candlesticks on BTCUSD. Same indicator is available for equities. (Min&15min_Equity_indactor_V14_Moriceau)
If you have any comment, let me know.

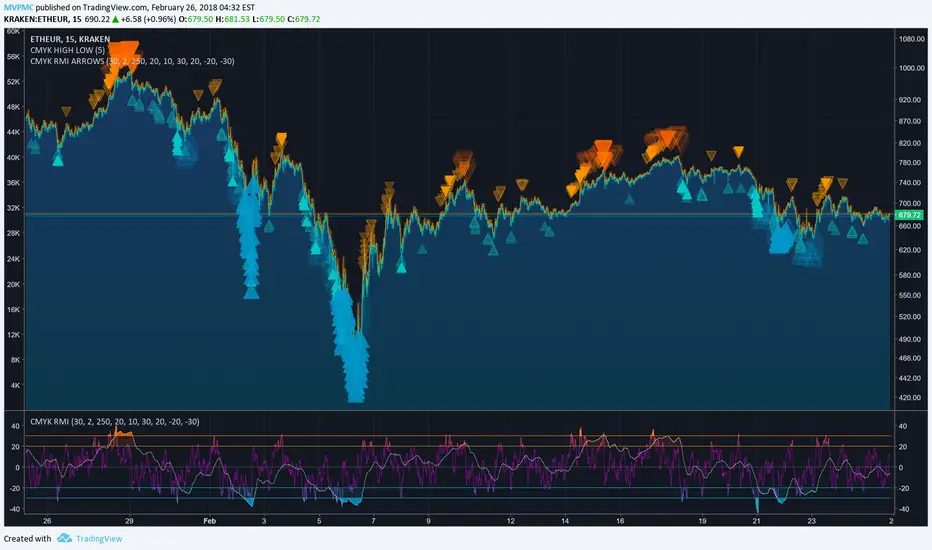
CMYK RMI ARROWS◊ Introduction
I started using this script because of its fast reaction, and good tell for buy/sell moments.
For larger timescales, the overall trend should be taken into account regarding the levels.
In the future i will update this indicator, to automatically adjust those.
This is the Overlay expansion of the Indicator Linked below.
◊ Origin
The Relative Momentum Index was developed by Roger Altman and was introduced in his article in the February, 1993 issue of Technical Analysis of Stocks & Commodities magazine.
While RSI counts up and down days from close to close, the Relative Momentum Index counts up and down days from the close relative to a close x number of days ago.
This results in an RSI that is smoother.
◊ Adjustments
CMYK color theme applied.
Four levels to indicate intensity.
Two Timescales, to overview the broader trend, and fast movements.
◊ Usage
RMI indicates overbought and oversold zones, and can be used for divergence and trend analysis.
◊ Future Prospects
Self adjusting levels, relative to an SMA trend.
Alternative RMI, which functions as an overlay.
◊ ◊ ◊ ◊ ◊ ◊ ◊ ◊ ◊ ◊ ◊ ◊ ◊ ◊ ◊ ◊ ◊ ◊ ◊ ◊ ◊ ◊ ◊ ◊ ◊ ◊ ◊ ◊ ◊ ◊ ◊ ◊ ◊ ◊ ◊ ◊ ◊ ◊ ◊ ◊ ◊ ◊ ◊ ◊ ◊ ◊ ◊ ◊ ◊ ◊ ◊ ◊ ◊ ◊ ◊ ◊ ◊ ◊ ◊ ◊ ◊ ◊ ◊ ◊ ◊ ◊ ◊ ◊ ◊ ◊ ◊ ◊ ◊ ◊ ◊ ◊ ◊ ◊ ◊ ◊ ◊ ◊ ◊ ◊ ◊ ◊ ◊ ◊ ◊ ◊ ◊ ◊ ◊ ◊ ◊ ◊ ◊ ◊ ◊ ◊ ◊ ◊ ◊ ◊ ◊ ◊
░▒▓█ CMYK ◊ RMI █▓▒░
GR-Moving Average CrossA simple indicator that contains all the main Moving Averages you'll probably need.
This indicator can be used on any time frame you wish.
The default periods for the moving averages are 5, 10, 20, 50, 100 & 200.
However you can set these values to whatever works for you, for example 5, 8, 10, 21, etc.
Please let me know in the comments below which values you use the most, so that I can adjust the defaults accordingly.
The lines get darker and thinker the more periods the MA covers.
You can easily adjust the colours of the lines and their thickness too.
The current colours seem to work OK on both the light and dark TradingView themes, but please do make suggestions for better default value.
You can also choose between 7 different ways of calculating the moving averages:
!None = You don't want to see this line
SMA ( Simple Moving Average )
EMA ( Exponential Moving Average )
WMA ( Weighted Moving Average )
DEMA ( Double Exponential Moving Average )
TEMA (Triple Moving Average
HMA ( Hull Moving Average )
This indicator can also show basic buy & sell zones.
They work well after steep trends, but will give lots of poor signals in a sideways moving market.
I find that the sell signal is more reliable than the buy signal.
Use these indications with caution and definitely combine them with other data/indicators as they are only based on the moving averages.
Comments and suggestions are most welcome.
I'm available for hire to create custom indicators or to work on more complex projects.

BSES - v1Buy and Entry signals for a trading pair.
Red and Black bars are selling zone, while green and blue bars are buying zones.
Black and Blue bars are better entry points than their counterparts (red and green ones), and can be highlighted using background coloring of the script.
This is extremely useful in detecting selling zones in a downtrend or buying zones in an uptrend.
Performs best in 2h candles, but can be used on any candle length.
Here is the fun part: Use this script on a 1 minute candle for intraday trades and have fun, profiting!!!

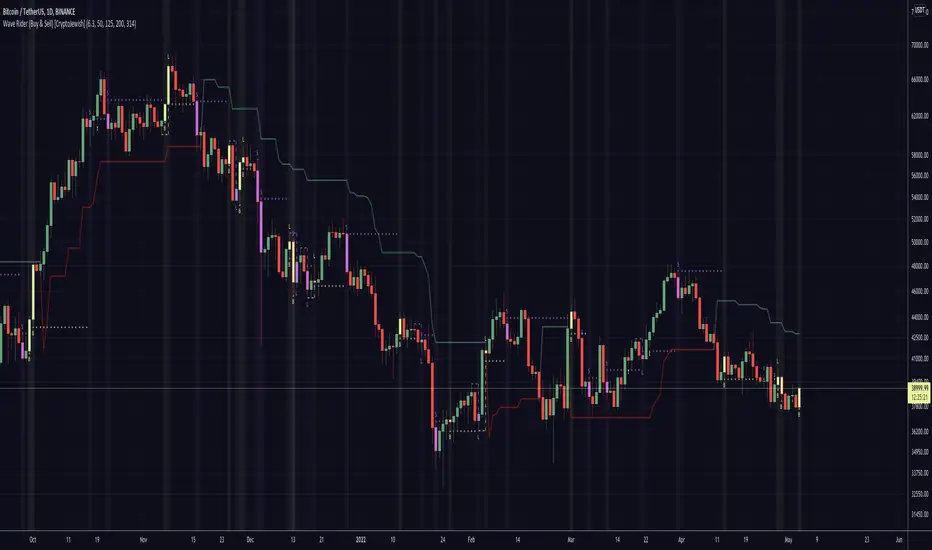
Buy + Sell [CryptoJewish]Beta
This indicator helps identify areas of buying and selling.
There are 4 levels of signals.
1. Weak
2. Medium
3. Strong
4. Extremely strong
Also there is a lagging indicator, which gives a signal of the 2nd level.
Levels greater than 1 are highlighted with a background and the color of the last bar is mixed with the color of the signal.
Almost everything can be turned on / off.
---
Additionally included:
- Ichimoku Cloud with settings for crypto (pure cloud, no extra lines)
- Bollinger Bands
- 4x SMA with a cross between them
9/21 EMAS Cross Under/Over - EGAV1.3 FinalSimple signal buy and sell with emas crossing, works way better in daily charts

PRO MomentumINVITE ONLY SCRIPT:
FEATURES:
As its name suggests, PRO Momentum provides non-subjective momentum analysis to traders through automatic pattern detections, covering a wide range of statistically relevant structures in both ranging and trending contexts. Our goal was to provide a professional grade risk management tool capable of providing various signals, which guide the trader in its decision to engage or not in a certain price area filtered by Framework. Nevertheless, both indicators are complex tools requiring extensive learning. To support students in their journey, there is a wide open online community of users in our Discord channel, providing peer-to-peer assistance to progress with the strategy as well as tutored courses.
OUTPUTS:
To share a brief description of the PRO Momentum functioning, we will scroll through the major set of outputs that are presented to the user. Please note that the indicator is meant to assist from Junior to Senior expertise, to achieve this we have set different base templates right into the indicators. To keep this description simple, we will present the outputs you’ll see with the beginner setup:
Momentum Signals: As shown on the chart, there are multiple types of output signals, each corresponding to different momentum patterns. Detailed documentation is available on our website for those seeking in-depth information. Here's a high-level overview: The patterns are divided into three categories, each represented by different colors. Blue and Red signals are used in trending contexts, Gray signals are for ranging contexts, and dark-colored signals are exclusive to reversal contexts, suitable for more experienced traders. Momentum signals are binary outputs, making it easy for users to set alerts. The indicator includes built-in alerts for these groups to streamline the process. However, it’s crucial to remember that momentum signals are not standalone trading signals. The Framework indicator must first filter interesting prices and identify the context. Only then should traders use momentum signals to adjust risk.
Sinewave Oscillators: Cyclical analysis is a critical aspect of professional risk management. Markets naturally oscillate, and significant statistical probabilities can be derived from cycle studies. We use a custom-modified version of Ehlers’ sinewave methodology. Cyclical analysis, while somewhat predictive, scans past prices to predict probable future states. Since markets are inherently unpredictable, cycle analysis is used as a confirmation signal in our strategy. Essentially, we filter out all momentum signals that occur outside favorable cyclical conditions. Bearish signals are only exploited if the sinewave is in the top area of the oscillator, and vice-versa for bullish signals.
GENERAL STRATEGY:
Overall, the PRO Strategy combines two “core” indicators, Framework and Momentum. Framework is plotted on the main chart section as an overlay, it is definitely the most important as it guides the user through the hard process of filtering prices and timeframes that are suitable for technical analysis. On the other hand, PRO Momentum is on a separate oscillator tab under the chart section, it will study the momentum and cyclical structure, also offering automated pattern detection. Ultimately, our strategy is based on collecting and processing non-subjective rules, emanating from the indicators outputs. Essentially, this means that the indicator actually takes care of producing all the necessary binary outputs, leaving you with the remaining task of combining them correctly following the strategy’s patterns.
RISK LIMITATION:
Even if we provide automated momentum signal detection, there is no “one-click” or "easy-win” solution, the user still needs to carefully review the elements. When applicable pattern rules are confirmed, the user will gather risk-limitation information from both indicators (breakout targets, price confirmations, momentum and cyclical coordination) and decide whether or not to trade according to its own risk profile. If so, the position sizing, stop-loss positioning, risk management and profit targets will all be defined according to the same indicator’s outputs. This effectively suppresses most behavioral and personal biases the trader could introduce, creating a stable and statistical risk management structure aiming for a durable profitability.

Patrones de entrada/salida V.1.0 -BETA-Este algoritmo intenta identificar patrones o fractales dentro de los movimientos de precios para dar señales de compra o venta de activos.

Operación con Pivotes V.1.0 -BETA-Permite identificar puntos pivote diario, semanal y mensual e implementa la estrategia de Day of Reversal con RSI para identificar puntos de inflexión (compra o venta) en los instrumentos.

UltraTrends.V2This is version 2 of Ultratrends.
Like the last version:
Fuschia is pivot down, yellow is pivot up, up is confirmed up, down is confirmed down, green is uptrend, red is downtrend, gray is no trend.
"UP" Is a good indication that the market is going to go up. "DOWN" is a good indication that the market will go down. However, use your head. Think about support / resistance.
Additions:
- 200 EMA/SMA Average (Thick aqua line): Great for determining trend and acts as support / resistance.
- 50 SMA (thin yellow line): Use for 50/200 crosses to determine trend. Serves as weaker resistance.
- Dynamic Pivot points (by finn): Serve as support / resistance levels. Plotted as horizontal dots.
- Early move detection: demonstrated by either a green triangle below bar or red triangle above bar.
- "Hot Zones": volume based background highlighting the manifestation of bullish conditions. Default color is white, so if you use a lighter background, please change it to another color.
This indicator works best with 1337 Volume:
The only way to get this script is by joining Gambit Private Trading Room. There are currently ~ 90 experienced traders in the room at the time of this post that share the best ideas / setups. For more information, please fill out the form at: GambitCrypto.com
Enjoy

DXY SIGNALDXY Correlation indicator Version 2. Added adjustable parameters. Correlation factor is how many bars back for the colleration cumputing. Threshold adjusts the minimum correlation level to give signals. Default is 0.9. Value 1 equals %50 correlation while 2 is %100 correlation.
DXY SIGNALWorks on pairs including USD ticker. Gives buy and sell signals according to the relationship with DXY.
Hyper TrendHyper Trend can help you with setting your stop loss and take profit levels and shows if exisiting price levels are in long zone or short zone. Tune the indicator first for the chart you intend to use Hyper Trend on with the given options. Enjoy !
PS: Multiplier 2 gives results similar to the famous Super Trend indicator developed by Olivier Seban.

Magic Circles V3Magic Circles indicator uses an ATR based trend indicator in conjunction with a Parabolic SAR indicator for creating signals. Blue is neutral. Green is buy and red is sell. A hollow green circle followed by a regular green indicates a strong buy while a hollow red circle followed by a regular red one indicates a strong sell signal. This version gives you the option to choose your own magic number. Default is 1.618 also known as the golden ratio. The indicator works best at trending markets.
Version 3 comes with ADX filtering to avoid misleading signals and set on by default. Also you can now see the support / resistance levels. Another option added is showing the current trend direction.
ADX is Average Directional Index and founded by Welles Wilder. Wilder published his work in his book titled New Concepts in Technical Trading Systems (1978).

Magic Circles V2Thanks for your feedback in regard to the Magic Circles indicator. As a common question, Magic Circles indicator uses an ATR based trend indicator in conjunction with a Parabolic SAR indicator for creating signals. Blue is neutral. Green is buy and red is sell. A hollow green circle followed by a regular green indicates a strong buy while a hollow red circle followed by a regular red one indicates a strong sell signal. This version gives you the option to choose your own magic number. Default is 1.618 also known as the golden ratio. The indicator works best at trending markets.

Magic CirclesMagic Circles give buy and sell signals. Works best at trending markets. When using lower time frames, it is beneficial to confirm the signals with a 4H chart.

Range_Outlier_ActionThis identifies Buy and Sell Points once the period high breaches the SMA High and period low breaches the SMA Low. It produces profitable results greater than 87% of the time. You should still monitor and set up stop-losses as appropriate.

Romi Trend and Momentum Oscillator
Great oscillator which determines trend and momentum. So accurate it could be used as a stand alone indicator.

Stock Market Trend Analysis Trading System 101 (by ChartArt)This is a very simple trading system which is measuring the core of uptrends and downtrends using three basic elements: Close price, HL2 price, Pivot price.
Depending if the uptrend or downtrend is strong, the buy/sell signals are shown in different colors. The stronger trends are in brighter colors (lime and fuchsia). If the trend just fully changed direction from uptrend to downtrend (or vice versa), there is a background color highlight in the color of the new trend direction.
The trend detection should work best on monthly charts. I have created this in under an hour. My goal was to use the least amount of rules possible, therefore there are many false signals and the code is quite lazy.
You can lose all your money if you rely on these buy/sell signals!
