WaverVanir Alpha Reversal Scalper [ETF Eval Bot]🧠 Strategy Overview:
The WaverVanir Alpha Reversal Scalper is a precision-engineered futures trading bot designed to pass prop firm evaluations, specifically Elite Trader Funding (ETF) via Tradovate integration.
This scalping engine was developed after analyzing over 100+ evaluation trades, and is powered by institutional logic, volume behavior, and adaptive VWAP-based confluence.
🔍 Core Logic:
Directional Bias: Trades long only based on VWAP slope confirmation (to avoid funding-damaging shorts)
Entry Conditions:
Price deviates below VWAP standard deviation
Volume spike exceeds 1.5× 20-period average
Bullish reversal wick detected (smart money pattern)
Exit Management:
Stop Loss: 10-tick precision SL below local low
Take Profit: 2.5R static or dynamic trailing stop
Session Filter: Trades only between 9:00–14:00 ET, avoiding lunch and close traps
📊 Backtest Summary (ESU2025)
Metric Result
Net Profit $9,487.50
Profit Factor 1.66 (longs)
Sharpe Ratio 0.03
Sortino Ratio 0.042
Winning Bias Long-Only
Max Drawdown Under $3,000
Commissions $0 (sim tested)
🧪 Tested across March–July 2025 on CME Mini ES (ESU2025)
🔒 Short trades disabled after review: Net −$7,312.50 loss on shorts alone
✅ Profit factor improves > 60% post-optimization
🔄 Recent Optimizations
❌ Disabled unprofitable short setups
✅ VWAP slope filter added for institutional alignment
✅ Trailing stop logic added (activates after 1.5R)
⏱️ Session filter to reduce market noise
🧠 Designed For:
Passing ETF funding challenges quickly
Avoiding drawdown breaches with controlled risk
Running on TradingView with direct Tradovate integration
🚀 Execution-Ready
This bot runs natively on TradingView. Simply:
Add the Pine Script to your chart
Use a tradable symbol (e.g., ESU2025)
Create an alert using “Order fills”
✅ Enable auto-trading to Tradovate
📡 Learn More
🔗 Powered by VolanX Protocol, the AI-driven infrastructure layer of
🌐 WaverVanir International LLC – where institutional logic meets retail precision.
—
🧠 Want to upgrade this bot to include macros, adaptive entries, or launch in NQ/CL?
💬 Drop a comment or message — let’s build your funding empire.
#ES #Futures #ETF #Funding #PropFirm #TradingBot #VWAP #VolumeProfile #AlphaScalper #WaverVanir #VolanX
"wave" için komut dosyalarını ara

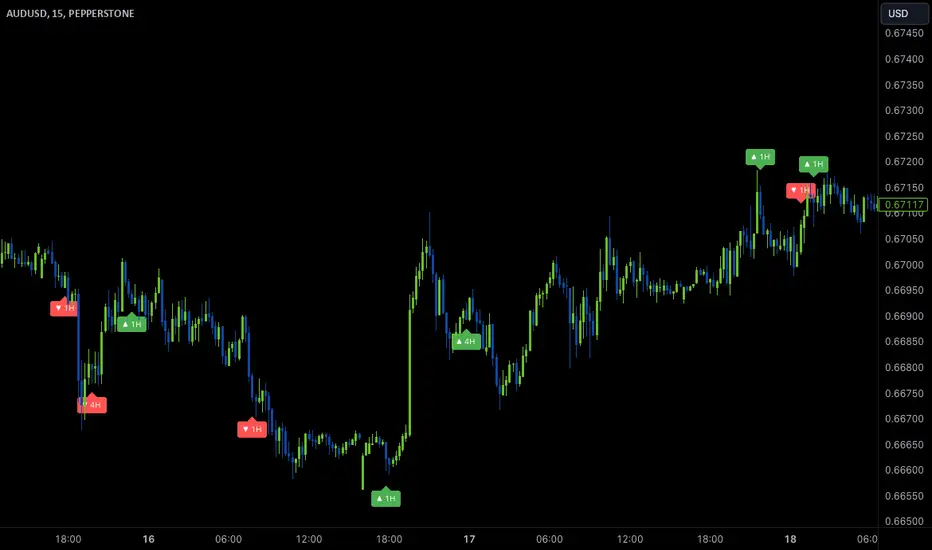
Wave Anchor IndicatorThe Wave Anchor Indicator is designed to mark the crossing of overbought and oversold levels of higher time frame momentum waves, based on the VuManChu Cipher B+Divergences Wave Trend Indicator. This tool is inspired by the TP Mint trading strategy, which relies heavily on the momentum waves of Market Cipher B or VuManChu Cipher B for identifying optimal entry and exit points.
Key Concept: Anchored Waves
In the TP Mint strategy, momentum waves in overbought (above 60) or oversold (below -60) conditions on higher time frames are considered "anchored." These anchored waves provide strong signals for entries and take-profit points when viewed on lower time frames. The Wave Anchor Indicator focuses on these anchor conditions to help traders make informed decisions by seeing higher time frame anchor states directly on the entry time frame chart.
How It Works
Labeling Signals:
- On lower time frames, such as the 15-minute chart, the indicator shows labels when higher
time frame momentum waves (1-hour and 4-hour) cross the overbought or oversold levels.
- Labels above price indicate overbought conditions, with green labels when the wave crosses
upward and red labels when crossing downward.
- Labels below price signal oversold conditions, with red for a downward cross and green for an
upward cross.
- Each label displays the time frame of the crossing momentum wave, providing context for
traders at a glance.
Time Frame Pairings:
- On the 15-minute time frame, the indicator tracks anchor conditions from the 1-hour and 4-
hour time frames.
- On the 1-hour chart, it monitors 4-hour and daily time frame anchor conditions.
Customization and Alerts
Flexible Display Options : Users can choose to display none, one, or both of the grouped higher time frame labels, depending on their strategy and preferences.
Alerts : The indicator also allows for custom alerts when a label appears, helping traders stay on top of key market movements without constantly monitoring the chart.
Use Cases
This indicator is ideal for traders who use momentum-based strategies across multiple time frames. It simplifies the process of identifying key entry and exit points by focusing on the anchor conditions from higher time frames, making it easier to execute the TP Mint strategy or similar methods.
Thank you to VuManChu and LazyBear for mamking the momentum wave code open source and allowing it’s use in this indicator.
Wavy TunnelEasy Wave Tunnel
Wavy Line ;
ema34 3 lines = High, Close , Low
Tunnel Line ;
ema144 , close and ema169, close
5 Rules to use WaveTunnel
1. Wavy Lines and Tunnel Lines are the natural Resistant and Support line.
2. Price above both Wavy & Tunnel = Uptrend , Price below both Wavy & Tunnel = Downtrend
3. Break Wavy Line , price run to Tunnel Line
4. Not Pass Tunnel Line, price run back Wave Line
5. Hit Tunnel and retrace less then 61.8% , then Break out, Price go AB=CD pattern
Wavy Tunnel By Wave Riders Styles

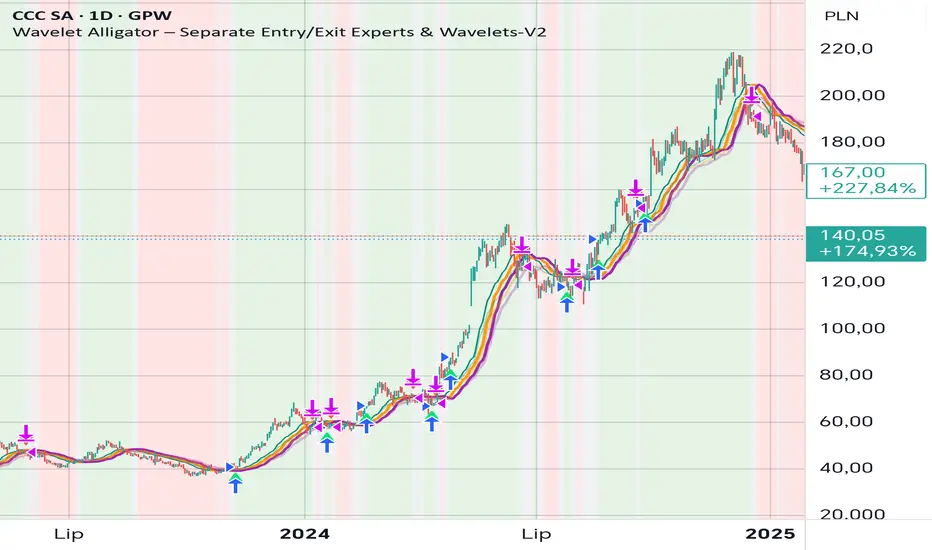
Wavelet Alligator – Separate Entry/Exit Experts & Wavelets-V2
Wavelet Alligator – Strategy Explanation & How to Use
1. Concept Overview
The Wavelet Alligator strategy combines:
- Wavelet transforms (Daubechies, Haar, Symlet, Mexican Hat, Morlet)
- Fractional calculus kernels: Caputo-Fabrizio (CF) and Atangana-Baleanu (AB)
- Three-layer “alligator-like” wavelet smoothing (soft → medium → strong)
- Expert-based entry/exit routing (RAW, CF, AB, or Majority vote)
- Independent wavelets for ENTRY and EXIT
- Main trend defined by AB wavelet ordering
This creates a multi-structure, multi-kernel trend engine capable of capturing extended moves with high signal quality.
2. Wavelet Alligator Structure
Each source (RAW, CF, AB) is transformed into three wavelet layers:
Soft = fastest reaction
Medium = mid smoothing
Strong = trend backbone
Wavelets:
- Daubechies: stable trend
- Haar: fast impulse detection
- Symlet: balanced
- Mexican Hat: curvature and reversal detection
- Morlet: cyclic, oscillatory
3. Entry Logic
Long entry occurs when:
- AB wavelet shows bullish structure (soft > medium > strong, medium rising)
- Selected entry expert approves (RAW / CF / AB / Majority)
- Wavelet condition: soft > strong AND medium crosses above strong
4. Exit Logic
Exit is independent from entry:
- Controlled by chosen exit expert
- Wavelet reversal condition: soft < strong AND medium crosses below strong
- Forced exit when AB trend turns neutral or bearish
5. Background Color (Regime)
- Green: bullish AB regime
- Red: bearish AB regime
- Gray: neutral/transition
6. How to Use
Step 1 – Choose entry wavelet
Daubechies: stable trend
Haar: breakout scalping
Mexican Hat: early reversals
Symlet: balanced
Morlet: cyclic markets
Step 2 – Choose exit wavelet
Mexican Hat: best precision
Daubechies: smooth exits
Haar: aggressive exits
Step 3 – Select entry/exit experts
CF only – fast fractional trend
AB only – stable long-memory trend
RAW only – pure price structure
Majority – safest, noise-filtered
Step 4 – Run the strategy
Entries occur only during AB bullish trend.
Exits occur on wavelet reversal or AB trend failure.
7. Why This Strategy Works
It fuses:
- Fractional calculus (memory)
- Wavelets (shape/curvature)
- Alligator ordering (trend hierarchy)
Result: high-quality entries, strong trend holding, noise-resistant signals.
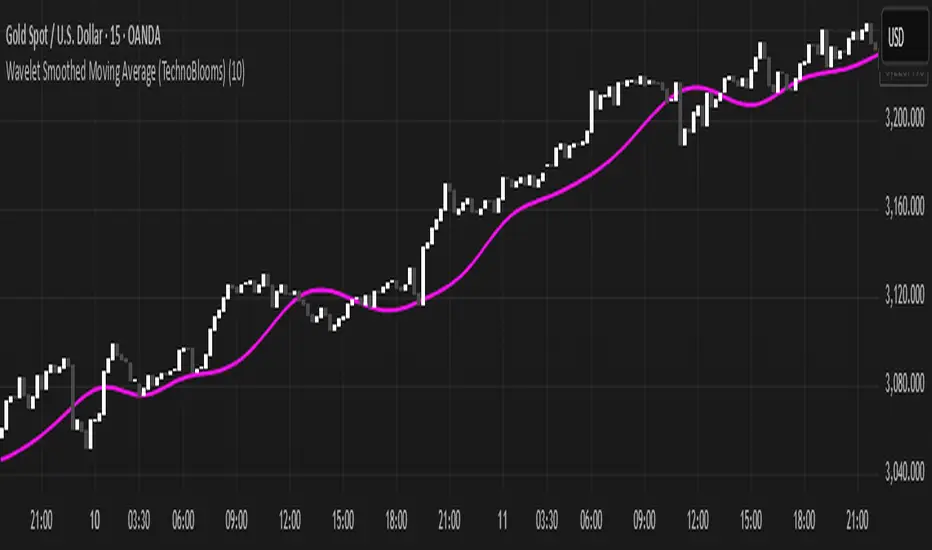
Wavelet Smoothed Moving Average (TechnoBlooms)Wavelet Smoothed Moving Average (WSMA) is a part of the Quantum Price Theory (QPT) Series of indicators.
Overview:
The Wavelet Smoothed Moving Average (WSMA) is a trend-following indicator inspired by multi-level Haar Wavelet decomposition. Rather than using traditional wavelet basis functions, it emulates the core wavelet concept of multi-resolution analysis using nested simple moving averages (SMA).
How It Works:
WSMA applies three levels of smoothing:
• Level 1: SMA on price (base smoothing)
• Level 2: SMA on Level 1 output (further denoising)
• Level 3: SMA on Level 2 output (final approximation)
Why Use WSMA:
• Multi-Level Smoothing: Captures price structure across multiple time scales, unlike single-length MAs.
• Noise Reduction: Filters out short-term volatility and focuses on the underlying trend.
• Low Lag, High Clarity: Unlike traditional moving averages that react slowly or miss subtle shifts, WSMA’s layered smoothing delivers cleaner and more adaptive trend detection.
Unique Value:
• Wavelet-Inspired Design: Mimics core wavelet decomposition logic without the complexity of downsampling or basis functions.
• Perfect for Trend Confirmation: The final line (a3) can act as a trend filter, while the detail levels can help identify momentum shifts and volatility bursts.
• Fits Into Quantum Price Theory: As part of the QPT framework, WSMA bridges scientific theory with trading application, giving traders a deeper understanding of market structure and signal compression.
Waves CorrectionsWave theory tool for tracking waves relations and their corrections. It filters out a sets of formations and count how often correction from them are reaching characteristic correction levels marked on the chart as CL1, CL2, CL3.
It supports 2 rulesets/wave variants:
Low - Based on more sensitive trend detection.
Medium - Based on less sensitive trend detection.
Script settings:
| SCANNER |
Trend type - Trend used by scanner to detect sets of waves.
L - Low
M - Medium
<= W1/W2 * 100% <= - Tresholds describing proportions between 1 and 2 wave in the set.
<= W3/W1 * 100% <= - Tresholds describing proportions between 3 and 1 wave in the set.
<= W3/W2 * 100% <= - Tresholds describing proportions between 3 and 2 wave in the set.
Show potencial areas - Showing underway sets
Show Arrows - Showing arrows with possible correction on underway set.
Correction from trend UP - Background and border colors for found sets in up trends
Correction from trend Down - Bakcground and border colors for found sets in down trends.
History - Showing sets in historic data.
Stats - Type of statistic table shown on the screen:
H - Hide
% - Statistics with normal font
%s - Statistics with small font
Wn n= - Picking how many waves are taken into account when calculating statistics .
| TREND VISUALIZATION |
Type - Trend visualization types:
H - Hidden
L - Low
M - Medium
B - Both
Alfred - AI assistant that informs about wave confirmation or trend changes (With "Both" type Alfred will monit only Medium wave).
Shadow - Showing second reprezentation of the trend with drawing with the use of minimal and maximal values. It's usefull to determine the delay between the peak and a wave change signal.
Low/Med Line width/color - Width/color of drawn line. Separate setting for Low and Medium trend type.
| IMPULS VISUALIZATION |
Impuls - Drawing impuls modes:
H - Hidden
F - First
S - Second
A - Auto
Impuls color - Color of the first bullish arrow.
Draw arrow - Drawing arrow at the end of the first bullish arrow.
Troubleshooting:
In case of any problems, send error details to the author of the script.

WaveTrend 4h/24mWaveTrend 4h/24m is a trading tool based on two WaveTrend timeframes.
For this script the WaveTrend calculations made by LazyBear were used. WaveTrend is a widely used indicator for finding direction of an asset.
The strategy is developed by Youtuber Jayson Casper. The main strategy on the 4 hour and 24 minute timeframes, this will be the default timeframes. Timeframes can be adjusted in the indicator interface.
With Jaysons' we wait for both timeframes to have last printed a green dot for longs, and both timeframes to have last printed a red dot for shorts. When this occurs a green diamond will be printed for longs, a red diamond for shorts.
Make sure to always use the chart from the smallest timeframe you're using, so by defaults use the 24 minute chart.
Features of the indicator:
- WaveTrend Timeframe 1 (Blue/Lightblue wave).
- WaveTrend Timeframe 2 (Blue/Purple line with filled background between the lines).
- VWAP (Yellow wave which is turned off by default)
- Green/Red Diamonds
What to look for?
This script is all about the Green and Red Diamonds.
A Green diamond will be printed when on both the 4 hour and 24 minute timeframe the last printed dot was a green dot.
A Red diamond will be printed when on both the 4 hour and 24 minute timeframe the last printed dot was a red dot.
What are the Green and Red Diamonds based on?
When both VWAP timeframes are ABOVE 0, a green diamond will be printed. This is equivalent to the last dot on both WaveTrend timeframes being a green dot.
When both VWAP timeframes are BELOW 0, a red diamond will be printed. This is equivalent to the last dot on both WaveTrend timeframes being a red dot.
Happy Trading!

Wavetrend Moving Average (WTMA) [Loxx]Wavetrend Moving Average (WTMA) is a Wavetrend indicator morphed into a moving average. Use this indicator as you would any other moving average.
What is the Wavetrend indicator?
Wavetrend's original name was TCI created by the The Trading Center. The TCI (Trading Channel Index) displays the ratio between the average daily price and the smoothed averaged value of the average daily price.
You can read about TCI here: tradingcenter.org
How do you morph Wavetrend into a moving average?
1. Calculate Wavetrend
2. Normalize Wavetrend from a range of -1 to 1 to a range of 0 to 1
3. Find high/low values of X bars back of Wavetrend,
4. Subtract high from low to find the simple range of Wavetrend
5. Calculate upper and lower boundaries
6. Calculate the HL2 of using these new boundaries
Included:
Bar coloring
Signals
Alerts
Loxx's Expanded Source Types

Wave Surge [sma]Overview
Wave Surge is indicator that visualizes market waves through dynamic price oscillations around a moving average baseline. It combines wave analysis with RSI filtering to identify trend strength and potential reversals.
How It Works
Core Calculation
The indicator calculates a wave pattern by:
1. Computing a baseline using the average of highest/lowest prices over the specified period
2. Determining a keltner-style center point between this baseline and price SMA
3. Creating a linear regression of the price deviation from this center
4. Generating an adaptive signal line that responds to crossover events
Visual Components
- **Base MA Line**: A moving average (SMA or EMA) that changes color based on RSI zones
- Cyan overlay: RSI is overbought (default >70)
- Yellow overlay: RSI is oversold (default <30)
- Gray: Neutral RSI zone
- Wave Fill: The dynamic area between the MA and wave level
- Green shades: Bullish momentum (wave > 0)
- Red/Orange shades: Bearish momentum (wave < 0)
- Color intensity indicates wave strength (accelerating vs decelerating)
Key Features
- Wave Intensity Control: Adjustable parameter (0.1-2.0) to control wave amplitude
- MA Type Selection: Choose between SMA or EMA for the baseline
- RSI Integration: Hidden RSI filter adds context to the moving average color
- Adaptive Signal: The signal line dynamically adjusts to crossover events
- Fully Customizable Colors: All visual elements can be customized
Originality Statement
This indicator uses a unique combination of:
- Custom wave calculation based on price deviation from keltner-style center
- Linear regression applied to normalized price distance
- Adaptive signal line that recalculates on wave direction changes
- Multi-layered RSI integration for contextual MA coloring
The wave fill visualization creates a dynamic oscillating band that responds to both momentum strength and direction changes.
For educational purposes only. Not financial advice.

WaveTrend Divergences, Candle Colouring and TP Signal [LuciTech]WaveTrend is a momentum-based oscillator designed to track trend strength, detect divergences, and highlight potential take-profit zones using Bollinger Bands. It provides a clear visualization of market conditions to help traders identify trend shifts and exhaustion points.
The WaveTrend Oscillator consists of a smoothed momentum line (WT Line) and a signal line, which work together to indicate trend direction and possible reversals. When the WT Line crosses above the signal line, it suggests bullish momentum, while crossing below signals bearish momentum.
Candle colouring changes dynamically based on WaveTrend crossovers. If the WT Line crosses above the signal line, candles turn bullish. If the WT Line crosses below the signal line, candles turn bearish. This provides an immediate visual cue for trend direction.
Divergence Detection identifies when price action contradicts the WaveTrend movement.
Bullish Divergence appears when price makes a lower low, but the WT Line forms a higher low, suggesting weakening bearish pressure.
Bearish Divergence appears when price makes a higher high, but the WT Line forms a lower high, indicating weakening bullish pressure.
Plus (+) Divergences are stronger signals that occur when the first pivot of the divergence happens at an extreme level—above +60 for bearish divergence or below -60 for bullish divergence. These levels suggest the market is overbought or oversold, making the divergence more significant.
Bollinger Band Signals highlight potential take-profit zones by detecting when the WT Line moves beyond its upper or lower Bollinger Band.
If the WT Line crosses above the upper band, it signals stretched bullish momentum, suggesting a possible pullback or reversal.
If the WT Line crosses below the lower band, it indicates stretched bearish momentum, warning of a potential bounce.
How It Works
The WaveTrend momentum calculation is based on an EMA-smoothed moving average to filter out noise and provide a more reliable trend indication.
The WT Line (momentum line) fluctuates based on market momentum.
The signal line smooths out the WT Line to help identify trend shifts.
When the WT Line crosses above the signal line, it suggests buying pressure, and when it crosses below, it indicates selling pressure.
Divergences are detected by comparing pivot highs and lows in price with pivot highs and lows in the WT Line.
A pivot forms when a local high or low is confirmed after a certain number of bars.
The indicator tracks whether price action and the WT Line are making opposite movements.
If a divergence occurs and the first pivot was beyond ±60, it is marked as a Plus Divergence, making it a stronger reversal signal.
Bollinger Bands are applied directly to the WT Line instead of price, identifying when the WT Line moves outside its volatility range. This helps traders recognize when momentum is overstretched and a potential reversal or retracement is likely.
Settings
Channel Length (default: 8) controls the period used to calculate the WT Line.
Average Length (default: 16) smooths the WT Line for better trend detection.
Divergences (on/off) enables or disables divergence plotting.
Candle colouring (on/off) applies or removes trend-based candle colour changes.
Bollinger Band Signals (on/off) toggles take-profit signals when the WT Line crosses the bands.
Bullish/Bearish colours allow customization of divergence and signal colours.
Interpretation
The WaveTrend Oscillator helps traders assess market momentum and trend strength.
Crossovers between the WT Line and signal line indicate potential trend reversals.
Divergences warn of weakening momentum and possible reversals, with Plus Divergences acting as stronger signals.
Bollinger Band Crosses highlight areas where momentum is overstretched, signaling potential profit-taking opportunities.

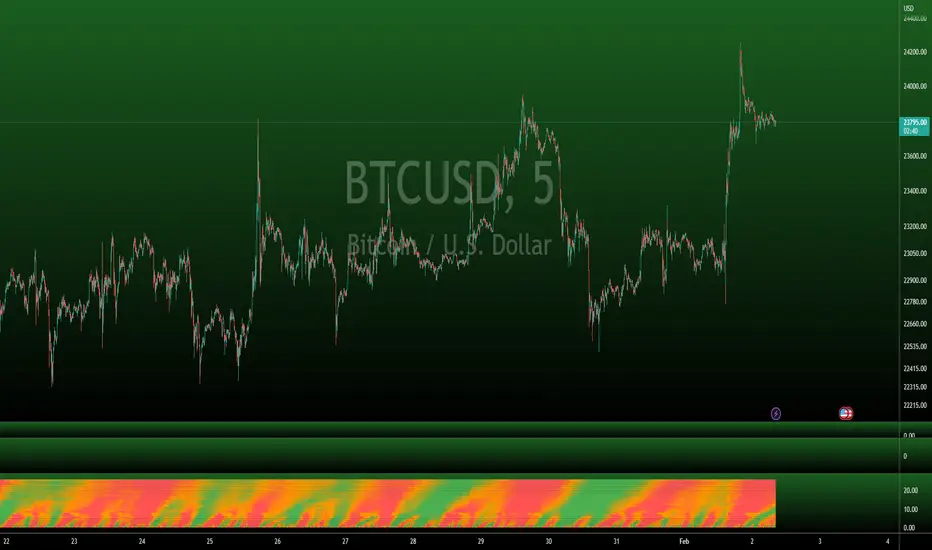
Wave Master ProThis indicator is built on Stochastics and uses multiple timeframes to give you a heatmap style view of where overbought and oversold levels are across 25 different timeframes.
Here's a few things you'll want to watch out for when using this indicator:
OVERBOUGHT
When a wave goes into overbought or is approaching overbought, you'll notice the heatmap transitioning from orange to red. Probably wise to move up stop losses or close the position out, especially when the entire vertical time slot is completely red.
OVERSOLD
Opposite of overbought, when a wave goes into oversold, the heatmap will transition from orange to green. This could be a good place to close out short positions or be on the lookout for long positions. Again, especially when the entire vertical time slot is completely green.
TIMEFRAMES
This indicator is dynamic in that it will automatically adjust the heatmap timefrmaes as you change the timeframe of your chart.
LIMITATIONS
Due to there being so many different timeframes that are utilized in this indicator, you will find that this indicator works best on 1H timeframes or lower, but it will work up to 4H timeframes. Currently, anything above 4H is not optimal for this indicator. I would recommend using the regular Wave Master indicator if you like using high timeframes.
OTHER USEFUL INFORMATION
This is a vidual aid in determining when many timeframes approach and reach extended levels based on the configuration of the Stochastics that we have found to be most optimal, especially in lower timeframes. It is wise to refer back to the Wave Master indicator for a raw view of the waves.
WaveTrend with Crosses [LazyBear]Here we can more clearly see the correlation between the WaveTrend indices

Wave LineWave Line is a chart type obtained by plotting the High and Low values in each time interval according to their sequential order. This method produces a continuous line rather than bars, which is beneficial for analyzing changes within each interval rather than focusing on the price range and open/close values. E.g for Wave Analysis.
How to use:
1. Adjust the interval unit and multiplier for the main timeframe.
2. Ideally, select a lower timeframe on your chart, approximately 5 times smaller than the one specified for the script.
3. Lower Timeframe is the timeframe which will be the scripts reference when the high and low of the main timeframe align on a single bar of the opened chart. This timeframe may also be 5-10 times smaller than the main timeframe. It is important to note that this should not be excessively smaller as the script may fail in retrieving data. An alternative method is included to estimate the order if it is not clear in the fetched data.
4. Set a preferred value for Monowave Length, indicating the number of bars a monowave will cover horizontally. Set the value to be half of the Interval Multiplier for the Wave Line to align with the bar chart. However if the multiplier is an odd number, perfect alignment may not be achieved.
5. Ensure that the product of Max Polyline Segments and Monowave length does not exceed 5000, and adjust the value for Max Polyline Segments accordingly.

Wave Chart v1##Wave Chart v1##
For analyzing Neo-wave theory
Plot the market's highs and lows in real-time order.
Then connect the highs and lows
with a diagonal line. Next, the last plot of one day (or bar) is connected with a straight line to the
first plot of the next day (or bar).
##How To Use##
if you want a weekly chart you drop the time frame to the daily chart.
Then you set the range to 7(if the market opens 7 days per week).
Then you click "highlight the bar that runs to plot" and you must shift the highlight to the last day that the weekly chart bar close(Sunday / Friday)
##Example 1
Weekly chart BTCUSDT on BINANCE
first open daily chart, set range = 7 and Bars_shift = 3 (shift highlight to Sunday)
##Example 2
Weekly chart XAUUSD on FXOPEN
first open daily chart, set range = 5 (market open 5 days per week) and Bars_shift = 1 (shift highlight to Friday)
##Note##
If the market has a special holiday Wave Chart may be inaccurate.

Waves in Price (Volume Waves)Waves in Price (Volume Waves)
TheDowVolumeBigot>0 (Bullish) =Lime color
Very High=Dark Green color
High=Green color
TheDowVolumeBigot<0 (Bearish) =Orange color
Low=Red color
Very Low=Dark Red color
Barcolor

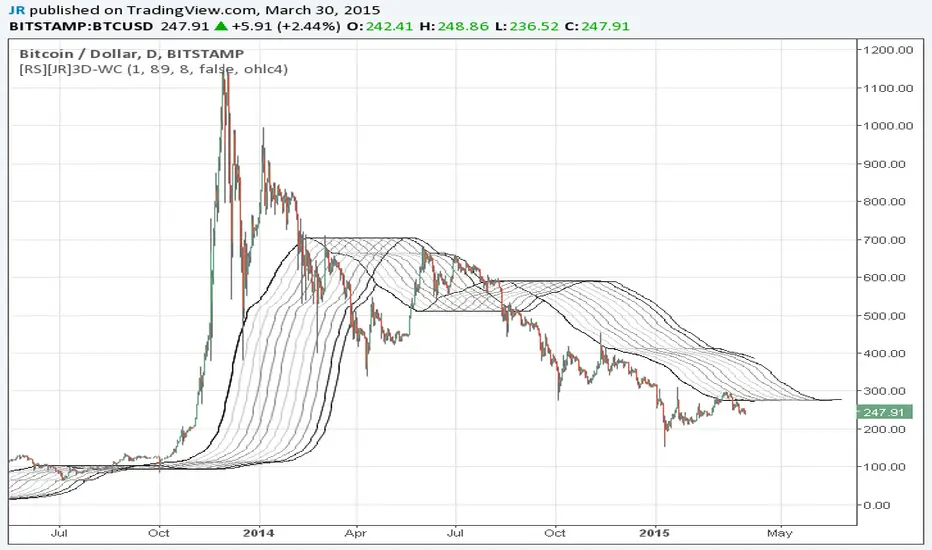
Wave Channel 3D Wave Channel 3D
Built by Ricardo idea from JR & Aloakdutt from indieTrades Jan. 2010
This indicator is very easy to build. We utilize Moving Averages with a set multiplier and an offset. Specially we try to use Fibonacci sequence series numbers (1, 2, 3, 5, 8, 13, 21, 34, 55, 89, 144...) as time space and multiplier (default 89, 8). Also included is Donchian Channel to locate strong trends and possible future support - resistance.
Examples of support/resistance on chart.
Dominant Price Trends
Future Support Resistance
Comparing Fibonacci Series Time Space - Multiplier
When Comparing make note of confluence support/resistance showing up with Fibonacci Series
Example uses DC
When Comparing make note of confluence support/resistance showing up with Fibonacci Series
Example without DC / Smooth MA
Auto 5-Wave Fixed Channel + Wave 5 Top / Wave 2-ABC BottomAuto 5-Wave Fixed Channel + Wave 5 Top / Wave 2-ABC Bottom
by Ron999
1. What this indicator does
This tool automatically hunts for bullish 5-wave impulse structures and then:
Labels the waves: W1, W2, W3, W4, W5
Draws a fixed “acceleration” channel based on the wave structure
Projects a Wave-5 target zone using a 1.618 extension
Marks the Wave-2 level as an ABC correction target
Triggers optional alerts when:
A new Wave-5 top completes
An ABC bottom forms back near the Wave-2 low
It’s designed as a mechanical, rule-based approximation of Elliott 5-wave impulses – built for traders who like the idea of wave structure but want something objective and programmable.
2. How the wave logic works
The script continuously scans for pivot highs and lows using a user-defined Pivot Length.
It only keeps the last 5 alternating pivots (high → low → high → low → high).
When those last 5 pivots form this pattern:
Pivot 1 → High (W1)
Pivot 2 → Low (W2)
Pivot 3 → High (W3)
Pivot 4 → Low (W4)
Pivot 5 → High (W5)
…the indicator treats this as a bullish 5-wave impulse.
When such a structure is detected, it “locks in” the wave prices and bars and draws the channels and labels.
Note: Pivots are only confirmed after Pivot Length bars, so swings are slightly delayed by design (standard pivot logic).
3. Channels & levels
Once a valid bullish 5-wave structure is found, the script builds three key pieces:
a) Base Acceleration Channel (Blue)
Anchored from Wave-2 low toward Wave-3 high.
This forms a rising acceleration channel that represents the impulse leg.
The channel extends to the right, so you can see how price interacts with it after W3–W5.
b) Wave-5 Target Line (Red, dashed)
Uses the height from Wave-2 low to Wave-3 high.
Projects a 1.618 extension of that height above Wave-3.
This line acts as a potential Wave-5 exhaustion zone (take-profit / reversal watch area).
c) Wave-2 / ABC Bottom Level (Green, dotted)
Horizontal line drawn at the Wave-2 low.
This acts as a retest / corrective target for the ABC correction after the impulse completes.
When price later revisits this area (within a tolerance), the script can mark it as a potential ABC bottom.
4. Labels & signals
If labels are enabled:
W1, W2, W3, W4, W5 are plotted directly on their corresponding pivot bars.
When an ABC-style retest is detected near the Wave-2 level, an “ABC” label is printed at that low.
Wave-5 Top Event
Triggered when a new valid bullish 5-wave structure is completed.
The last pivot high in the pattern is flagged as Wave-5.
ABC Bottom Event
After a Wave-5 impulse, the script watches for new low pivots.
If a new low forms within ABC Bottom Proximity (%) of the Wave-2 price, it is treated as an ABC bottom near Wave-2 and marked on the chart.
5. Inputs & customization
Show Fixed Channels
Toggle all channel drawing on/off.
Label Waves
Toggle plotting of W1–W5 and ABC labels.
Alerts: Wave-5 Top & ABC Bottom
Master switch for enabling the script’s alert conditions.
Pivot Length
Controls how “swingy” the detection is.
Smaller values → more frequent, smaller waves
Larger values → fewer, larger structural waves
ABC Bottom Proximity (%)
Allowed percentage distance between the ABC low and the Wave-2 price.
Example: 5% means any ABC low within ±5% of Wave-2 is considered valid.
6. Alerts (how to use them)
The script exposes two alertcondition() events:
Wave-5 Top (Bullish Impulse)
Fires when a new 5-wave bullish structure completes.
Use this to watch for potential exhaustion tops or to tighten stops.
ABC Bottom near Wave-2 Low
Fires when an ABC-style correction prints a low near the Wave-2 level.
Use this to stalk potential end-of-correction entries in the direction of the original impulse.
On TradingView, add an alert to the script and choose the desired condition from the dropdown.
7. How to use it in your trading
This tool is best used as a structural context layer, not a standalone system:
Identify bullish impulsive trends when a Wave-5 structure completes.
Use the Wave-5 target line as a potential area for:
Scaling out
Watching for exhaustion / divergences / reversal patterns
Use the Wave-2/ABC level and ABC Bottom signal:
To look for end of correction entries back in the trend direction
To align with your own confluence (support/resistance, volume, RSI, etc.)
It works well on crypto, FX, indices, and stocks, especially on higher timeframes where structure is cleaner.
8. Limitations & notes
This is a mechanical approximation of Elliott 5-wave theory — it will not match every analyst’s discretionary count.
Pivots are confirmed after Pivot Length bars, so signals are not instant; they’re based on completed swings.
The indicator currently focuses on bullish impulses (upward 5-wave structures).
As always, this is not financial advice. Combine it with your own strategy, risk management, and confirmation tools.
Created & coded by: Ron999
Built for traders who want wave structure + fixed channels, without the subjective Elliott argument on every chart. files.catbox.moe

WavesTrend visualization tool in Wave theory. Unlike Elliot waves, it has a constant pattern length. The formation consists of impulse and 3 corrections.
The script analyzes candle relationships in the currect trend, trend will be continueted until candle are not breaking trend rules.
Currently it supports 2 rulesets/wave variants:
Low - More sensitive (trend will change more ofter).
Meddium - Less sensitive ( trend will change less ofter).
Simultaneous observation of both types allows to detect consolidation before the overlapping movement and increase the probability of indicating the moment of the movement occurrence.
Trend visualization tools is a starting point that can be conected with different technics, to achive better performance.
"Waves" is the primary script of the Waves script series with test free period that consists of:
- Waves + XABCD
- Waves + ZOOnes
- Waves Change Signals
- ... and more in developement.
Features:
- Show Low and Middle type/order waves
- Draw both Wave types at once.
- Shadow mode that show second wave moved to the wave max/min bars.
- "Alfred" assist - Label notifications about trend confirmations or changes.
Script settings:
Trend visualization
Type - Trend visualization types:
H - Hidden
L - Low
M - Medium
B - Both
Alfred - AI assistant that informs about wave confirmation or trend changes (With "Both" type Alfred will monit only Medium wave).
Shadow - Showing second reprezentation of the trend with drawing with the use of minimal and maximal values. It's usefull to determine the delay between the peak and a wave change signal.
Low/Med Line width/color - Width/color of drawn line. Separate setting for Low and Medium trend type.
Impuls visualization
Impuls - Drawing impuls modes:
H - Hidden
F - First
S - Second
A - Auto
Impuls color - Color of the first bullish arrow.
Draw arrow - Drawing arrow at the end of the first bullish arrow.
Extensions
Waves + XABCD - Showing base information about Waves + XABCD script
Waves + ZOOnes - Showing base information about Waves + ZOOnes script
Waves Change Signals - Showing based information about Waves Change Signals script.
more in developement...
Troubleshooting:
In case of any problems, send error details to the author of the script.

Eagle WavesEagle Waves is a precision trend-tracking and wave-reading system designed to help traders spot the real market direction early and stay aligned with momentum.
The indicator focuses on identifying clean waves, spotting trend shifts, and filtering out noise—giving you a clear view of where the market is likely heading next.
Eagle Waves highlights wave strength, trend continuation, exhaustion points, and momentum shifts so you can enter on strong legs and avoid weak or late positions.
What Eagle Waves Gives You
Clear wave visualization to read the market flow easily
Accurate trend direction with high-clarity color transitions
Wave strength indication to avoid weak or fading moves
Momentum confirmation before entering any wave
Reversal and exhaustion alerts when waves lose power
Smooth filters to reduce noise, especially on lower timeframes
Works on all markets: Forex, Crypto, Indices, Metals, and Stocks
Compatible with any strategy: scalping, intraday, or swing
Why Traders Use It
Helps you catch early trend legs
Keeps you out of choppy or uncertain zones
Makes wave reading visual and simple
Improves timing on entries and exits
Summary
Eagle Waves is built to make wave-based trading straightforward:
Clear waves. Clean trends. Better timing.

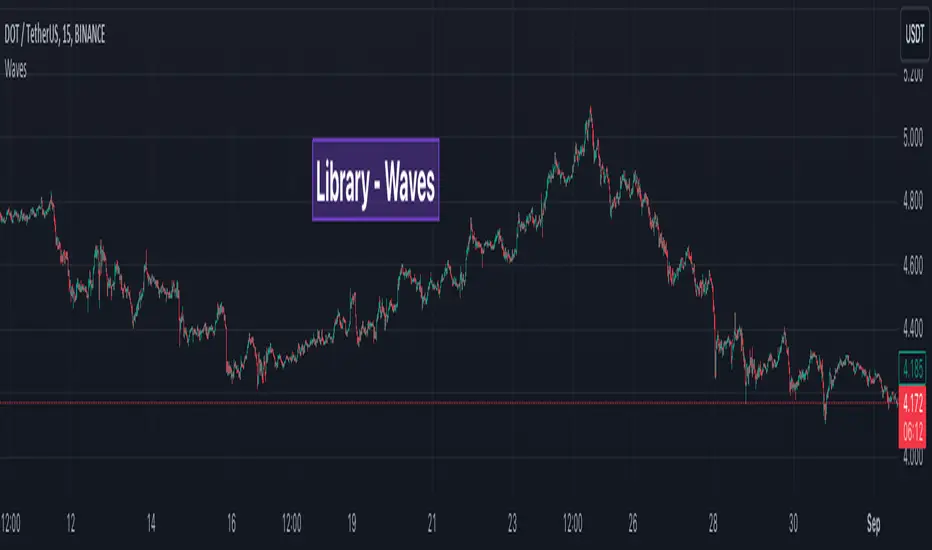
WavesLibrary "Waves"
Methods for elliot wave detection
method delete(this)
deletes the subwave drawing
Namespace types: Subwave
Parameters:
this (Subwave) : Subwave object to be deleted
Returns: deleted subwave object
method delete(this)
deletes the wave drawing and the corresponding subwaves
Namespace types: Wave
Parameters:
this (Wave) : Wave object to be deleted
Returns: deleted wave object
method createWave(pivot, lineColor, waves, limit)
Create wave object
Namespace types: zg.Pivot
Parameters:
pivot (Pivot type from Trendoscope/Zigzag/7) : pivot object where the wave needs to be created
lineColor (color) : color of the wave to be drawn
waves (array) : array of existing waves
limit (int) : max number of waves to be shown in the chart
Returns: wave object created
method createSubWaves(wave, subwavePivots)
Create sub waves for the wave
Namespace types: Wave
Parameters:
wave (Wave)
subwavePivots (array) : array of sub wave pivots
Returns: wave object created
method draw(subWave)
Draw subwave
Namespace types: Subwave
Parameters:
subWave (Subwave)
Returns: subwsubWave object
method draw(wave, limitSubwaves)
Draw Wave
Namespace types: Wave
Parameters:
wave (Wave) : Wave object to be drawn
limitSubwaves (bool) : limit the number of subwave combinations within the wave
Returns: wave object
method checkMotiveWave(prices)
based on the price array, check if there is motive wave and identify the type
Namespace types: array
Parameters:
prices (array) : float array of prices
Returns: WaveType representing the identified wave type. na otherwise
method scanMotiveWave(pivot, lastPivot, existingWaves, allowedTypes)
Scan for motive wave
Namespace types: zg.Pivot
Parameters:
pivot (Pivot type from Trendoscope/Zigzag/7) : Zigzag pivot that will be checked for motive wave
lastPivot (Pivot type from Trendoscope/Zigzag/7) : previous Zigzag pivot
existingWaves (array) : array of existing waves
allowedTypes (array) : allowed Wave types to filter them
Returns: array of subwave pivots
SubwavePivots
SubwavePivots represents the sub pivots of the main wave
Fields:
waveType (series WaveType) : Type of the Wave
indices (array) : Bar index values of sub waves
subPivots (array type from Trendoscope/Zigzag/7) : sub pivot objects of the wave
Subwave
Subwave represents the drawing of sub waves
Fields:
waves (array type from Trendoscope/Drawing/1) : array of sub wave lines
points (array type from Trendoscope/Drawing/1) : Array of subwave pivot labels
subwavePivots (SubwavePivots) : array of subwave pivots being drawn
Wave
Wave object type
Fields:
pivot (Pivot type from Trendoscope/Zigzag/7) : starting point of the wave
wave (Line type from Trendoscope/Drawing/1) : Line representing the wave
waveLabel (Label type from Trendoscope/Drawing/1) : label containing wave details
subWaves (array) : array of sub waves
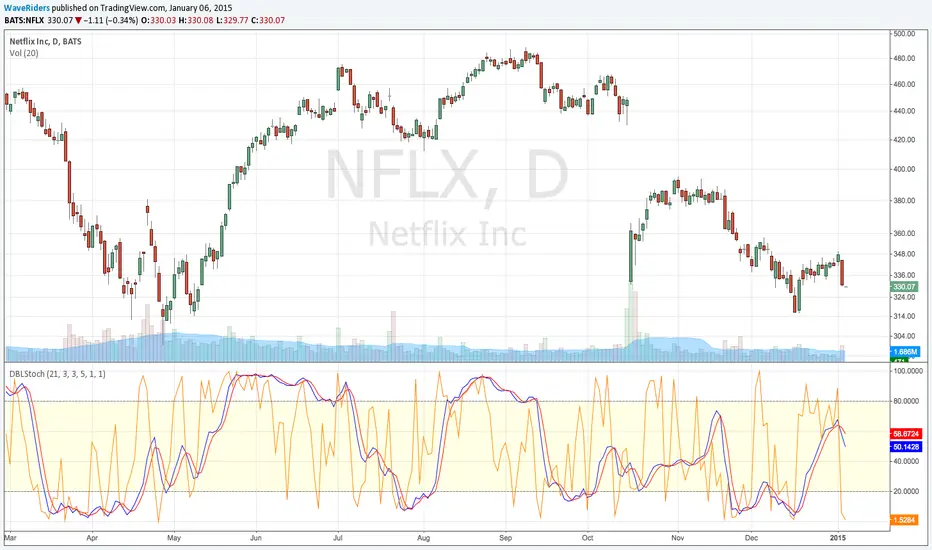
Double StochasticDouble Stochastic is use 2 Stochastic for monitoring price swing.
Slow Stochastic (21,3,3) for monitoring the swing of price cycle.
Fast Stochastic (5,1,1) for monitoring the swing in price ripple.
When 2 Stochastic run way from each other, separately , mean Price will move only retrace or rebound in ripple movement.
When 2 Stochastic Flip and Run break thru from overbought or oversold zone , mean Price will move to change in major direction
Useful for decision to hold position or take action
Such as Price move up and start decline, Slow Stochastic run above 80 and only Fast Stochastic swing down, mean Price just move retrace down. Price still has chance to flip and move up again. This will help we hold the Long Position or know where to open more Long position on price dip.
Or Price break down to support line and start rebound , Slow Stochastic run below 20 and only Fast Stochastic Swing Up , mean Price just move rebound to go down again. This will help we can hold Short Position or know where to open more Short position.
Wave Riders ...
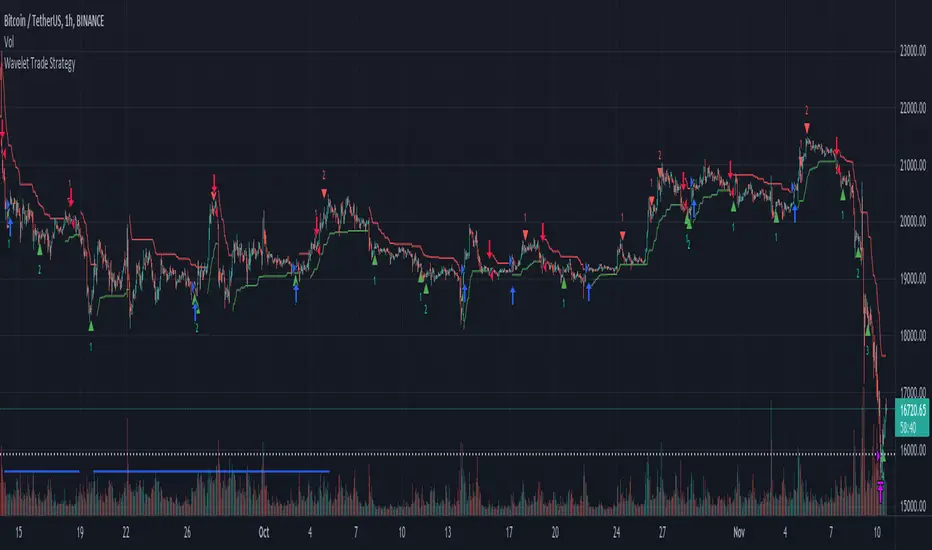
Wavelet Trade StrategyThe strategy was based on Wavelet and Trend to find a small wave trade :
Wavelet Concepts
A wavelet is a wave-like oscillation with an amplitude that begins at zero, increases or decreases, and then returns to zero one or more times. Wavelets are termed a "brief oscillation".
1. A price of wavelets has been established, based on the bar and direction of its pulses.
2. Wavelet uses transforms to decompose the price and time series data.
3. Then, the obtained approximation and detail components after decomposition are used to forecast future prices.
What it does :
In each small wave, find potential high and low. filter by trend to know higher high or lower low and trade by this strategy.
you could not buy the bottom and sell the top every time, but is close in local range by a small wave.
How it does it :
The wavelet can be used to analyze waves in space and reduce noise, while retaining the important components. Whenever the ADX falls below a certain threshold, a bottom blue line will appear. It means the price is into range, otherwise trend.
How to use it :
The recommended time frame is less than 12 hours.
Set parameters to fine tune your strategy.
Use SL/TP as part of your strategy, and change date to find the most weak time.
Default parameter is for BTC fine tune :
The performance overview is from 2021-01-01 to 2022-05-30.
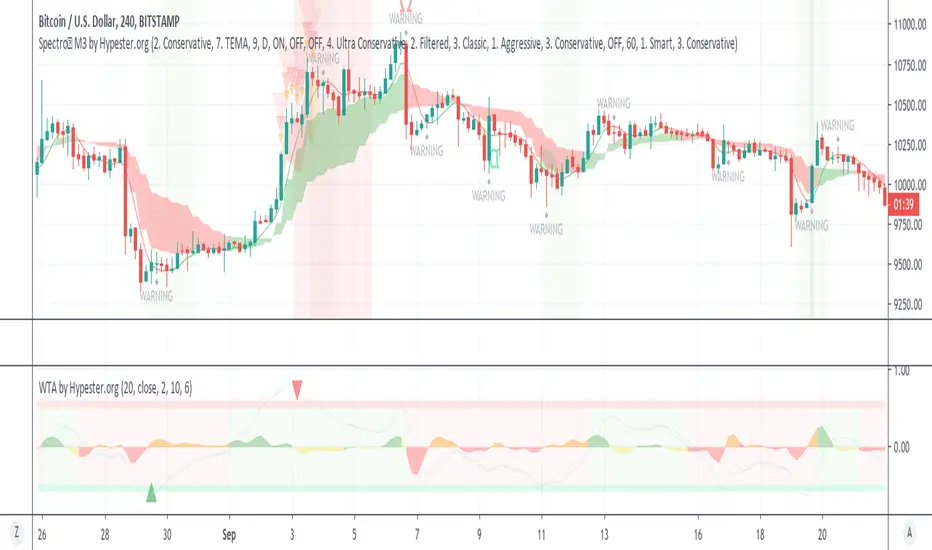
WaveTrend Anomaly by HypesterAs requested by the Alpha community, here's our release.
This is a different type of Wavetrend indicator; here, we have a statistical approach to the waves. We normalize the trends as a reference to measure how much every move differs from the average.
If the move is too far out, it tends to go back to the average as a rule. This indicator yields a %. As you can see, most of the moves tend to stay within 0.5 and -0.5. Remember the fact that 0.5 means 50%, the negative factor here only determines direction.
Funny the fact that most crossings happen within the 0.5 and -0.5, which means they occur before the odds are against them all the time. That highlights the chaotic nature of the markets.
However, the outliers, the moves that extrapolate the 50%, tend to go back to the average quickly, and the big triangles highlight this crossing.
You can also display every single crossing and its direction in the options panel.
There're more customization capabilities in the panel, too, like length, source, and so on.
Now to the background color options, when it's green, we have a confirmed bull movement, and red is a confirmed bear.
The area oscillator is the slope between the fast and slow oscillator lines. Here you can see when the trend is reversing or losing its strength. The orange slope color happens when you have a bearish trend, for instance. The yellow slope happens with a bull trend but a negative momentum. By mixing the colors, you can evaluate if it's strong enough for a full reversal and so on.
This same approach could be handy to spot bottoms and tops.