VWAP Breakout Strategy + EMAs + Clean Cycle/TP/SL PlotsHere’s a quick user-guide to get you up and running with your “VWAP Breakout Strategy + EMAs + Clean Cycle/TP/SL Plots” script in TradingView:
⸻
1. Installing the Script
1. Open TradingView, go to Pine Editor (bottom panel).
2. Paste in your full Pine-v6 code and hit Add to chart.
3. Save it (“Save as…”): give it a memorable name (e.g. “VWAP Breakout+EMAs”).
⸻
2. Configuring Your Inputs
Once it’s on the chart, click the ⚙️ Settings icon to tune:
Setting Default What it does
ATR Length 14 Period for average true range (volatility measure)
ATR Multiplier for Stop 1.5 How many ATRs away your stop-loss sits
TP1 / TP2 Multipliers (ATR) 1.0 / 2.0 Distance of TP1 and TP2 in ATR multiples
Show VWAP / EMAs On Toggles the blue VWAP line & EMAs (100/34/5)
Full Cycle Range Points 200 Height of the shaded “cycle zone”
Pivot Lookback 5 How many bars back to detect a pivot low
Round Number Step 500 Spacing of your dotted horizontal lines
Show TP/SL Labels On Toggles all the “ENTRY”, “TP1”, “TP2”, “STOP” tags
Feel free to adjust ATR multipliers and cycle-zone size based on the instrument’s typical range.
⸻
3. Reading the Signals
• Long Entry:
• Trigger: price crosses above VWAP
• You’ll see a green “Buy” tag at the low of the signal bar, plus an “ENTRY (Long)” label at the close.
• Stop is plotted as a red dashed line below (ATR × 1.5), and TP1/TP2 as teal and purple lines above.
• Short Entry:
• Trigger: price crosses below VWAP
• A red “Sell” tag appears at the high, with “ENTRY (Short)” at the close.
• Stop is the green line above; TP1/TP2 are dashed teal/purple lines below.
⸻
4. Full Cycle Zone
Whenever a new pivot low is detected (using your Pivot Lookback), the script deletes the old box and draws a shaded yellow rectangle from that low up by “Full Cycle Range Points.”
• Use this to visualize the “maximum expected swing” from your pivot.
• You can quickly see whether price is still traveling within a normal cycle or has overstretched.
⸻
5. Round-Number Levels
With Show Round Number Levels enabled, you’ll always get horizontal dotted lines at the nearest multiples of your “Round Number Step” (e.g. every 500 points).
• These often act as psychological support/resistance.
• Handy to see confluence with VWAP or cycle-zone edges.
⸻
6. Tips & Best-Practices
• Timeframes: Apply on any intraday chart (5 min, 15 min, H1…), but match your ATR length & cycle-points to the timeframe’s typical range.
• Backtest first: Use the Strategy Tester tab to review performance, tweak ATR multipliers or cycle size, then optimize.
• Combine with context: Don’t trade VWAP breakouts blindly—look for confluence (e.g. support/resistance zones, higher-timeframe trend).
• Label clutter: If too many labels build up, you can toggle Show TP/SL Labels off and rely just on the lines.
⸻
That’s it! Once you’ve added it to your chart and dialed in the inputs, your entries, exits, cycle ranges, and key levels will all be plotted automatically. Feel free to experiment with the ATR multipliers and cycle-zone size until it fits your instrument’s personality. Happy trading!
Komut dosyalarını "vwap" için ara

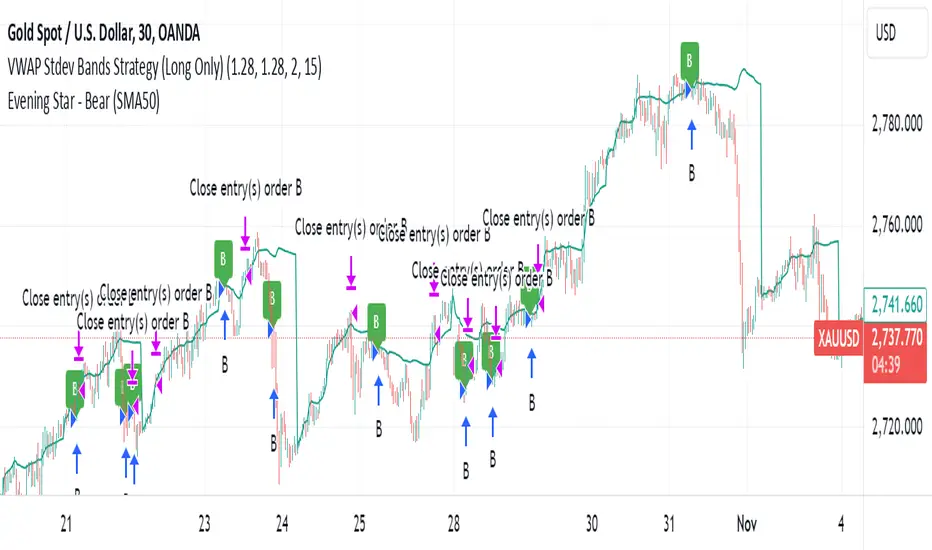
VWAP Stdev Bands Strategy (Long Only)The VWAP Stdev Bands Strategy (Long Only) is designed to identify potential long entry points in trending markets by utilizing the Volume Weighted Average Price (VWAP) and standard deviation bands. This strategy focuses on capturing upward price movements, leveraging statistical measures to determine optimal buy conditions.
Key Features:
VWAP Calculation: The strategy calculates the VWAP, which represents the average price a security has traded at throughout the day, weighted by volume. This is an essential indicator for determining the overall market trend.
Standard Deviation Bands: Two bands are created above and below the VWAP, calculated using specified standard deviations. These bands act as dynamic support and resistance levels, providing insight into price volatility and potential reversal points.
Trading Logic:
Long Entry Condition: A long position is triggered when the price crosses below the lower standard deviation band and then closes above it, signaling a potential price reversal to the upside.
Profit Target: The strategy allows users to set a predefined profit target, closing the long position once the specified target is reached.
Time Gap Between Orders: A customizable time gap can be specified to prevent multiple orders from being placed in quick succession, allowing for a more controlled trading approach.
Visualization: The VWAP and standard deviation bands are plotted on the chart with distinct colors, enabling traders to visually assess market conditions. The strategy also provides optional plotting of the previous day's VWAP for added context.
Use Cases:
Ideal for traders looking to engage in long-only positions within trending markets.
Suitable for intraday trading strategies or longer-term approaches based on market volatility.
Customization Options:
Users can adjust the standard deviation values, profit target, and time gap to tailor the strategy to their specific trading style and market conditions.
Note: As with any trading strategy, it is important to conduct thorough backtesting and analysis before live trading. Market conditions can change, and past performance does not guarantee future results.
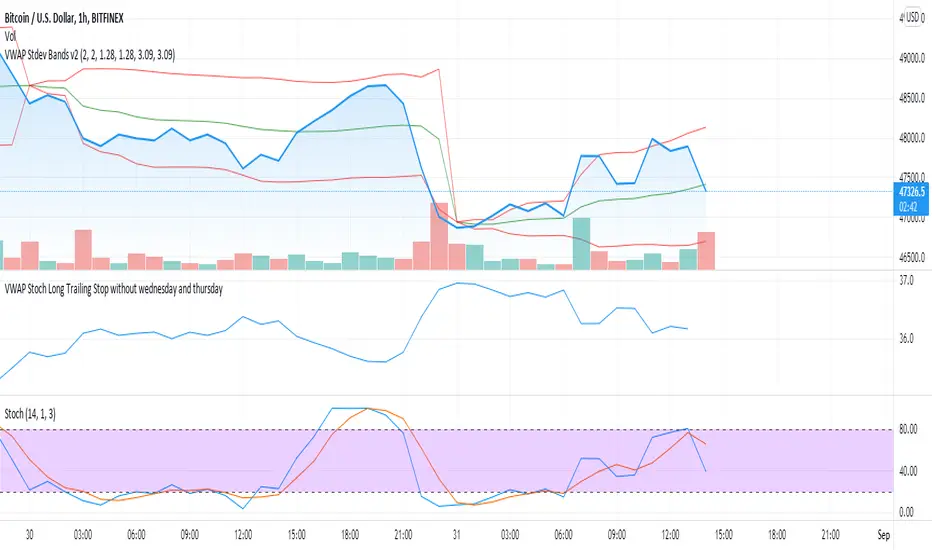
VWAP Stoch Long Trailing Stop without wednesday and thursdaySimple trading strategy based on VWAP and Stochastic indicators and a 3% trailing stop.
After backtesting, wednesdays and thursdays seemed to be bad entry days so they are blacklisted.
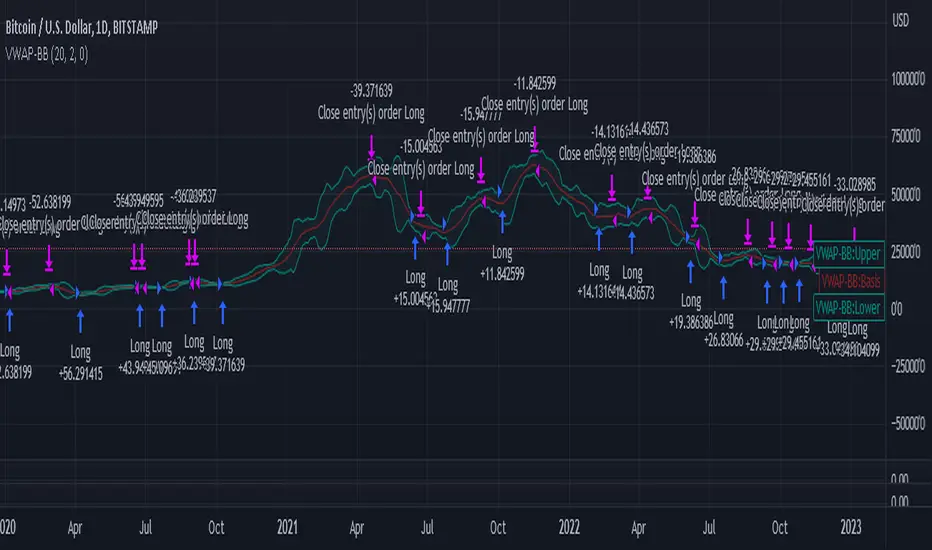
VWAP-Bollinger BandsThis script uses Bollinger bands but with a VWAP as the source, it uses the high crossing the upper band as a buy signal and a low crossing the lower band as a sell signal
Its default settings are for a day chart - Crypto 30 periods, forex 24 periods and stocks 20 periods, which basically line up with a month per asset class
ive seen good results in crypto and stocks, settings used between1% and 10% equity per trade with a 0.1% fee which lines up with Binance fee structure and $25 per trade which lines up with Commsec on the ASX
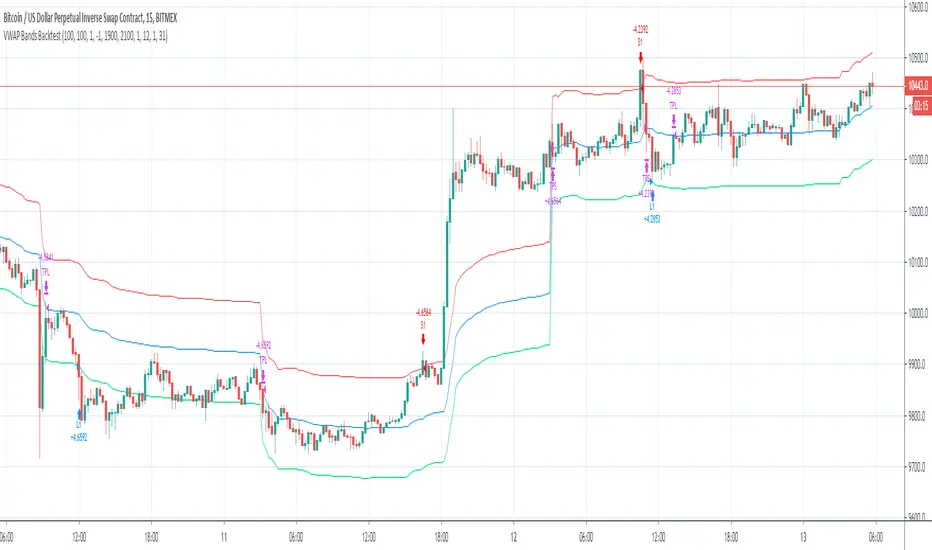
VWAP Bands BacktestThis is a backtest for evaluating the profitability of a vwap offsets strategy over time.
I took part of the code to create the script from Noro
So there is a link for its code
vwap-ma-strategy-v0.7This strategy was inspired by my Israeli fellow iAtiya.
I love it because it's my first pine v3 script that actually works.
Powerful with respect to it's simplicity.
Stock trending strategy This is a long only strategy designed maily for stock markets and futures. In general it works best with 1h, however it can be optimized with other timeframes as well.
Components:
VWAP
MACD histogram
EMA 9
Rules for entry
Long :
For VWAP: close is above the vwap daily
EMA: close is above the moving average
MACD histogram is above 0
Short:
For VWAP: close is belowthe vwap daily
EMA: close is below the moving average
MACD histogram is below 0
Rules for exit
This strategy does not have any risk management inside. Instead it exits whenver it receives an opposite signal form the original one used for entry.
If you have any questions let me know !

LUX CLARA - EMA + VWAP (No ATR Filter) - v6EMA STRAT SHOUT OUTOUTLIERSSSSS
Overview:
an intraday strategy built around two core principles:
Trend Confirmation using the 50 EMA (Exponential Moving Average) in relation to the VWAP (Volume-Weighted Average Price).
Entry Signals triggered by the 8 EMA crossing the 50 EMA in the direction of that confirmed trend.
Key Logic:
Bullish Trend if the 50 EMA is above VWAP. Only long entries are allowed when the 8 EMA crosses above the 50 EMA during that bullish phase.
Bearish Trend if the 50 EMA is below VWAP. Only short entries are allowed when the 8 EMA crosses below the 50 EMA during that bearish phase.
Intraday Focus: Trades are restricted to a user-defined session window (default 7:30 AM–11:30 AM), aligning entries/exits with peak intraday liquidity.
Exit Rule: Positions close automatically when the 8 EMA crosses back in the opposite direction of the entry.
Why It Works:
EMA + VWAP helps detect both immediate momentum (EMAs) and overall institutional bias (VWAP).
By confining trades to a set intraday window, the strategy aims to capture morning volatility while avoiding choppy afternoon or overnight sessions.
Customization:
Users can adjust EMA lengths, session times, or incorporate stops/targets for additional risk management.
It can be tested on various symbols and intraday timeframes to gauge performance and robustness.

Liquid Pulse Liquid Pulse by Dskyz (DAFE) Trading Systems
Liquid Pulse is a trading algo built by Dskyz (DAFE) Trading Systems for futures markets like NQ1!, designed to snag high-probability trades with tight risk control. it fuses a confluence system—VWAP, MACD, ADX, volume, and liquidity sweeps—with a trade scoring setup, daily limits, and VIX pauses to dodge wild volatility. visuals include simple signals, VWAP bands, and a dashboard with stats.
Core Components for Liquid Pulse
Volume Sensitivity (volumeSensitivity) controls how much volume spikes matter for entries. options: 'Low', 'Medium', 'High' default: 'High' (catches small spikes, good for active markets) tweak it: 'Low' for calm markets, 'High' for chaos.
MACD Speed (macdSpeed) sets the MACD’s pace for momentum. options: 'Fast', 'Medium', 'Slow' default: 'Medium' (solid balance) tweak it: 'Fast' for scalping, 'Slow' for swings.
Daily Trade Limit (dailyTradeLimit) caps trades per day to keep risk in check. range: 1 to 30 default: 20 tweak it: 5-10 for safety, 20-30 for action.
Number of Contracts (numContracts) sets position size. range: 1 to 20 default: 4 tweak it: up for big accounts, down for small.
VIX Pause Level (vixPauseLevel) stops trading if VIX gets too hot. range: 10 to 80 default: 39.0 tweak it: 30 to avoid volatility, 50 to ride it.
Min Confluence Conditions (minConditions) sets how many signals must align. range: 1 to 5 default: 2 tweak it: 3-4 for strict, 1-2 for more trades.
Min Trade Score (Longs/Shorts) (minTradeScoreLongs/minTradeScoreShorts) filters trade quality. longs range: 0 to 100 default: 73 shorts range: 0 to 100 default: 75 tweak it: 80-90 for quality, 60-70 for volume.
Liquidity Sweep Strength (sweepStrength) gauges breakouts. range: 0.1 to 1.0 default: 0.5 tweak it: 0.7-1.0 for strong moves, 0.3-0.5 for small.
ADX Trend Threshold (adxTrendThreshold) confirms trends. range: 10 to 100 default: 41 tweak it: 40-50 for trends, 30-35 for weak ones.
ADX Chop Threshold (adxChopThreshold) avoids chop. range: 5 to 50 default: 20 tweak it: 15-20 to dodge chop, 25-30 to loosen.
VWAP Timeframe (vwapTimeframe) sets VWAP period. options: '15', '30', '60', '240', 'D' default: '60' (1-hour) tweak it: 60 for day, 240 for swing, D for long.
Take Profit Ticks (Longs/Shorts) (takeProfitTicksLongs/takeProfitTicksShorts) sets profit targets. longs range: 5 to 100 default: 25.0 shorts range: 5 to 100 default: 20.0 tweak it: 30-50 for trends, 10-20 for chop.
Max Profit Ticks (maxProfitTicks) caps max gain. range: 10 to 200 default: 60.0 tweak it: 80-100 for big moves, 40-60 for tight.
Min Profit Ticks to Trail (minProfitTicksTrail) triggers trailing. range: 1 to 50 default: 7.0 tweak it: 10-15 for big gains, 5-7 for quick locks.
Trailing Stop Ticks (trailTicks) sets trail distance. range: 1 to 50 default: 5.0 tweak it: 8-10 for room, 3-5 for fast locks.
Trailing Offset Ticks (trailOffsetTicks) sets trail offset. range: 1 to 20 default: 2.0 tweak it: 1-2 for tight, 5-10 for loose.
ATR Period (atrPeriod) measures volatility. range: 5 to 50 default: 9 tweak it: 14-20 for smooth, 5-9 for reactive.
Hardcoded Settings volLookback: 30 ('Low'), 20 ('Medium'), 11 ('High') volThreshold: 1.5 ('Low'), 1.8 ('Medium'), 2 ('High') swingLen: 5
Execution Logic Overview trades trigger when confluence conditions align, entering long or short with set position sizes. exits use dynamic take-profits, trailing stops after a profit threshold, hard stops via ATR, and a time stop after 100 bars.
Features Multi-Signal Confluence: needs VWAP, MACD, volume, sweeps, and ADX to line up.
Risk Control: ATR-based stops (capped 15 ticks), take-profits (scaled by volatility), and trails.
Market Filters: VIX pause, ADX trend/chop checks, volatility gates. Dashboard: shows scores, VIX, ADX, P/L, win %, streak.
Visuals Simple signals (green up triangles for longs, red down for shorts) and VWAP bands with glow. info table (bottom right) with MACD momentum. dashboard (top right) with stats.
Chart and Backtest:
NQ1! futures, 5-minute chart. works best in trending, volatile conditions. tweak inputs for other markets—test thoroughly.
Backtesting: NQ1! Frame: Jan 19, 2025, 09:00 — May 02, 2025, 16:00 Slippage: 3 Commission: $4.60
Fee Typical Range (per side, per contract)
CME Exchange $1.14 – $1.20
Clearing $0.10 – $0.30
NFA Regulatory $0.02
Firm/Broker Commis. $0.25 – $0.80 (retail prop)
TOTAL $1.60 – $2.30 per side
Round Turn: (enter+exit) = $3.20 – $4.60 per contract
Disclaimer this is for education only. past results don’t predict future wins. trading’s risky—only use money you can lose. backtest and validate before going live. (expect moderators to nitpick some random chart symbol rule—i’ll fix and repost if they pull it.)
About the Author Dskyz (DAFE) Trading Systems crafts killer trading algos. Liquid Pulse is pure research and grit, built for smart, bold trading. Use it with discipline. Use it with clarity. Trade smarter. I’ll keep dropping badass strategies ‘til i build a brand or someone signs me up.
2025 Created by Dskyz, powered by DAFE Trading Systems. Trade smart, trade bold.

HYE Combo Market [Strategy] (Vwap Mean Reversion + Trend Hunter)In this strategy, I used a combination of trend hunter and vwap mean reversion strategies that I published before.
Trend Hunter Strategy:
Mean Reversion Vwap Strategy:
The results are quite impressive, especially for bitcoin.
While the hodl return for bitcoin was 13419%, the strategy's return in the same period was about 5 times (65000%) of this.
s3.tradingview.com
In this combo strategy, I made some changes to the original settings of the strategies used together and added some more new features.
Trend Hunter Strategy Settings: (Original / Combo)
- Slow Tenkansen Period : 9 / 9
- Slow Kijunsen Period : 26 / 13
- Fast Tenkansen Period : 5 / 3
- Fast Kijunsen Period : 13 / 7
- BB Length : 20 / 20
- BB Stdev : 2 / 2
- TSV Length : 13 / 20
- TSV Ema Length : 7 / 7
* I also added a "vidya moving average" to be used as a confirmation tool to open a long position. (Candle close must be above the vidya line.)
Vwap Mean Reversion Strategy Settings: (Original / Combo)
- Small Vwap : 2 / 8
- Big Vwap : 5 / 10
- Percent Below to Buy : 3 / 2
- RSI Period : 2 / 2
- RSI Ema Period : 5 / 5
- Maximum RSI Level for Buy : 30
* I also added a "mean vwap line" to be used for exits in this part of the strategy. In the original version, when small vwap crossovers big vwap, we close the position, but in this strategy we will wait for the close above the mean vwap.
TIPS AND WARNINGS
1-) The standard settings of this combo strategy is designed and tested with daily timeframe. For lower timeframes, you should change the strategy settings and find the best value for yourself.
2-) Only the mean vwap line is displayed on the graph. For a detailed view, you can delete the "//" marks from the plot codes in the strategy code.
3-) This is a strategy for educational and experimental purposes. It cannot be considered as investment advice. You should be careful and make your own risk assessment when opening real market trades using this strategy.
________________________________________________________
Bu stratejide, daha önce yayınladığım trend avcısı ve vwap ortalamaya geri dönüş stratejilerinin bir kombinasyonunu kullandım.
Sonuçlar özellikle bitcoin için oldukça etkileyici.
Bitcoin için hodl getirisi %13419 iken, stratejinin aynı dönemdeki getirisi bunun yaklaşık 5 katı (%65000) idi.
Bu kombo stratejide, birlikte kullanılan stratejilerin orijinal ayarlarında bazı değişiklikler yaptım ve bazı yeni özellikler ekledim.
Trend Avcısı Strateji Ayarları: (Orijinal / Combo)
- Yavaş Tenkansen Periyodu : 9 / 9
- Yavaş Kijunsen Periyodu : 26 / 13
- Hızlı Tenkansen Periyodu : 5 / 3
- Hızlı Kijunsen Periyodu : 13 / 7
- BB Uzunluğu : 20 / 20
- BB Standart Sapması : 2 / 2
- TSV Uzunluğu : 13 / 20
- TSV Ema Uzunluğu : 7 / 7
* Ayrıca long pozisyon açmak için onay aracı olarak kullanılmak üzere "vidya hareketli ortalama" ekledim. (Mum kapanışı vidya çizgisinin üzerinde olmalıdır.)
Vwap Ortalamaya Dönüş Stratejisi Ayarları: (Orijinal / Combo)
- Küçük Vwap : 2 / 8
- Büyük Vwap : 5 / 10
- Alış İçin Gerekli Fark Oranı : 3 / 2
- RSI Periyodu : 2 / 2
- RSI Ema Periyodu: 5 / 5
- Alış için gerekli maksimum RSI seviyesi : 30
* Stratejinin bu bölümünde pozisyondan çıkışlar için kullanılacak bir "ortalama vwap çizgisi" de ekledim. Orijinal versiyonda, küçük vwap, büyük vwap'ı yukarı kestiğinde pozisyonu kapatıyoruz, ancak bu stratejide, ortalama vwap'ın üzerindeki kapanışı bekleyeceğiz.
İPUÇLARI VE UYARILAR
1-) Bu birleşik stratejinin standart ayarları, günlük zaman dilimi ile tasarlanmış ve test edilmiştir. Daha düşük zaman dilimleri için strateji ayarlarını değiştirmeli ve kendiniz için en iyi değeri bulmalısınız.
2-) Grafikte sadece ortalama vwap çizgisi görüntülenir. Ayrıntılı bir görünüm için strateji kodundaki "plot" ile başlayan satırlarda grafikte görünmesini istediğiniz özelliğin önündeki "//" işaretlerini silebilirsiniz.
3-) Eğitim ve deneysel amaçlı bir stratejidir. Yatırım tavsiyesi olarak değerlendirilemez. Bu stratejiyi kullanarak gerçek piyasa işlem açarken dikkatli olmalı ve kendi risk değerlendirmenizi yapmalısınız.

Volatility Stop with Vwap StrategyFirst the credits goes to @TradingView for their release of the volatility stop mtf indicator.
I have took it, and inside I have added a weekly vwap for a better trend direction and at the same time I have added a dynamic risk managment which is calculated from the distance between the volatility line to the close of the candle.
The rules for entry are simple:
For long:We enter when our close of the candle is above the volatility stop line and at the same time the close of the candle is above weekly vwap
For short we enter when our close of the candle is below the volatility stop line and at the same time the close of the candle is below weekly vwap.
We exit when we either have a reverse signal than the one we enterred, or based on the TP/SL which is calculated with the distance from vwap to the close of the candle.
If you have any questions please let me know !

BabyShark VWAP Strategy What the code does:
This Pine Script implements a trading strategy based on two indicators: Volume Weighted Average Price (VWAP) and On Balance Volume (OBV) Relative Strength Index (RSI). The strategy aims to identify potential buy and sell signals based on deviations from VWAP and OBV RSI crossing certain threshold levels.
How it does it:
**VWAP Calculation**: The script calculates the VWAP using either standard deviation or average deviation over a specified length. It then plots the VWAP and its upper and lower deviation bands.
**OBV RSI Calculation**: It computes the OBV and then calculates the RSI using the cumulative changes in OBV. The RSI is plotted and compared against predefined levels.
**Table Visibility and Occurrence Counting**: It allows the user to display a table showing the number of occurrences where the price is above Upper Dev 2, below Lower Dev 2, crosses above a higher RSI level, or crosses below a lower RSI level.
**Entries**: Long and short entry conditions are defined based on the position of the price relative to the VWAP deviation bands and the color of the OBV RSI. Entries are made when specific conditions are met, and there hasn't been a recent entry.
**Exit Conditions**: The script includes stop-loss and take-profit mechanisms. It exits positions based on price crossing the VWAP or a certain percentage, and it prevents further trading after a certain number of consecutive losses.
What traders can use it for:
**Trend Identification**: Traders can use the VWAP and its deviation bands to identify potential trend reversals or continuations.
**Volume Confirmation**: The inclusion of OBV RSI provides confirmation of price movements based on volume changes.
**Entry and Exit Signals**: The script generates buy and sell signals based on the specified conditions, allowing traders to enter and exit positions with defined stop-loss and take-profit levels.
**Statistical Analysis**: The visibility of occurrence counts in the table allows traders to perform statistical analysis on the frequency of price movements relative to the VWAP and OBV RSI levels.

RSI of VWAP [SHORT selling]This is SHORT selling version of RSIofVWAP strategy. Settings and Logic are totally different from LONG side version , hence I am publishing it as a new strategy.
Settings
============
VWAP of RSI Length 15
Slow EMA Length 200
Short entry level 25
Cover short level 70
stop loss 5
SHORT Entry
============
condition1 : When RSIofVWAP crossdown below 25 and VWAP is below ema200
condition2: When weekly RSIofVWAP crossdown 70 and VWAP (note : session vwap , not weekly vwap) is below ema200
condition3: Use VIX value , if you want to short when the price is above ema200
vwap RSI crossing down 70 and VIX RSI is cossing up 70
enter short ... This is like falling knife :-)
I need to add the code -- later
if any of above condition is TRUE , SHORT entry will be taken
Take Profit
============
When close less than short entry price and RSIofVWAp is crossing up 25 , take profit ...close 1/3 of the position
Exit
============
When RSIofVWAP crossing up 70 level
Stop Loss
============
Stop Loss is set to 5%
Note:
1. When strategy is in SHORT position , background and bar color changes to gray
2. When strategy is already in short position , possible entries are shown in yellow background
3. RSI Length 15 is working most of the equities on hourly chart. ( RSI length 9 and 14 also works good , but not for all ... You may want to try which setting works for your symbol)
4. weekly VWAP (blue color) is also plotted by default ... you can disable it if you dont want to see it. But there is advantage keeping it on the chart , you can notice whenever weekly VWAP crosses above 70 line , trend is UP ... if you have LONG position you can hold on it ... Hurray :-)
Warning
============
For the educational purposes only

QuickSilver Intraday using RSIThis is a simple intraday strategy using very basic intraday super indicators - RSI & VWAP for working on Stocks . You can modify the values on the stock and see what are your best picks. Comment below if you found something with good returns
Strategy:
Indicators used :
The Relative Strength Index (RSI) is one of the most popular and widely used momentum oscillators.The values of the RSI oscillator, typically measured over a 14-day period, fluctuate between zero and 100. The Relative Strength Index indicates oversold market conditions when below 30 and overbought market conditions when above 70
VWAP identifies the true average price of a stock by factoring the volume of transactions at a specific price point and not based on the closing price. VWAP can add more value than your standard 10, 50, or 200 moving average indicators because VWAP reacts to price movements based on the volume during a given period.
Buying happens at VWAP Breakouts which is then validated with RSI to check for overbought & oversold conditions.
Aggressive trade stop can be employed by using the % for long and shorts in the strategy.
Usage & Best setting :
Choose a good volatile stock and a time frame - 10m.
RSI : 9
Overbought & Oversold - can be varied as per user
There is stop loss and take profit that can be used to optimise your trade
Extending this to,
In general guidelines for RSI :
Short-term intraday traders (day trading) often use lower settings with periods in the range of 9-11.
Medium-term swing traders frequently use the default period setting of 14.
Longer-term position traders often set it at a higher period, in the range of 20-30.
The template also includes daily square off based on your time.

BBofVWAP with entry at Pivot PointThis strategy uses BB of VWAP and Pivot point to enter and exit the Long position.
settings
BB length 50
BB Source VWAP
Entry
When VWAP crossing up BB midline and price/close is above weekly PivotPoint ( you can also use Daily pivot point )
Exit
When VWAP is crossing down BB lower band
Stop Loss
Stop loss defaulted to 5%
Note : Long will position will be exited on either VWAP crossing down BB lower band or stop loss is hit - whichever comes first . Being said that some time your stop loss exit is less than 5% which saves from more losses.
Entry is based on weekly Pivot point , so any time frame below weekly will work perfect. I have tested t on 30 min , 1 HR , 4 Hr , Daily charts. Even weekly setting shows good results , that will work for long term investing style.
if you change Pivot period to Daily , chose time frames below Daily.
I also noticed this strategy mostly do not enter Long position in a down trend. Even it finds one , it will be exited with minimal loss.
Warning
For the use of educational purposes only

RSI-VWAPBacktest script based on the previous RSI-VWAP indicator:
It's the popular RSI indicator with VWAP as a source instead of close:
- RSI_VWAP = rsi(vwap(close), RSI_VWAP_length)
What is the Volume Weighted Average Price ( VWAP )?
VWAP is calculated by adding up the dollars traded for every transaction (price multiplied by the number of shares traded) and then dividing by the total shares traded.
Trades are laddered to improve the average entry price and each entry is increased, improving the entry but increasing the risk of being liquidated.
It can be easily converted to study (alerts)
Settings for BINANCE:BTCUSDT at 30m

Full Swing Gold Vwap Macd SMO StrategyThis is a full strategy designed for gold market using 12h timeframe chart.
Its components are:
VWAP monthly
SMO oscillator
MACD histogram
Rules for entry:
For long: when enter when close of the candle is above vwap monthly, current histogram is higher than the previous one and SMO oscillator is above 0
For long: when enter when close of the candle is below vwap monthly, current histogram is lower than the previous one and SMO oscillator is below 0
Rules for exit:
We exit the trade if we get a reverse condition.
We also exit the trade based on a risk management system, both for SL and TP using % movements.
If you have any questions let me know !

RSI of VWAPThis strategy inputs the vwap as source to RSI indicator.
ENTRY
When RSIofVwap crossover 70 and price is above ema200
partial exits
when RSIofVwap reaches 90 level take a portion of profit
Exit
When RSIofVwap crossdown 30
stoploss
defaulated to 5%
Risk Level
Defaulted to 10%. Based on this startegy calcuclates hiw many units can be purchased adhering to stoploss value
Note: code doesnt draw the RSI (vwap) indicator to the chart. if you want to see how these signals are generated , you can select RSI and VWAP of 14 period length.
warning
For educational purposes only

RSI-VWAP INDICATORThis simple indicator provides great results.
It is the popular RSI indicator with VWAP as a source instead of close.
What is the Volume Weighted Average Price (VWAP)?
VWAP is calculated by adding up the dollars traded for every transaction (price multiplied by the number of shares traded) and then dividing by the total shares traded. That is, volume.
On the Backtest, trades are laddered to improve the average entrance price.

ORB 5M + VWAP + Braid Filter + TP 2R o Niveles PreviosORB 5-Minute Breakout Strategy Summary
Strategy Name:
ORB 5M + VWAP + Braid Filter + TP 2R or Previous Levels
Timeframe:
5-minute chart
Trading Window:
9:35 AM to 11:00 AM (New York time)
✅ Entry Conditions:
Opening Range: Defined from 9:30 to 9:35 AM (first 5-minute candle).
Breakout Entry:
Long trade: Price breaks above the opening range high.
Short trade: Price breaks below the opening range low.
Confirmation Filters (All must be met):
Strong candle (green for long, red for short).
VWAP in the direction of the trade.
Braid Filter by Mango2Juice supports the breakout direction (green for long, red for short).
📉 Stop Loss:
Placed at the opposite side of the opening range.
🎯 Take Profit (TP):
+2R (Risk-to-Reward Ratio of 2:1),
or
Closest of the following: previous day’s high/low or premarket levels.
⚙️ Additional Rules:
Only valid signals between 9:35 and 11:00 AM.
Only one trade per breakout direction per day.
Filter out "trap candles" (very small or indecisive candles).
Avoid trading after 11:00 AM.
📊 Performance Goals:
Maintain a high Profit Factor (above 3 ideally).
Focus on tickers with good historical performance under this strategy (e.g., AMZN, PLTR, CVNA).

RSI-VWAP Indicator %█ OVERALL
Simple and effective script that, as you already know, uses vwap as source of the rsi, and with good results as long as the market has no long-term downtrend.
RsiVwap = rsi (vwap (close), Length)
The default settings are for BTC in a 30 minute time frame. For other pairs and time frames you just have to play with the settings.
█ FEATURES
• The option to start trading from a certain date has been added.
• To make the profit more progressive, a percentage of your equity is used for entries and a percentage of your position is used for closings.
• The option to trade in Spot mode has been added, since, for the TradingView backtest, the money is infinite and if you do not limit it somehow,
it would offer you much better profits than the live trading.
QuantityOnLong = Spot ? (EquityPercent / 100) * ((strategy.equity / close) - strategy.position_size) : (EquityPercent / 100) * (strategy.equity / close)
• The option to stop the system when the drawdown exceeds the fixed limit has been added.
Drawdown, as you already know, is a very important measure of risk in trading systems.
The maximum drawdown will tell us what the maximum loss of a trading system has been during a period. This maximum loss is determined by:
strategy.risk.max_drawdown(Risk, strategy.percent_of_equity)
• Leverage plotted on labels added.
█ ALERTS
To enjoy the benefits of automatic trading, TradingView alerts can be used as direct buy-sell orders on spot, or long-close orders with leverage.
Currently there are Chrome extensions that act as a bridge between TradingView and your Exchange or Broker.
This is an example of syntax for this type of extensions. Copy and paste a message like this into the alert window:
{{strategy.order.action}} @ {{strategy.order.price}} | e = {{exchange}} a = account s = {{ticker}} b = {{strategy.order.action}} {{strategy.order.alert_message}}
█ NOTE
Certain Risks of Live Algorithmic Trading You Should Know:
• Backtesting cannot assure actual results.
• The relevant market might fail or behave unexpectedly.
• Your broker may experience failures in its infrastructure, fail to execute your orders in a correct or timely fashion or reject your orders.
• The system you use for generating trading orders, communicating those orders to your broker, and receiving queries and trading results from your broker may fail.
• Time lag at various point in live trading might cause unexpected behavior.
• The systems of third parties in addition to those of the provider from which we obtain various services, your broker, and the applicable securities market may fail or malfunction.
█ THANKS
Thanks to TradingView, its Pine code, its community and especially those Pine wizards who post their ideas that helps us to learn.
If the world is heading toward a equitable new world economic order, let's get rich first ...
Happy trading!

Long only strategy VWAP with BB and Golden Cross EMA50/200
This is strategy, mainly designed for stock markets
It makes uses of the EMA 50/ 200 ( Golden cross) and VWAP and Bollinger bands.
It only takes long positions. It can be adapted to all time frames, but preferably to be used with longer timeframes 1h +
The rules for entry are the next ones :
1. EMA50 > EMA 200
2. if current close > vwap session value
3. check if price dipped BB lower band for any of last 10 candles
EXIT RULE
1. price closes above BB upper
STOP LOSS EXIT
1. As configured --- default is set to 1%

Stock Market Strategy : VWAP, MACD, EMA, Breakout, BBHello there,
Today I bring you a stock market strategy, specialized in NASDAQ stocks.
Its a daytrading strategy, that can only do a max of 1 trade per day. In this case it only trades the first 2 opening hours of the market.
The rules are simple :
We follow the trend based on a big EMA, in this case 200, after that, we check for VWAP direction , then, we check histogram from MACD. This is the simple logic of the strategy.
Inside there is another strategy, that not just do the above, but also uses Bollinger bands, and checks for breakout of bottom or top line. Also it uses Average directional Index, for even a bigger criteria .
So for example a long condition it would be : candle is above the ema, and candle is above vwap, and histogram is positive, and candle break the top bb level and ADI < 40 -> long signal . The opposite works for short(ADI > 20).
In this case all this criterias are between the first 2 hours of market. So we enter between the first hour, and exit in the next hour. For this we need to use very short time frames.
Hope you enjoy it.
Let me know if you have any questions
