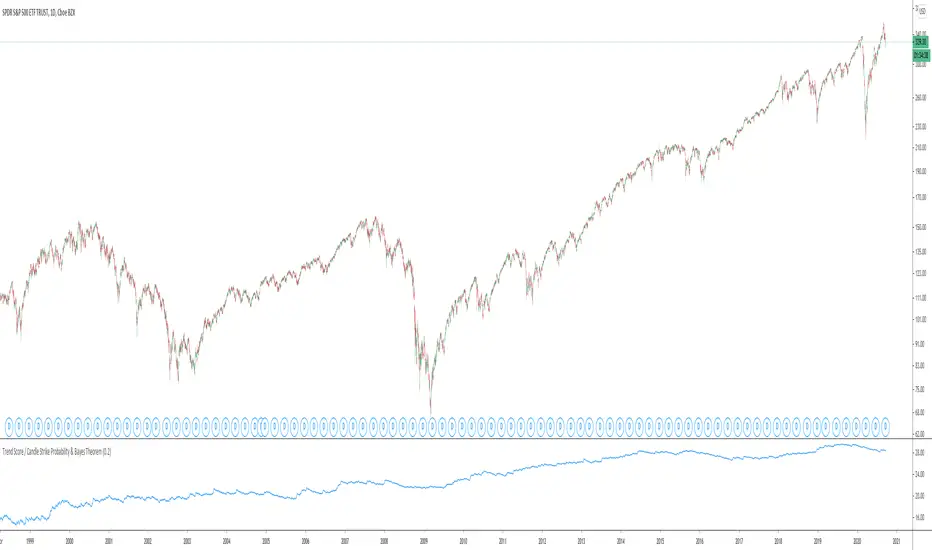
Trend Score & Bayes ProbabilityThis algo tries to tell you if the market is a trending market or a mean reversion one.
By checking how many times the correlation between the last seven candles is positive or not, and it will show the evolution of the market
Generally a trending market is one above 30 and short swing strategies will work better on this type of markets
It also shows probabilities of different candles setups like 7 Up candles in a row or the probablility of an up candle after 6 Up straight candles
"trend" için komut dosyalarını ara
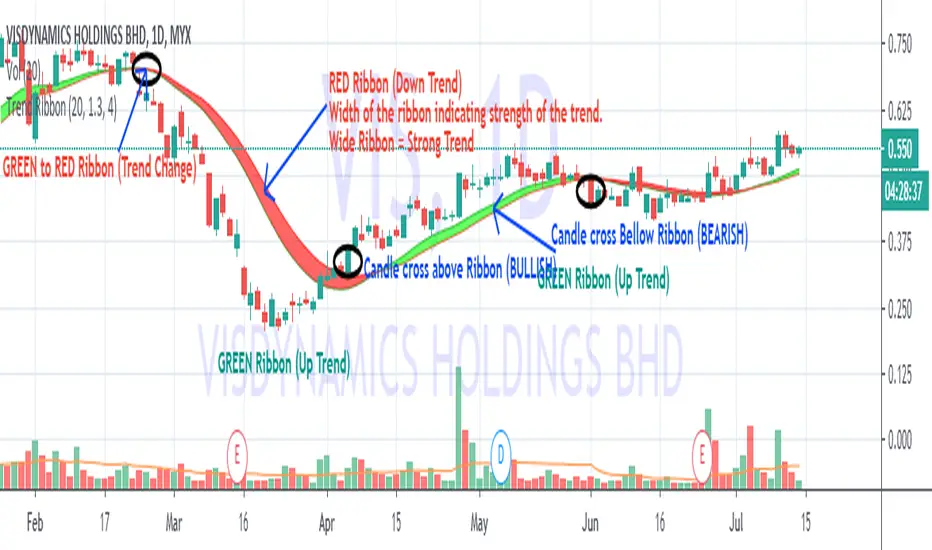
Trend Ribbon---------- INTRODUCTION ----------
Ribbon indicator is a trend indicator based on Moving Average
Default setting is 20 WMA
---------- HOW TO READ? ----------
Color
GREEN RIBBON = UP TREND (Short Term EMA above Long EMA )
RED RIBBON = DOWN TREND (Short Term EMA below Long EMA )
Candle's Position
Candle above ribbon = BULLISH
Candle below ribbon = BEARISH
Width
Width of the Ribbon is indicating the strength of the trend.
Wider ribbon indicating STRONG trend.
Thin ribbon indicating WEAK trend. May indicating Ranging.
---------- HOW TO TRADE? ----------
Only BUY when BULLISH and UPTREND
Avoid trading when ranging.
NOTES:-
Use with other indicators like FiFT or MCDX to measure the strength of the BULL .
Review Global Indices to feel Global market direction to support our trading decision
Trend-following Strategy E v2.7 4HHi All,
Welcome to my third published Trend-following strategy for bitcoin , designed specifically for BITMEX:XBTUSD on 4H.
This is an improvement of my second script (v2.6) to try and reduce 'chop' in consolidating ranges.
In order to set up Alerts for this strategy, I've created a second script called Trend-following Alert E v2.7 4H which you can find here:
Here you will find the "active_long" and "active_long" variables (red and blue lines) that show which positions are being taken by the strategy script.
You can set 'Once per bar close' alerts for this to get your alerts on TV.
For instance, I use 'crossing up @ 0.1' on "active_long" to set an 'Open Long" alert and a 'crossing down @ 0.9' to set a 'Close Long' alert.
The same holds for the 'Open Short' and the 'Close Short' alerts but then for the 'active_short' variable.
As you can see from the backtest I've done my best to create a decent ROI with limited DD.
Compared to the previous version (v2.6), the following has been improved:
- Accuracy has been increased from 49 to 63%
- Max. DD. has been reduced by 40%
- ROI/DD has been increased by 77%
You can also run this backtest/strategy with '100% of equity' but I would advise against trading this as your risk will fundamentally increase.
With a constant order size this strategy should be quite safe to use.
Going from the results it's clear that this strategy excels during clear bull/bear trends but might suffer a little bit during market chop (hopefully less with this update)
There are two inputs that can be modified on this strategy, however I think the current settings are optimal for this market on the 4H candle.
I've also added start and end dates to test specific time periods.
Please let me know if you have any questions.

Trend reversal strategy "muxie2" with safety SL, about 2x PFThis is a modified version of my script muxie1.
The muxie1 is more profitable in backtesting but is more risky as the stop loss is only triggered when a reversal happens and orders 2x more in reverse direction.
The current script works the same but if loss is substancial and reaches the safety stop loss then the trade is closed.
This uses 2 EMA and Stop Loss and Take Profit,
The soft stops don't fire at the precise value but only when the trend reverses
it is actually good for 1D timeframe since 2019, it was however optimised for 1min but I am not able to share scripts for 1m.
Have equivalent code for quantum zone Ftx.
Note the stops are in dollars of btc price, so this makes sense for bitcoin only.

Trend plus !!
This script is like a toolbox for me. I don't use its long & short signals,but with default setting it's suitable for scalping in 1 minute chart in the direction of the trend.. its easy but you need to learn how to use it!!!!
so what do we have in it?
2 ema lines
1 sma line
2 wma line
1 hullma line
4 vwap line
bolinger bands
ichimoku
.....

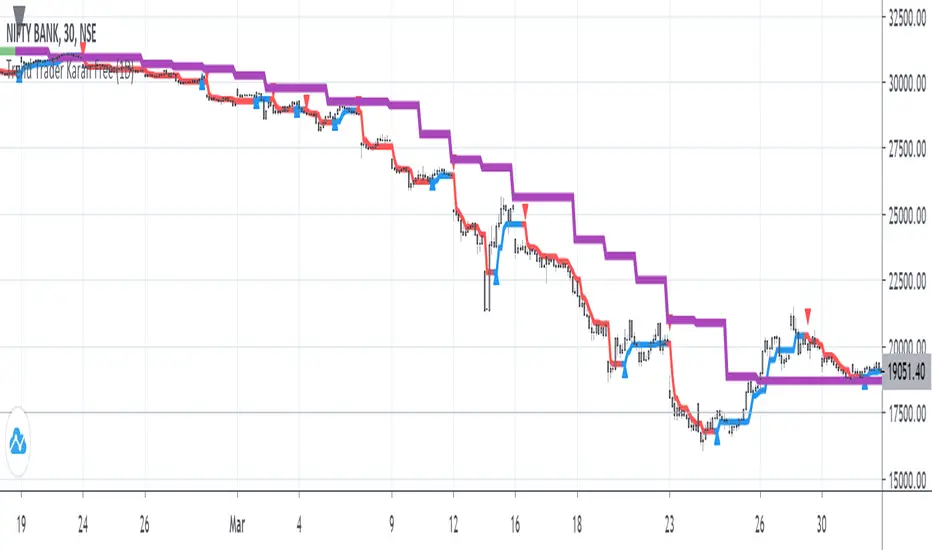
Trend Trader Karan TTK FreeNow, I have derived this code from Half Trend, after @jyotiprasad mentioned about it. And it was not difficult to convert to look like and work like Trend Trader Karan's Tool, who invested " Lakho Rupaya" and works on the basis of price action trading also.
Let me tell you guys, this is nothing but an ATR based system which people already traded as Half Trend, Super Trend and various names. Half Trend is no more a copyrighted indicator, which stopped marketing after being exposed, but people are still cheating with such indicators.
This Indicator will exactly do same way as the TTK indicator, even both of them overlaps including signals .
You can change colors to make matching/ look like even more similar.
I made a few modifications:
You can now add this to even 1 min chart keeping main trend 1 day or whatever, No more errors
Non repainting, but wait till closure of current candle to confirm the signal
Beware of morphed videos showing profits.
Please spread the word, comment and help others not to fall for such things. Remember, this indicator is just a common trend following indicator and accuracy is good only when mixed with price action etc.
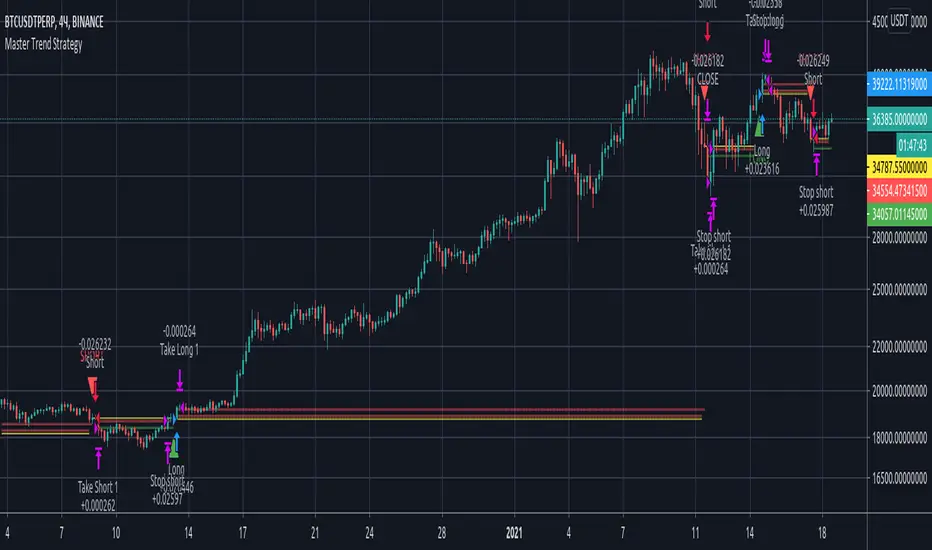
Master Trend StrategyStrategy for the Master Trend indicator. The screen shows a strategy with a deposit of 100 USD. By default, the strategy is STOP TREND. You can setup the strategy to MAIN TREND, if check off "Use stop" and "Use take 1 amount". Default strategy set stop by market when price reached first take and close by revert signal. MAIN TREND strategy trade from signal to signal use deep first take. Adjusting the settings you can create you own strategy.
This strategy has slippage equal 20 and commission 0.02% like on most of exchanges.
Can I get access?
Use the link below to obtain access to this indicator.
Trend Trader Tool by NiteshThis script is very usefull to define the trend of any script.. you will be able to judge the long term trend and the short term trend also.. based on that you will be able to trade intraday swing or positional depends on the time frame you have choosen on the charts for long term and short term respectively.. its as simple as that.. people are taking charge but we will not be charging anything .. its totally free ..:)

SBER's Trend Jinni (Real/False Trend Detector)Trend Jinni - Your trading time friend that helps you take right decisions
Trend Jinni indicator can be used for scalping, day trade, swing trades, short term or for investment analysis of equities, indices, currencies, and commodities. It provides easy to visualize multiple pieces of critical information:
1) Finds opportunity with major trade change information
2) Fake moves / Fake / False or fading trends
2) Support/resistance level
4) When not to be in the trade
5) Stop loss information
Why Trend Jinni? It analyzes information and presents it much before other lagging indicators and adapts to the changes in securities
How to read Trend Jinni?
Jinni line color:
Red = Sell side trade
Green = Buy side trade
Black = No trade zone
Best entry point is the one which is closest to the Jinni price line.
Trade is recommended to be closed when price is below Jinni line (in case of buy side trade) or it is above Jinni line (in case of sell side trade)
What time frame should I use?
1 min = Very aggressive traders / Scalpers
5 min = Aggressive day traders
15 min = Patient day traders
60 min = Swing traders/Short term traders
1 day = Long term traders/Short term traders

Trend Following Moving AveragesWhile analysing a chart, one of the biggest problem is to see if there is trend or not. While thinking about it, I found the idea to analyse moving averages in channel and their momentum according to channel width. I already published it as Trend Following Bar as you see at bottom of the chart.
How it Works?
On each bar it creates a channel by highest/lowest point of a MA. highest point is upper line and lowest point is lower line of the MA channel,
It gets highest and lowest point of last 300 bars, (say Price Channel )
If the width of MA channel is greater than certain rate of price channel then it decides there is trend
After it decided there is trend, it calculates the rate between channel and MA. Bigger result means stronger trend.
According to rate of MA channel and the price channel , MA Line becomes lighter/darker. so when you look at the MA Line's color you can see the trend strength.
Some details about my idea:
Options:
You can choose following MA types as source: EMA, SMA , RMA, WMA , VWMA
"Period to Check Trend" is the period to create MA channel. Bigger period cause more sensitivity.
"Trend Channel Rate %" is rate of price channel . Price channel created by using highest/lowest of last 300 bars. I did this to make the script works on all time frames correctly.
"Use Linear Regression" is used to get rid of noise. it may cause 1-2 bars latency.
Trend Following Bar script:
All comments are welcome!.
Enjoy!

Trend Following BarWhile analysing a chart, one of the biggest problem is to see if there is trend or not. While thinking about it, I found the idea to analyse moving averages in channel and their momentum according to channel width.
How it Works?
On each bar it creates a channel by highest/lowest point of a MA. highest point is upper line and lowest point is lower line of the MA channel,
It gets highest and lowest point of last 300 bars, (say Price Channel)
If the width of MA channel is greater than certain rate of price channel then it decides there is trend
After it decided there is trend, it calculates the rate between channel and MA. Bigger result means stronger trend.
According to rate of MA channel and the price channel, bar color becomes lighter/darker. so when you look at the bar color you can see the trend strength.
Some details about my idea:
Options:
You can choose following MA types as source: EMA, SMA, RMA, WMA, VWMA
"Period to Check Trend" is the period to create MA channel. Bigger period cause more sensitivity.
"Trend Channel Rate %" is rate of price channel. Price channel created by using highest/lowest of last 300 bars. I did this to make the script works on all time frames correctly.
"Use Linear Regression" is used to get rid of noise. it may cause 1-2 bars latency.
All comments are welcome!.
Enjoy!

Trend Following BreakoutEasy Trend Following Strategy using Highs and Lows breakout of the last X candles to enter and exit trades.
You can easily change the ENTRY and EXIT value in order to find the best settings.
This strategy seems to be working well for $BTC and $ETH on the 4H and 1D.
I didn't play with it too much as I am testing script to trade on the 15 minutes chart with margin. This script can't do this successfully but I hope it can be helpful for what you want to achieve.

Master TrendA unique trend indicator analyzes the market with high accuracy and determines the points for entering a position. The entry point is displayed with arrows and take profit as lines. The algorithm underlying it is protected by copyright.

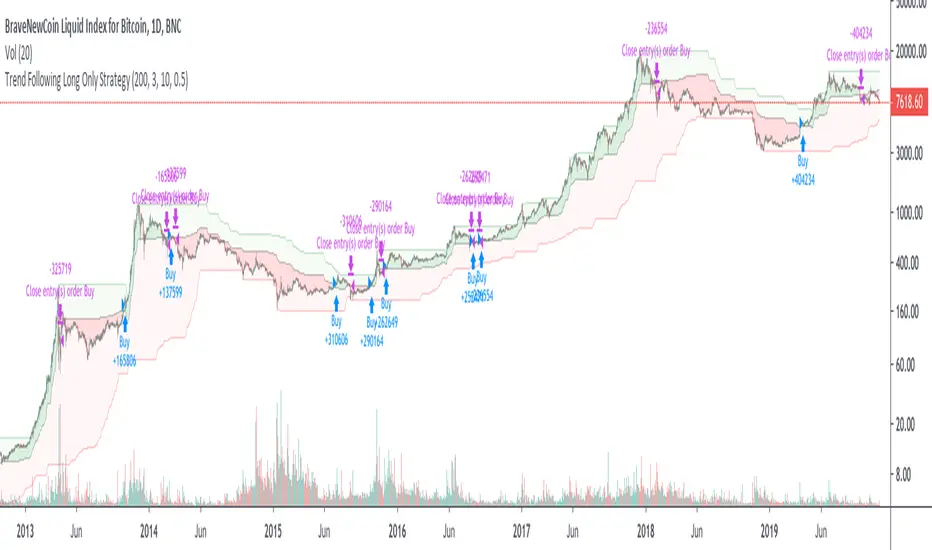
Trend Following Long Only StrategyThis script tries to ride bull trends and stay out of the market in bear trends.
Trend Finder [Anan]Hello Friends,
This is so usefull MTF pane to know how powerfull the trend is (Bull/Bear)
It's so easy to use, just apply it on low time frame and ride the trend..

Trend Confirmation Indicator - Triple OBVDear all, you might wonder is there a confirmation indicator that has a high hit rate, is dependable, and could rely on the information it gives you when making a decision?
Here I present an indicator I developed specifically for cryptocurrency, in the minds of eliminating fakeouts and traps.
Trend is always invalid then there is a lack of volume, so by tracking the momentum of price direction & volume, we can have a ballpark about where the market is moving to.
On balance volume
obvshort = ema3
obvmedium = ema9
obvlong = ema26
This is a lagging indicator, which means it's not good at predicting reversal.
This is also the reason why
long signal = obvshort > obvmedium and obvshort > obvlong
shortsignal = obvshort < obvmedium and obvshort < obvlong
both without obvmedium >< obvlong
This indicator will not lie to you.
At last
Save Hong Kong, the revolution of our time.

Trend signal with PullbackHello traders
I updated the Trend signal indicator from @riffster21 (www.tradingview.com) and added alerts and pullback to it.
Nothing fancy but still extremely useful
How to use the Trend signal with alerts indicator
In this screenshot, I didn't select the most optimal timeframe, neither the most optimal input for the indicator. I just wanted to explain with a very simple example, how it works and how to use it
Basically, it's being used to simulate obliques trendlines . I draw that one in pink to highligh what is the trendline simulated by the indicator
For Which timeframe ?
It's working for all timeframes.
Recommended input for the indicator ?
The greater the timeframe, the lesser the input should be. Which makes sense because setting a high value period on a weekly chart will give entry/exit signals way too late
On the contrary, on a m5 chart, setting a low value period will give too many fake signals and you'll get angry. I don't want that to happen :)
For crypto intraday trading (meaning m5 to H4), I feel the sweet spot is between 7 and 14 for the indicator input.
For crypto Swing trading (meaning H8 to weekly), an input between 3 and 5 is best
I can only strongly encourage you to apply it on a newly created chart without any other indicator and try to find the best input for the asset. Please note the ideal input might change between assets (example: BTC/USD vs ETH/BTC )
Drawing the corresponding oblique is very important the first time setting them on a chart to find the best setup
Notes on the pullback
The pullback field expects a percentage input. Meaning if you want your trend signal to be at least 1% away from your MM pullback, just insert 1 and don't forget to check the "Pullback Percentage" checkbox :)
Please let me know in the comments section if you have any question
Enjoy
Dave

Trend CheckpointsTrend Checkpoints reversals
Green :
1-Trend meter 3 green oscillators
2- Stochastic Rsi going down from 100-75
3- Stochastic Rsi with red background (optional on settings)
4- Price action above
Red :
1-Trend meter 3 red oscillators
2- Stochastic Rsi going down from 0-25
3- Stochastic Rsi with green background (optional on settings)
4- Price action below

Trend CheckerAn indicator that tell if market is trending or ranging, when the indicator is greater than 0.5 then market is trending, when the indicator is equal to 1 market is overbought/oversold.
Trend zonesThis simple script helps you to visualize trends on main chart, to filter any other signals against trend and detect trend durations for other indicators optimizations.

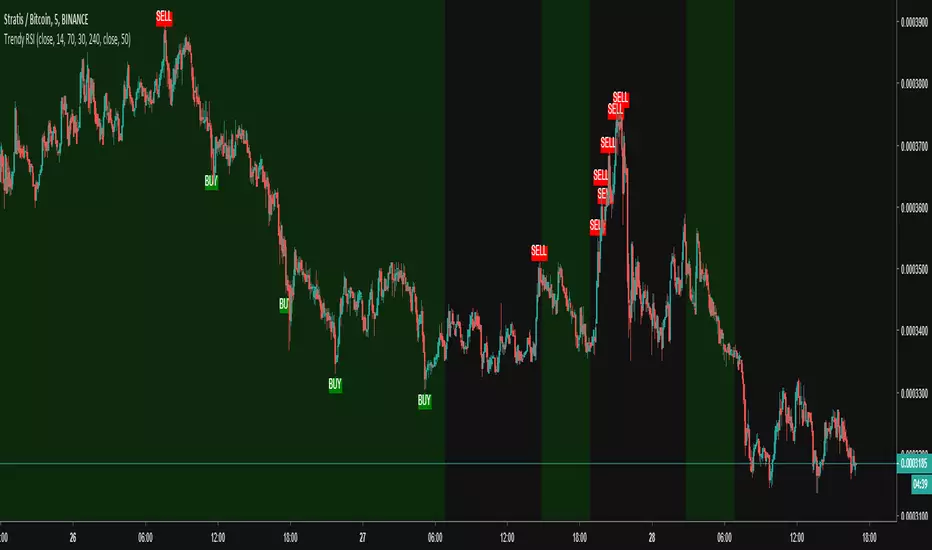
Trend apa sekarang? Mr.HokageIngat Trend adalah teman Jadi bagi kalian yang tidak tau apa itu trend nah itu jadi bahaya karena trader ilmu dasarnya adalah TREND jadi bagi kalian yang masih pusing trendnya naik atau turun saya punya indikator andalan di sini nah Jika candle kalian Hijau berarti Trend naik kalau Merah berarti Turun kalau merah berganti hijau berarti Beli kalau hijau berganti merah berarti Sell

Trendy RSI (Selim KMD)BETA!!! Script checks the trend from higher interval and creates signals with lower interval RSI condition.