RMBS Smart Detector - Multi-Factor Momentum System v2# RMBS Smart Detector - Multi-Factor Momentum System
## Overview
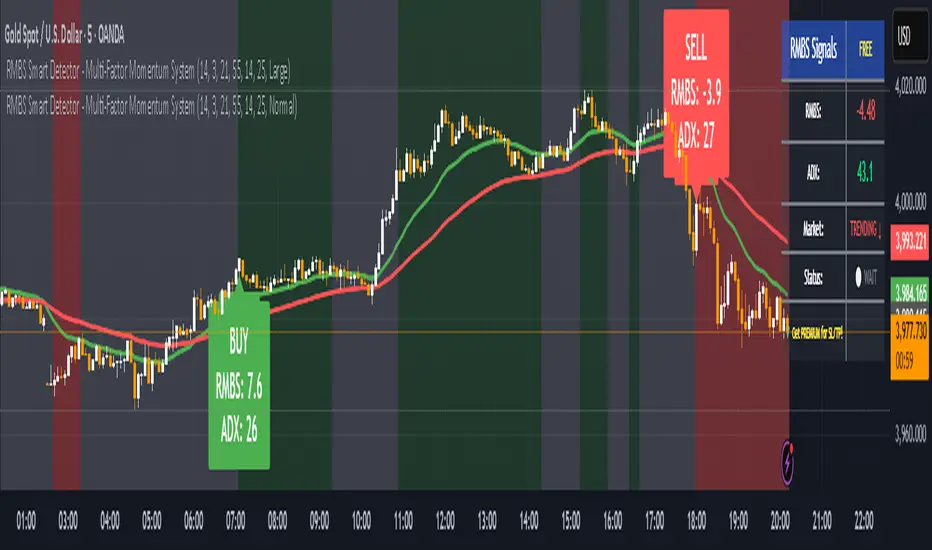
RMBS (Smart Detector - Multi-Factor Momentum System) is a proprietary scoring method developed by Ario, combining normalized RSI and Bollinger band positioning into a single composite metric.
---
## Core Methodology
### Buy/Sell Logic
Marker (green or red )appear when **all four filters** pass:
**1. RMBS Score (Momentum Strength)**
From the formula Bellow
Combined Range: -10 (extreme bearish) to +10 (extreme bullish)
Signal Thresholds:
• BUY: Score > +3.0
• SELL: Score < -3.0
2. EMA Trend Filter
BUY: EMA(21) > EMA(55) → Uptrend confirmed
SELL: EMA(21) < EMA(55) → Downtrend confirmed
3. ADX Strength Filter
Minimum ADX: 25 (adjustable 20-30)
ADX > 25: Trending market → Signal allowed
ADX < 25: Range-bound → Signal blocked
4. Alternating Logic
Prevents signal spam by requiring alternation:
✓ BUY → SELL → BUY (allowed)
✗ BUY → BUY → BUY (blocked)
________________________________________
Mathematical Foundation
RMBS Formula: scoring method developed by Ario
RMBS = (RSI – 50) / 10 + ((BB_pos – 50) / 10)
where:
• RSI = Relative Strength Index (close, L)
• BB_pos = (Close – (SMA – 2 σ)) / ((SMA + 2 σ) – (SMA – 2 σ)) × 100
• σ = standard deviation of close over lookback L
• SMA = simple moving average of close over lookback L
• L = rmbs_length (period setting)
This produces a normalized composite score around zero:
• Positive → bullish momentum and upper band dominance
• Negative → bearish momentum and lower band pressure
• Near 0 → neutral or transitional zone
Input Parameters
ADX Threshold (default: 25)
• Lower (20-23): More signals, less filtering
• Higher (28-30): Fewer signals, stronger trends
• Recommended: 25 for balanced filtering
Signal Thresholds
• BUY: +3.0 (adjustable)
• SELL: -3.0 (adjustable)
Visual Options
• Marker colors
• Background highlights
• Alert settings
________________________________________
Usage Guidelines
How to Interpret
• 🟢 Green Marker: All conditions met for Bull condition
• 🔴 Red Marker: All conditions met for Bear condition
• No Marker: Waiting for confirmation
________________________________________
Important Disclaimers
⚠️ Educational Purpose Only
• This tool demonstrates multi-factor technical analysis concepts
• Not financial advice or trade recommendations
• No guarantee of profitability
⚠️ Known Limitations
• Less effective in ranging/choppy markets
• Requires proper risk management (stop-loss, position sizing)
• Should be combined with fundamental analysis
⚠️ Risk Warning
Trading involves substantial risk of loss. Past performance does not indicate future results. Always conduct your own research and consult professionals before trading.
________________________________________
Open Source
Full Pine Script code available for educational study and modification. Feedback and improvement suggestions welcome.
“All logic is presented for research and educational visualization.”
"smart" için komut dosyalarını ara
VWAP + EMA Smart SignalsThis indicator combines VWAP (Volume Weighted Average Price) and EMA (Exponential Moving Average) to help visualize trend direction and potential momentum shifts.
It highlights smart confluence points where both trend and volume alignment occur, using compact on-chart signals for clarity.
Features:
VWAP and EMA combination for trend confirmation
Compact “smart signal” markers for potential momentum shifts
Adjustable EMA length and VWAP settings
Optional trend-colored candles for quick visualization
Works across all timeframes and instruments
Purpose:
Designed for traders who prefer a simple yet informative visual cue of price alignment with volume-weighted and moving-average trends.
This indicator is intended for educational and analytical purposes only and does not represent financial advice or guaranteed performance.

AI Money FlowAI Money Flow is a revolutionary trading indicator that combines cutting-edge artificial intelligence technologies with traditional Smart Money concepts. This indicator provides comprehensive market analysis with emphasis on signal accuracy and reliability.
Key Features:
Volume Profile with Smart Money Analysis - Displays real money flow instead of just volume, identifying key support and resistance levels based on actual trader activity.
Volatility-Based Support & Resistance - Intelligent support and resistance levels that dynamically adapt to market volatility in real-time for maximum accuracy.
Order Flow Analysis - Advanced detection of buying and selling pressure that reveals the true intentions of large market players.
Machine Learning Optimization - Futuristic AI technology that automatically learns and optimizes settings for each specific asset and timeframe.
Risk Management - Advanced volatility and price spike detection for better risk management and capital protection.
Real-time Dashboard - Modern dashboard with color-coded signals provides instant overview of market conditions and trends.
Accuracy: 88-93%

Bob Volman + EMA + TP/SL Smart (EZSignals V1)A smart scalping system inspired by Bob Volman’s price action methodology.
Combines EMA trend filtering with automatic TP/SL management and precise entry logic.
Designed for intraday traders who seek clean, efficient scalps with minimal noise.
🔹 Features:
EMA-based trend confirmation
Smart TP/SL auto calculation
Dynamic signal filtering (avoid false breakouts)
Visual entry & exit markers for better clarity
📈 Perfect for scalpers who want Volman-style precision with modern risk control.

CVD Pro – Smart Overlay + Signals (with Persist Mode)What this Indicator Does
CVD Pro visualizes Cumulative Volume Delta (CVD) data directly on your main price chart — helping you detect real buying vs. selling pressure in real time.
Unlike most CVD scripts that run in a separate subwindow, this one overlays price-mapped CVD curves on the candles themselves for better confluence with market structure and FVG zones.
The script dynamically scales normalized CVD values to the price range and uses adaptive smoothing and deviation bands to highlight shifts in trader behavior.
It also includes automatic bullish/bearish crossover signals, displayed as on-chart labels.
⚙️ Main Features
✅ Price-mapped CVD Overlay
CVD is normalized (Z-score) and projected onto the price chart for easy visual correlation with price structure.
✅ Multi-Timeframe Presets
Three sensitivity presets optimized for different chart environments:
Strict (4H) → Best for macro trends and high-timeframe structure.
Balanced (1H / 30m) → Great for active swing setups.
Sensitive (15m) → Captures short-term intraday reversals.
✅ Dynamic Bands & Smoothing
Deviation bands visualize statistical extremes in delta pressure — helping to identify exhaustion and divergence points.
✅ Smart Buy/Sell Signal Logic
Automatic label triggers when the CVD Overlay crosses its smoothed baseline:
🟢 BULL LONG → Rising CVD above the mean (buyers in control).
🔴 BEAR SHORT → Falling CVD below the mean (sellers in control).
✅ Persist Mode
Toggle to keep the last signal visible until a new one forms — ideal for traders who prefer clean chart annotations without noise.
✅ Clean, Minimal Overlay
Everything happens directly on your chart — no extra windows, no clutter. Designed for use with Smart Money Concepts, Fair Value Gaps (FVGs), or volume imbalance setups.
🧩 Use Case
CVD Pro is designed for traders who:
Use Smart Money Concepts (SMC) or ICT-style trading
Watch for FVG reactions, breaker blocks, and liquidity sweeps
Need to confirm order flow direction or momentum strength
Trade intraday or swing setups with precision entries and clear bias confirmation
⚡ Recommended Settings
4H / 1H: Use Strict mode for major structure and confirmation.
1H / 30m: Balanced mode for clear mid-term trend alignment.
15m: Sensitive mode to catch scalps and lower-TF shifts.
🧠 Pro Tips
Combine with RSI or Market Structure Breaks (MSS) for additional confluence.
A strong CVD divergence near a key FVG or 0.5–0.705 Fibonacci zone often signals reversal.
Persistent CVD crossover + price structure break = high-probability entry.
🧩 Credits
Created by Patrick S. ("Nova Labs")
Concept inspired by professional order-flow analytics and adaptive Z-Score normalization.
Would you like me to write a shorter “public summary” paragraph (for the short description at the top of TradingView, the one-liner users see before expanding)?
It’s usually a 2–3 sentence hook like:
“Overlay-based CVD indicator that merges volume delta with price structure. Detect true buying/selling pressure using adaptive normalization, deviation bands, and clean bullish/bearish crossover signals.”

Market Structure Smart Money Concept - BOS + CHOCH + IDMThis tool is designed for traders working with Smart Money Concepts (SMC) and analyzing market structure.
Key Elements
It automatically identifies and marks:
- **BOS (Break of Structure)** – confirmed breaks signaling trend continuation
- **CHoCH (Change of Character)** – reversal points marking trend changes
- **IDM (Internal Market Structure)** – a critically important element that helps distinguish true reversals from temporary corrections
- **Inside Bars** – automatic detection of inside bars to filter out "noise"
Why IDM is Important
Traders often mistake ordinary liquidity collection for the beginning of a new trend. IDM acts as an additional filter - only after its break can we speak of a true change in market structure.
Flexible Settings
- Label sizes and colors
- Line styles
- Separate settings for shadow and body breaks
- Search period configuration for initial points (1-100% of available history)
- Option to display current structure level lines
- Information table
Main Advantages
- Clear real-time market structure visualization
- Separation of body and shadow breaks for more precise analysis
- Flexibility of use: suitable for both intraday scalping and medium-term trading
- Minimization of subjectivity through strict algorithm
- Works on any timeframe and liquid instruments
**This indicator allows you to clearly see the current market structure, quickly assess market conditions, track key turning points, identify the active trend and potential reversals.**
==================================================================================
Этот инструмент создан для трейдеров, работающих по Smart Money Concepts (SMC) и анализирующих рыночную структуру.
### Ключевые элементы
Он автоматически определяет и отмечает:
- **BOS (Break of Structure)** – подтверждённые пробои, сигнализирующие о продолжении тренда
- **CHoCH (Change of Character)** – разворотные точки, фиксирующие смену тренда
- **IDM (Internal Market Structure)** – критически важный элемент, который помогает отличить истинные развороты от временных коррекций
- **Inside Bars** – автоматическое определение внутренних баров для фильтрации "шума"
Почему IDM важен
Часто трейдеры принимают обычный сбор ликвидности за начало нового тренда. IDM действует как дополнительный фильтр - только после его пробоя можно говорить об истинном изменении структуры рынка.
Гибкие настройки
- Размеры и цвета меток
- Стили линий
- Отдельные настройки для теневых и полнотелых пробоев
- Настройка периода поиска начальных точек (1-100% от доступной истории)
- Опция отображения линий текущих структурных точек
- Информационная таблица
Основные преимущества
- Чёткая визуализация структуры рынка в реальном времени
- Разделение полнотелых и теневых пробоев для более точного анализа
- Гибкость использования: подходит как для интрадей-скальпинга, так и для среднесрочной торговли
- Минимизация субъективности через строгий алгоритм
- Подходит для любых таймфреймов и ликвидных инструментов
**Этот индикатор позволяет ясно видеть текущую рыночную структуру, быстро оценить ситуацию на рынке, отслеживать ключевые переломные моменты, определить активный тренд и возможный разворот.**

MGY Smart Fibonacci ProMGY Smart Fibonacci Pro Indicator
Overview:
MGY Smart Fibonacci Pro is an advanced multi-timeframe Fibonacci indicator that automatically adapts to your current chart timeframe. It intelligently displays the most relevant Fibonacci retracement levels based on the higher timeframes, providing traders with dynamic support and resistance levels.

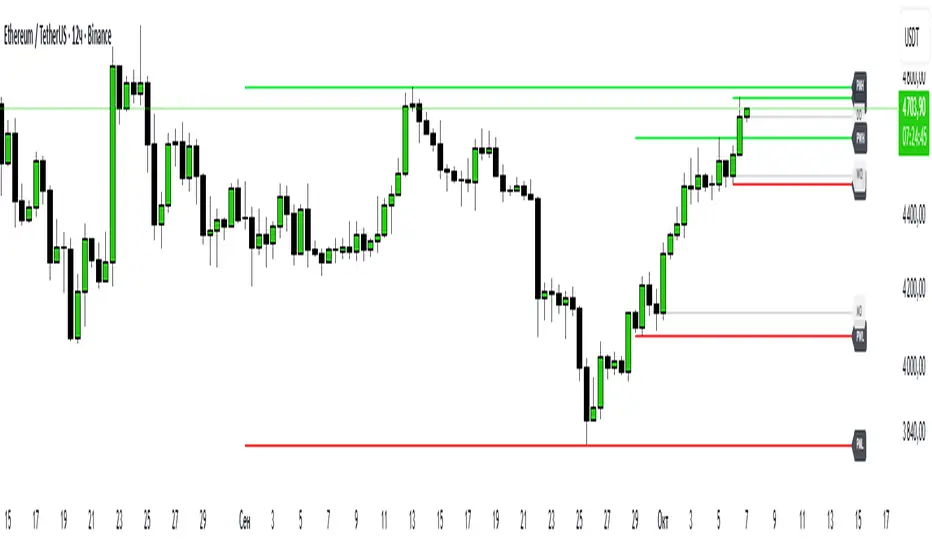
Hodie Smart PD/PW/PM LevelsHodie Smart PD/PW/PM Levels is a professional tool for tracking previous daily, weekly, and monthly highs and lows (PDH/PDL, PWH/PWL, PMH/PML).
It automatically plots levels on the chart and provides unique one-time alerts per period — no more repeated or false signals.
🔧 Features & Settings
1. Levels:
Daily (PDH/PDL)
Weekly (PWH/PWL)
Monthly (PMH/PML)
2. Customization:
Show/hide each level type
Adjustable line thickness and colors
Labels with customizable text and background colors
3. Line Building:
Levels are drawn from the previous period’s high/low and extend until the end of the current period.
🚨 Alert System – Main Advantage
The key strength of this indicator is the smart alert logic:
Each level alert is triggered only once per period (day, week, or month)
No need to recreate alerts every session — the script automatically resets them with each new period
Daily levels use precise "first touch" detection, while weekly/monthly levels fire only once until the next period
✅ This means you can set an alert once and be confident it won’t spam or miss critical touches.
📖 Quick Instruction
1. Add the indicator to your chart
2. In the alerts panel, choose:
Condition: PDH Touch, PDL Touch, PWH Touch, PWL Touch, PMH Touch, or PML Touch
Options: Once per bar (recommended)
Timeframe: any (1-minute interval works best)
3. Alerts will automatically respect the logic:
Daily levels – 1 alert per day
Weekly levels – 1 alert per week
Monthly levels – 1 alert per month
🎯 Why Use This Indicator?
Saves time: set alerts once, no need to update them daily
Eliminates duplicate signals
Clear visualization of key market levels
Works across all markets and timeframes
⚡ Perfect for traders using liquidity concepts, breakout strategies, and Smart Money methods.
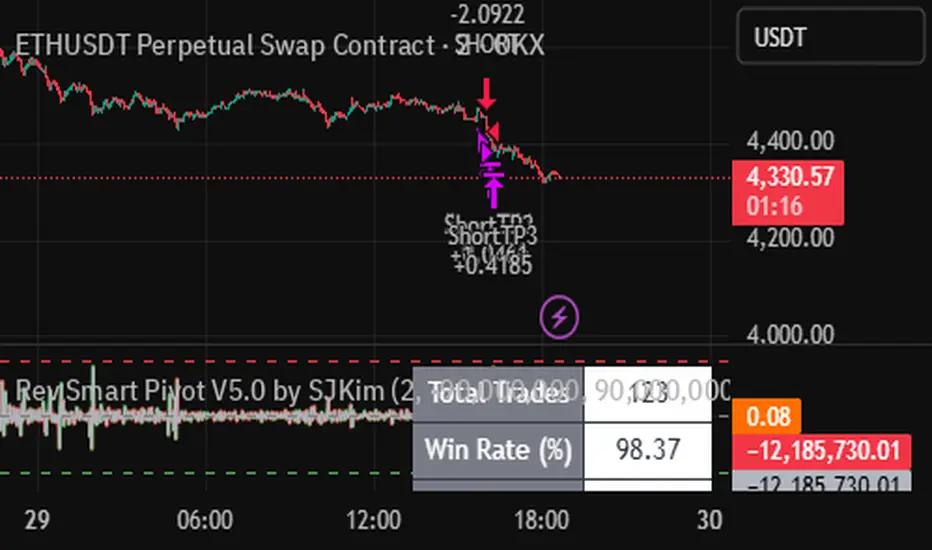
Rev Smart Pivot V5.0 by SJKimRev Smart Pivot V5.0 by SJKim
Rev Smart Pivot V5.0 by SJKim
Rev Smart Pivot V5.0 by SJKim

Std Smart Pivot V5.0 by SJKimStd Smart Pivot V5.0 by SJKim
Std Smart Pivot V5.0 by SJKim
Std Smart Pivot V5.0 by SJKim

Nor Smart Pivot V5.0 by SJKimNor Smart Pivot V5.0 by SJKim.
Nor Smart Pivot V5.0 by SJKim.
Nor Smart Pivot V5.0 by SJKim.
MK_OSFT-Multi-Timeframe MA Dashboard & Smart Alerts-v2📊 Multi-Timeframe MA Dashboard & Smart Alerts v2.0
Transform your trading with the ultimate moving average monitoring system that tracks up to 8 different MA configurations across multiple timeframes simultaneously.
🎯 What This Indicator Does
This advanced dashboard eliminates the need to constantly switch between timeframes by displaying all your critical moving averages on a single chart. Whether you're scalping on 5-minute charts or swing trading on daily timeframes, you'll instantly see the big picture.
⭐ Key Features
📈 Multi-Timeframe Moving Averages
Monitor up to **8 different MA configurations** simultaneously
Support for **SMA and EMA** across 6 timeframes (5m, 15m, 1h, 4h, Daily, Weekly)
Each MA fully customizable: length, color, alert settings, and visibility
Smart visual representation with labeled horizontal lines and connecting plots
🚨 Intelligent Alert System
Cross-over/Cross-under alerts for price vs MA interactions
Three alert modes : No alerts, Once only, or Once per bar close
Smart batching system prevents alert spam during volatile periods
Queue management with 3-second delays between alerts for optimal performance
Easy alert reset functionality for "once only" alerts
📊 Real-Time Information Dashboard
Live countdown timers showing time remaining until each timeframe closes
Color-coded progress bars with gradient visualization (green → yellow → orange → red)
Instant cross-over detection with up/down arrow indicators
Price vs MA relationship clearly displayed (above/below coloring)
🎨 Professional Visualization
Anti-overlap technology prevents labels from clustering
Customizable label positioning and sizing options
Drawing order control (larger timeframes first/last)
Connecting lines link current price to MA values
Status line integration for quick value reference
💡 Perfect For
Multi-timeframe traders [/b who need complete market context
Trend followers monitoring key MA levels across timeframes
Breakout traders waiting for price to cross critical moving averages
Risk managers using MAs as dynamic support/resistance levels
Anyone wanting organized, clutter-free MA monitoring
⚙️ Highly Configurable
Moving Average Settings
Individual enable/disable for each of 8 MA slots
Flexible timeframe selection : 5m, 15m, 1h, 4h, Daily, Weekly
MA type choice : SMA or EMA for each configuration
Custom lengths from 1 to any desired period
Color customization for each MA line and label
Alert Management
Per-MA alert configuration : Choose which MAs trigger alerts
Source selection : Current bar vs last confirmed bar calculations
Frequency control : Prevent over-alerting with smart queuing
Reset functionality : Easily reactivate "fired" once-only alerts
Display Options
Table positioning : Top-right, bottom-left, or bottom-right
Label styling : Size, offset, and gap control
Line customization : Width and extension options
Timezone adjustment : Align timestamps with your local time
🔧 Technical Excellence
Optimized performance with efficient array management and single-pass calculations
Real-time vs historical mode handling for accurate backtesting
Memory-efficient label and line management prevents accumulation
Robust error handling and edge case management
Clean, well-documented code following Pine Script best practices
📋 How to Use
Add to chart and configure your desired MA combinations
Set alert preferences for each MA (none/once/per bar)
Create TradingView alert using "Any alert() function calls"
Monitor the dashboard for cross-over signals and timeframe progress
Use the info table to track all MA values and alert statuses at a glance
🎓 Educational Value
This indicator serves as an excellent educational tool for understanding:
Multi-timeframe analysis principles
Moving average confluence and divergence
Alert system design and management
Professional indicator development techniques
---
Transform your trading workflow with this professional-grade multi-timeframe MA monitoring system. No more chart hopping - get the complete moving average picture in one powerful dashboard!
© MK_OSF_TRADING | Pine Script v6 | Mozilla Public License 2.0

Nifty Smart Zones & Breakout Bars(5min TF only) by Chaitu50cNifty Smart Zones & Breakout Bars is a purpose-built intraday trading tool, tested extensively on Nifty50 and recommended for Nifty50 use only.
All default settings are optimised specifically for Nifty50 on the 5-minute timeframe for maximum accuracy and clarity.
Why Last Bar of the Session Matters
The last candle of a trading session often represents the final battle between buyers and sellers for that day.
It encapsulates closing sentiment, influenced by end-of-day positioning, profit booking, and institutional activity.
The high and low of this bar frequently act as strong intraday support/resistance in the following sessions.
Price often reacts around these levels, especially when combined with volume surges.
Core Features
Session Last-Candle Zones
Plots a horizontal box at the high and low of the last candle in each session.
Boxes extend to the right to track carry-over levels into new sessions.
Uses a stateless approach — past zones reappear if relevant.
Smart Suppression System
When more than your Base Sessions (No Suppression) are shown, newer zones overlapping or within a proximity distance (in points) of older zones are hidden.
Older zones take priority, reducing chart clutter while keeping critical levels.
Breakout Bar Coloring
Highlights breakout bars in four categories:
Up Break (1-bar)
Down Break (1-bar)
Up Break (2-bar)
Down Break (2-bar)
Breakouts use a break buffer (in ticks) to filter noise.
Toggle coloring on/off instantly.
Volume Context (User Tip)
For best use, pair with volume analysis.
High-volume breakouts from last-session zones have greater conviction and can signal sustained momentum.
Usage Recommendations
Instrument: Nifty50 only (tested & optimised).
Timeframe: 5-minute chart for best results.
Approach:
Watch for price interaction with the plotted last-session zones.
Combine zone breaks with bar color signals and volume spikes for higher-probability trades.
Use suppression to focus on key, non-redundant levels.
Why This Tool is Different
Unlike standard support/resistance plotting, this indicator focuses on session-closing levels, which are more reliable than arbitrary highs/lows because they capture the final market consensus for the session.
The proximity-based suppression ensures your chart stays clean, while breakout paints give instant visual cues for momentum shifts.

Ayman – Full Smart Suite Auto/Manual Presets + PanelIndicator Name
Ayman – Full Smart Suite (OB/BoS/Liq/FVG/Pin/ADX/HTF) + Auto/Manual Presets + Panel
This is a multi-condition trading tool for TradingView that combines advanced Smart Money Concepts (SMC) with classic technical filters.
It generates BUY/SELL signals, draws Stop Loss (SL) and Take Profit (TP1, TP2) levels, and displays a control panel with all active settings and conditions.
1. Main Features
Smart Money Concepts Filters:
Order Block (OB) Zones
Break of Structure (BoS)
Liquidity Sweeps
Fair Value Gaps (FVG)
Pin Bar patterns
ADX filter
Higher Timeframe EMA filter (HTF EMA)
Two Operating Modes:
Auto Presets: Automatically adjusts all settings (buffers, ATR multipliers, RR, etc.) based on your chart timeframe (M1/M5/M15).
Manual Mode: Fully customize all parameters yourself.
Trade Management Levels:
Stop Loss (SL)
TP1 – partial profit
TP2 – full profit
Visual Panel showing:
Current settings
Filter status
Trend direction
Last swing levels
SL/TP status
Alerts for BUY/SELL conditions
2. Entry Conditions
A BUY signal is generated when all these are true:
Trend: Price above EMA (bullish)
HTF EMA: Higher timeframe trend also bullish
ADX: Trend strength above threshold
OB: Price in a valid bullish Order Block zone
BoS: Structure break to the upside
Liquidity Sweep: Sweep of recent lows in bullish context
FVG: A bullish Fair Value Gap is present
Pin Bar: Bullish Pin Bar pattern detected (if enabled)
A SELL signal is generated when the opposite conditions are met.
3. Stop Loss & Take Profits
SL: Placed just beyond the last swing low (BUY) or swing high (SELL), with a small ATR buffer.
TP1: Partial profit target, defined as a ratio of the SL distance.
TP2: Full profit target, based on Reward:Risk ratio.
4. How to Use
Step 1 – Apply Indicator
Open TradingView
Go to your chart (recommended: XAUUSD, M1/M5 for scalping)
Add the indicator script
Step 2 – Choose Mode
AUTO Mode: Leave “Use Auto Presets” ON – parameters adapt to your timeframe.
MANUAL Mode: Turn Auto OFF and adjust all lengths, buffers, RR, and filters.
Step 3 – Filters
In the Filters On/Off section, enable/disable specific conditions (OB, BoS, Liq, FVG, Pin Bar, ADX, HTF EMA).
Step 4 – Trading the Signals
Wait for a BUY or SELL arrow to appear.
SL and TP levels will be plotted automatically.
TP1 can be used for partial close and TP2 for full exit.
Step 5 – Alerts
Set alerts via BUY Signal or SELL Signal to receive notifications.
5. Best Practices
Scalping: Use M1 or M5 with AUTO mode for gold or forex pairs.
Swing Trading: Use M15+ and adjust buffers/ATR manually.
Combine with price action confirmation before entering trades.
For higher accuracy, wait for multiple filter confirmations rather than acting on the first arrow.
6. Summary Table
Feature Purpose Can Disable?
Order Block Finds key supply/demand zones ✅
Break of Structure Detects trend continuation ✅
Liquidity Sweep Finds stop-hunt moves ✅
Fair Value Gap Confirms imbalance entries ✅
Pin Bar Price action reversal filter ✅
ADX Trend strength filter ✅
HTF EMA Higher timeframe confirmation ✅

Volatility Wick Trap — Smart Reversal EngineThe Volatility Wick Trap — Smart Reversal Engine is a precision reversal detection tool designed for traders who rely on smart money footprints, volatility compression, and liquidity wick exhaustion to time entries near market turns.
💡 Core Components:
Volatility Squeeze Detection: Identifies candles where range compresses significantly compared to the 14-period average true range, highlighting potential breakout zones.
Liquidity Wick Exhaustion: Detects candles with dominant upper or lower wicks, signaling failed liquidity grabs or stop hunts.
Contextual EMA Filter: Uses a 21-period EMA to filter signals, improving accuracy by aligning with market structure bias.
🔍 How It Works:
Green diamond lines mark bullish hidden reversal zones.
Red diamond lines mark bearish hidden reversal traps.
These lines only appear when volatility compresses and wick traps are confirmed within the trend context.
✅ Clean. Minimal. Tactical.
Ideal for scalpers, swing traders, and smart money enthusiasts looking to fade emotional price spikes.

Yuri Garcia Smart Money Strategy FULL (COMPLIANT)Yuri Garcia Smart Money Strategy FULL (Slope Divergence)
This script is not a mashup of random indicators. It is an original, coherent strategy that blends multiple institutional-grade tools to form a unified Smart Money trading system. Each component contributes to precise trade filtering, context, and confirmation — no element is decorative or redundant.
🔍 Strategy Logic: How It Works
This strategy integrates the following tools, each with a clearly defined role:
1. Volume Cluster Zones (Orange bands)
Identifies strong buy/sell areas using the highest volume nodes over a rolling window. These act as dynamic points of control where Smart Money is likely active.
2. HTF Zones (4H) (Purple band)
Defines institutional zones by using the 20-bar high/low on the 4-hour chart. These set the outer bounds for valid entries, ensuring alignment with larger market structure.
3. Wick Pullback Filter (Orange circle 🔶)
Detects exhaustion or absorption near zones. Used to confirm genuine rejection after liquidity sweeps or traps.
4. Cumulative Delta Confirmation (Red square 🟥)
Analyzes whether buyers or sellers are dominant using delta volume. Trades only trigger when volume confirms the intended direction.
5. Slope-Based Delta Divergence (Optional)
Detects hidden reversals between price and delta. This prevents late entries and provides early insight into potential trap reversals.
6. Liquidity Grab Detection (Blue diamond 🔷)
Marks smart money stop hunts — temporary price breaks beyond highs/lows, followed by reversal. Used as a confluence tool.
7. ATR-Based Dynamic Risk Control
The strategy uses ATR to calculate SL/TP dynamically. This allows position sizing to adjust to volatility, reducing overexposure in high-momentum conditions.
🎯 Entry Criteria
All the following conditions must be met:
✅ Price is inside a Volume Cluster Zone
✅ Price is within the HTF Institutional Zone
✅ Wick Pullback confirms reaction
✅ Delta confirms strength of buyers/sellers
✅ (Optional) Slope-based divergence signals hidden shift
✅ (Optional) Liquidity grab occurs
Only then will the strategy trigger an entry.
📈 Visual Legend (Symbols on Chart)
Symbol Description
🟣 Purple Zone HTF Support/Resistance zone (4H context)
🟠 Orange Zone Volume cluster from top 3 volume nodes
🔶 Orange Circle Wick Pullback confirmation
🟥 Red Square Delta Confirmation
🔷 Blue Diamond Liquidity Grab indicator
🔵 Blue X Price is inside HTF Zone
🔻 Red Triangle SHORT entry signal
🔺 Green Triangle LONG entry signal
These visuals make it easier to read the chart intuitively while understanding each condition’s role.
⚙️ Strategy Settings Justification
Default Qty: 2% of equity (sustainable risk)
RRR: 2.0 (adaptive to volatility)
ATR Multiplier: 2.0 for SL/TP
Commission: 0.1% used
Slippage: 2 points for realism
Minimum Trades for Testing: Designed to generate over 100 trades under normal backtest conditions
Dataset: Supports BTC, GOLD, Forex, Indices with realistic volatility and volume
These settings reflect a realistic use case for average retail traders and avoid overfitting or unrealistic returns.
📌 How to Use
Apply on 15-minute or 1-hour timeframe.
Wait for full alignment of all entry conditions.
Confirm visually or use included alerts for manual or bot execution.
SL and TP are automatically handled.
🚫 Important Notes
This script is original, not a remix or mashup of unrelated indicators.
Each component was designed to work in harmony, enhancing trade quality and confidence.
No external scripts are required to function.
Alert messages are pre-formatted for both manual and webhook use.

🔁 A.X.I.S Fibonacci Engine V2 – Smart Projected Pathway🔁 A.X.I.S Fibonacci Engine V2 – Smart Projected Pathway indicator
The A.X.I.S Fibonacci Engine V2 is a next-generation Fibonacci projection tool designed for traders seeking advanced, adaptive levels that respond to true multi-timeframe market structure. Built from the ground up for active traders—scalpers, swing traders, and position players—it fuses traditional Fibonacci logic with dynamic price projection and smart anchor logic.
How It Works:
Multi-Timeframe Anchoring:
Anchors your Fibonacci levels to High Timeframe (HTF) pivots for powerful bias and “macro” market structure, while also utilizing Low Timeframe (LTF) swing detection for precise “micro” projection and pathway analysis.
Dynamic Pathway Projection:
Beyond static lines, this engine allows Fibonacci levels to be projected forward, following the price path between significant swings—giving you projected targets and active “pathways” instead of just fixed retracement bands.
Trend-Adaptive Logic:
Determines bullish/bearish bias based on where HTF price closes relative to a moving average (HTF EMA-20), meaning the plotted fibs automatically adjust to uptrends or downtrends. No need to guess direction.
Auto-Cleanup & Smart Management:
Old lines and labels are deleted automatically to keep your chart clean, and levels are recalculated with every new significant swing (“leg”)—no manual intervention needed.
Key Features:
Multi-Timeframe Input:
Choose both HTF (for “anchor” pivots) and LTF (for “projection” pivots) independently.
Fine-tune swing sensitivity for both anchors and pathway pivots.
Classic + Projected Mode:
Choose between standard horizontal Fibs or enable Dynamic Pathway Mode to project levels diagonally into future bars, creating “fib pathways.”
Color Customization:
Individualize bullish/bearish fib colors, line style (solid, dashed, dotted), thickness, label position, and transparency.
Special “golden zone” highlighting for the most critical levels (0.618/0.786).
Visual Anchors:
Optionally plot markers for HTF swing pivots for extra clarity.
Chart Cleanliness:
Script manages and deletes its own objects—no more chart clutter!
Real-Time Auto-Update:
All levels and pathways update in real time as market structure changes.
User-Friendly Labels:
Toggle on/off fib level labels, with position and background adjustments.
Practical Trading Applications:
Swing/Position Trading:
Use HTF pivots for macro context, then project LTF fibs into the future for potential reversal/extension targets.
Scalping:
Deploy on lower timeframes with micro pivots for intraday levels and short-term projected moves.
Dynamic Take-Profit & Entry Zones:
Identify evolving TP and re-entry zones as price carves out new swings, even in choppy or trending conditions.
Trend Confirmation:
Let the engine determine trend direction, so your fibs are always aligned with prevailing momentum.
How to Use:
Add to Chart:
Apply the indicator to any chart or timeframe.
Set Your Anchors:
Pick the HTF (anchor) and LTF (projection) timeframes.
Adjust swing sensitivity (lookback) as needed.
Enable/Disable Dynamic Pathway:
For regular fibs, leave off.
For projected “pathways,” turn it ON—lines will project forward along the likely path of the next move.
Adjust Colors, Labels, and Styles:
Fine-tune everything for clarity and your personal style.
Watch for Changes:
As new pivots form, the script will update levels in real time, keeping your roadmap fresh.
(Optional) Show Macro Swings:
Toggle on/off to plot markers for the most recent HTF pivots.
Who Is It For?
Day traders, scalpers, and swing traders wanting true projected price targets—not just static fibs.
Traders tired of redrawing fibs after every new swing.
Anyone who wants a clean, dynamic, and truly adaptive fib tool that blends macro and micro market structure into one engine.
What Makes It Different?
True multi-timeframe awareness:
Adapts to both macro (HTF) and micro (LTF) structure.
Automatic trend recognition:
Fibs align with price action—no manual flipping.
Projected, not just static:
See where fib levels could land, not just where they were.
Cleanest chart management:
Deletes its own lines and labels on every update—no mess, ever.
Note:
This tool is for educational and informational purposes only. Not financial advice. Always use proper risk management!
Any issues or feature requests? Drop a comment below or reach out!
Happy trading and welcome to the A.X.I.S revolution.
— I5X-Albatross

TrendPilot AI v2 — Smart ATR Indicator with ZonesTrendPilot AI v2 is a smart price-action and ATR-based trading system designed for swing and position traders. It combines trend-following logic with adaptive price zones to help users identify high-probability Buy and Sell opportunities — along with intelligent re-entry points, weak signal detection, and visual structure zones.
🔧 Core Features:
✅ ATR-based Buy/Sell signals with confirmation logic
✅ Dynamic 99 EMA Channel for trend context
✅ Re-entry triangles for stacking or retracing setups
✅ 150 EMA Weak Signal Detection for early trend warnings
✅ 🧭 Price Action Zones (Premium, Equilibrium, Discount)
✅ Visual alerts via triangles, labels, and color-coded logic
✅ Designed for 15m, 1H, and 4H charts — also useful on Daily
🧠 How It Works (Logic Breakdown)
1️⃣ Trend Direction — EMA Channel Logic
A 99 EMA Channel determines the dominant market bias.
If price is above the channel → trend is Bullish → Buy signals are valid
If price is below the channel → trend is Bearish → Sell signals are valid
2️⃣ Buy/Sell Signals — ATR Trailing Logic
The system uses custom ATR trailing logic to detect when price momentum shifts.
When a breakout aligns with trend direction, a Buy or Sell label appears.
These are designed to capture the main trend leg or reversal zone.
3️⃣ Re-Entry Signals — Triangle Visual Cues
During a confirmed trend, if price retraces to the EMA channel, a small triangle is shown:
🔼 Green triangle: Buy re-entry during bullish trend
🔽 Red triangle: Sell re-entry during bearish trend
These are not new signals but continuation cues for advanced traders.
4️⃣ Weak Signal Detection — 150 EMA Logic
A secondary 150 EMA helps detect possible trend exhaustion.
If price dips below 150 EMA during a bullish run, an orange triangle appears (⚠️ caution).
If price rises above 150 EMA during a bearish run, a blue triangle appears.
This signals potential weakening of the active trend.
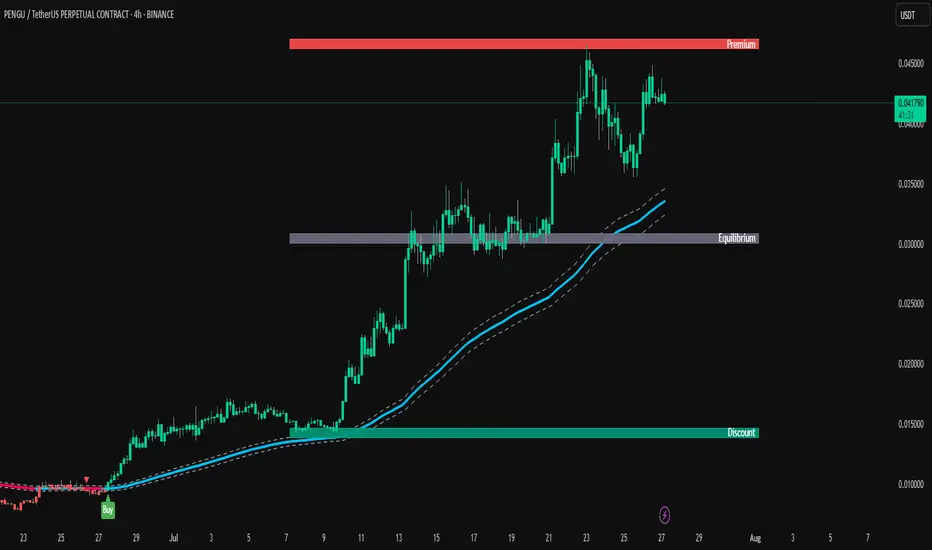
5️⃣ Price Zones — Premium, Equilibrium, Discount
TrendPilot AI v2 draws 3 smart price zones based on ATR & market structure:
🟥 Premium Zone (Top) → Overbought area, caution for long trades
🟨 Equilibrium Zone (Middle) → Fair value, consolidation possible
🟩 Discount Zone (Bottom) → Oversold, better long entries
These zones help filter signals and avoid entries in risky areas.
Example: Avoid Buy signals inside Premium zone.
🧪 Suggested Use:
✅ Timeframes: 15m / 1H / 4H / 1D
✅ Combine signals with zone analysis for optimal entries
✅ Use re-entry triangles to add or confirm during pullbacks
✅ Use weak signal warnings to tighten stops or manage risk
✅ Works best in trending environments or breakout markets
⚠️ Note for Users:
This script is not repainting. All signals are plotted with stable logic.
Past performance does not guarantee future results — always backtest first.
Script does not contain financial advice — use at your own discretion.
ParthFintech SMART Indicator V1.0A powerful, all-in-one SMART indicator designed to identify high-probability trade setups across any timeframe. By combining break-of-structure entries with multi-timeframe trend confirmation, dynamic support & resistance, Order Block (OB) and Fair Value Gaps (FVG ) Detection, it automatically plots your entry, stop loss, and three tiered take-profit levels—and even marks them with arrows and labels so you can act at a glance.
---
A. 🔑 Key Features
1. Break of Structure (BOS) based entries: Detects fresh bullish or bearish structure breaks for precise timing.
2. Multi-Timeframe Trend Filter: Confirms 4 hour and Daily trend alignment via crossovers to avoid counter-trend signals.
3. Dynamic Support & Resistance Zones: Automatically captures the most recent swing highs/lows as S/R levels in the chart.
4. Multiple confluence Detection: Marks recent bullish/bearish order blocks with tiny colored squares.
5. Fair Value Gap (FVG) Zones: Highlights potential liquidity imbalance areas where price often returns.
6. Automated Risk/Reward Levels:
- Entry at the BOS candle high/low
- Stop Loss at the most recent swing low (for longs) or swing high (for shorts)
- TP1, TP2, TP3 calculated as configurable RR multiples (default 1.5×, 2×, 3×)
B. Visual Cues:
- Green arrow below the bar for long entries
- Red arrow above the bar for short entries
- Labels “ENTRY”, “SL”, “TP1”, “TP2”, “TP3” plotted at their respective price levels
- Alert-Ready: Built-in alert conditions for Entry, all three TPs and SL hits—perfect for pop-ups, emails, or webhooks (Telegram integration).
C. ⚙️ Inputs & Customization
Input Default Description
- TP1 RR 1.5 First take-profit as a multiple of risk
- TP2 RR 2.0 Second take-profit multiple
- TP3 RR 3.0 Third take-profit multiple
- Lookback S/R 20 Bars to use when calculating swing highs/lows
- Arrow Offset (pips) 10 Vertical offset for the entry arrows
- HTF 1 240 Higher timeframe #1 (4 hour)
- HTF 2 D Higher timeframe #2 (Daily)
- Customize RR targets, lookback period, arrow offset, or HF trend timeframes to match your trading style.
---
D. 🎯 How It Works
1. Trend Check – Uses trend analysis on 4H & Daily to ensure you trade with the dominant market direction.
2. Structure Break – Alerts when price closes beyond the most recent swing high (bullish) or low (bearish).
3. Zone Confirmation – Plots S/R, OB, and FVG zones to help you visualize confluence.
4. Level Calculation – Automatically computes entry, stop, and three target levels based on your RR settings.
5. Visual Signals & Alerts – Draws arrows/labels on the chart and triggers alerts so you never miss a setup.
---
E. 🚀 Getting Started
1. Open Indicators menu on TradingView and search for ParthFintech SMART Indicator.v1.0
2. Click Add to Chart and tweak input settings to your preference.
3. Create alerts on “Buy Signal”, “Sell Signal”, “TP1 Hit”, “SL Hit”, etc., choosing popup, email, or webhook delivery.
Contact: support@parth-fintech.com or visit parth-fintech.com for any queries.
-----
> Disclaimer: This indicator is provided for personal use and should be tested thoroughly in a demo environment before deploying with real capital. Always manage your risk appropriately.

🧪 Yuri Garcia Smart Money Strategy FULL (Slope Divergence))📣 Yuri Garcia – Smart Money Strategy FULL
This is my private Smart Money Concept strategy, designed for my family and community to learn, trade, and grow sustainably.
🔑 How it works:
✅ Volume Cluster Zones: Automatically detects areas where strong buyers or sellers concentrate, acting as dynamic S/R levels.
✅ HTF Institutional Zones (4H): Higher timeframe trend filter ensures you’re always trading in the direction of major flows.
✅ Wick Pullback Filter: Confirms price rejects the zone, catching smart money traps and reversals.
✅ Cumulative Delta (CVD): Confirms whether buyers or sellers are truly in control.
✅ Slope-Based Divergence: Optional hidden divergence between price & CVD to spot reversals others miss.
✅ ATR Dynamic SL/TP: Adapts stop loss and take profit to live volatility with adjustable risk/reward.
🧩 Visual Markers Explained:
🟦 Blue X: Price inside HTF zone
🟨 Yellow X: Price inside Volume Cluster zone
🟧 Orange Circle: Wick pullback detected
🟥 Red Square: CVD confirms order flow strength
🔼 Aqua Triangle Up: Bullish slope divergence
🔽 Purple Triangle Down: Bearish slope divergence
🟢 Green Triangle Up: Final Long Entry confirmed
🔴 Red Triangle Down: Final Short Entry confirmed
⚡ Who is this for?
This strategy is best suited for traders who understand smart money concepts, order flow, and want an adaptive framework to trade major assets like BTC, Gold, SP500, NASDAQ, or FX pairs.
🔒 Important
Use responsibly, backtest extensively, and combine with solid risk management. This is for educational purposes only.
✨ Credits
Built with ❤️ by Yuri Garcia – dedicated to my family & community.
✅ How to use it
1️⃣ Add to chart
2️⃣ Adjust inputs for your asset & timeframe
3️⃣ Enable/disable slope divergence filter to match your style
4️⃣ Set your alerts with built-in conditions

Order Blocks v2Order Blocks v2 – Smart OB Detection with Time & FVG Filters
Order Blocks v2 is an advanced tool designed to identify potential institutional footprints in the market by dynamically plotting bullish and bearish order blocks.
This indicator refines classic OB logic by combining:
Fractal-based break conditions
Time-level filtering (Power of 3)
Optional Fair Value Gap (FVG) confirmation
Real-time plotting and auto-invalidation
Perfect for traders using ICT, Smart Money, or algorithmic timing models like Hopplipka.
🧠 What the indicator does
Detects order blocks after break of bullish/bearish fractals
Supports 3-bar or 5-bar fractal structures
Allows OB detection based on close breaks or high/low breaks
Optionally confirms OBs only if followed by a Fair Value Gap within N candles
Filters OBs based on specific time levels (3, 7, 11, 14) — core anchors in many algorithmic models
Automatically deletes invalidated OBs once price closes through the zone
⚙️ How it works
The indicator:
Tracks local fractal highs/lows
Once a fractal is broken by price, it backtracks to identify the best OB candle (highest bullish or lowest bearish)
Validates the level by checking:
OB type logic (close or HL break)
Time stamp match with algorithmic time anchors (e.g. 3, 7, 11, 14 – known from the Power of 3 concept)
Optional FVG confirmation after OB
Plots OB zones as lines (body or wick-based) and removes them if invalidated by a candle close
This ensures traders see only valid, active levels — removing noise from broken or out-of-context zones.
🔧 Customization
Choose 3-bar or 5-bar fractals
OB detection type: close break or HL break
Enable/disable OBs only on times 3, 7, 11, 14 (Hopplipka style)
Optional: require nearby FVG for validation
Line style: solid, dashed, or dotted
Adjust OB length, width, color, and use body or wick for OB height
🚀 How to use it
Add the script to your chart
Choose your preferred OB detection mode and filters
Use plotted OB zones to:
Anticipate price rejections and reversals
Validate Smart Money or ICT-based entry zones
Align setups with algorithmic time sequences (3, 7, 11, 14)
Filter out invalid OBs automatically, keeping your chart clean
The tool is useful on any timeframe but performs best when combined with a liquidity-based or time-anchored trading model.
💡 What makes it original
Combines fractal logic with OB confirmation and time anchors
Implements time-based filtering inspired by Hopplipka’s interpretation of the "Power of 3"
Allows OB validation via optional FVG follow-up — rarely available in public indicators
Auto-cleans invalidated OBs to reduce clutter
Designed to reflect market structure logic used by institutions and algorithms
💬 Why it’s worth using
Order Blocks v2 simplifies one of the most nuanced parts of SMC: identifying clean and high-probability OBs.
It removes subjectivity, adds clear timing logic, and integrates optional confluence tools — like FVG.
For traders serious about algorithmic-level structure and clean setups, this tool delivers both logic and clarity.
⚠️ Important
This indicator:
Is not a signal generator or financial advice tool
Is intended for experienced traders using OB/SMC/time-based logic
Does not predict market direction — it provides visual structural levels only

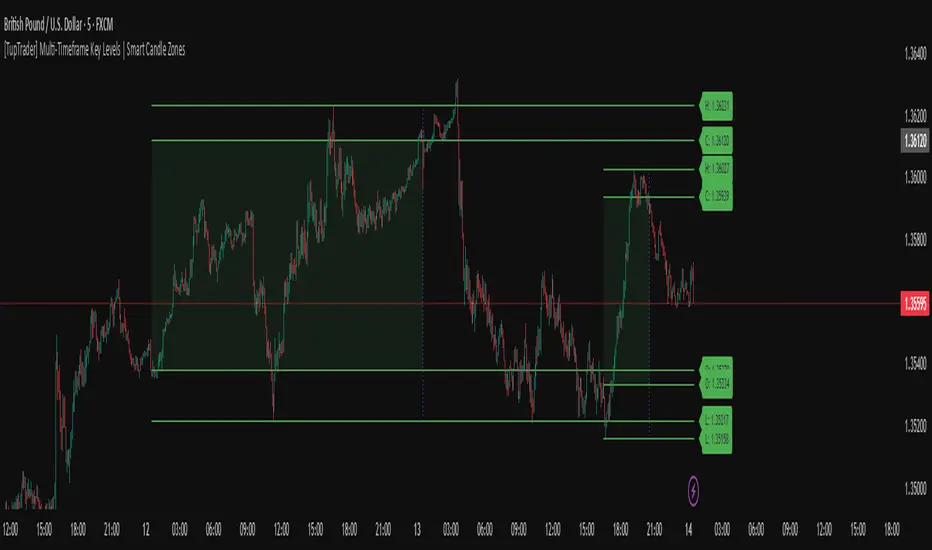
[TupTrader] Multi-Timeframe Key Levels | Smart Candle Zones
**Multi-Timeframe Key Levels | Smart Candle Zones**
Unlock the power of smart price levels with Multi-Timeframe Key Levels – a precision tool for traders who rely on higher timeframe structure.
🧠 This indicator automatically plots the key levels (Open, High, Low, Close) and optional body/fibonacci levels of the *previous candle* from two customizable higher timeframes, directly onto your lower timeframe chart.
💡 Recommended settings:
- 4H + Daily on 5-Minute Chart
- 8H + 1H on 1-Minute Chart
📈 Ideal for:
- Scalping around structure levels
- Day trading with HTF context
- Confirmation of breakout, retest, or rejection patterns
✅ Features:
- Dual reference timeframes
- Auto-adjusting line lengths
- Live price labels (e.g. H: 4321.50)
- Choice between body or Fibonacci zones
- Candle box visualization of HTF structure
🚨 Alerts:
- Alert when price touches any HTF key level
Lightweight and customizable, this tool is a must-have for intraday and structure-based traders.
[blackcat] L3 Smart Money FlowCOMPREHENSIVE ANALYSIS OF THE L3 SMART MONEY FLOW INDICATOR
🌐 OVERVIEW:
The L3 Smart Money Flow indicator represents a sophisticated multi-dimensional analytics tool combining traditional momentum measurements with advanced institutional investor tracking capabilities. It's particularly effective at identifying large-scale capital movement dynamics that often precede significant price shifts.
Core Objectives:
• Detect subtle but meaningful price action anomalies indicating major player involvement
• Provide clear entry/exit markers based on multiple validated criteria
• Offer risk-managed positioning strategies suitable for various account sizes
• Maintain operational efficiency even during high volatility regimes
THEORETICAL BACKDROP AND METHODOLOGY
🎓 Conceptual Foundation Principles:
Utilizes Time-Varying Moving Averages (TVMA) responding adaptively to changing market states
Implements Extended Smoothing Algorithm (XSA) providing enhanced filtration characteristics
Employs asymmetric weight distribution favoring recent price observations over historical ones
→ Analyzes price-weighted closing prices incorporating volume influence indirectly
← Applies Asymmetric Local Maximum (ALMA) filters generating institution-specific trends
⟸ Combines multiple temporal perspectives producing robust directional assessments
✓ Calculates normalized momentum ratios comparing current state against extended range extremes
✗ Filters out insignificant fluctuations via double-stage verification process
⤾ Generates actionable alerts upon exceeding predefined significance boundaries
CONFIGURABLE PARAMETERS IN DEPTH
⚙️ Input Customization Options Detailed Explanation:
Temporal Resolution Control:
→ TVMA Length Setting:
Minimum value constraint ensuring mathematical validity
Higher numbers increase smoothing effect reducing reaction velocity
Lower intervals enhance responsiveness potentially increasing noise exposure
Validation Threshold Definition:
↓ Bull-Bear Boundary Level:
Establishes fundamental acceptance/rejection zones
Typically set near extreme values reflecting rare occurrence probability
Can be adjusted per instrument liquidity profiles if necessary
ADVANCED ALGORITHMIC PROCEDURES BREAKDOWN
💻 Internal Operation Architecture:
Base Calculations Infrastructure:
☑ Raw Data Preparation and Normalization
☐ High/Low/Closing Aggregation Processes
☒ Range Estimation Algorithms
Intermediate Transform Engine:
📈 Momentum Ratio Computation Workflow
↔ First Pass XSA Application Details
➖ Second Stage Refinement Mechanics
Final Output Synthesis Framework:
➢ Composite Reading Compilation Logic
➣ Validation Status Determination Process
➤ Alert Trigger Decision Making Structure
INTERACTIVE VISUAL INTERFACE COMPONENTS
🎨 User Experience Interface Elements:
🔵 Plotting Series Hierarchy:
→ Primary FundFlow Signal: White trace marking core oscillator progression
↑ Secondary Confirmation Overlay: Orange/Yellow highlighting validation status
🟥 Risk/Reward Boundaries: Aqua line delineating strategic areas requiring attention
🏷️ Interactive Marker System:
✔ "BUY": Green upward-pointing labels denoting confirmed long entries
❌ "SELL": Red downward-facing badges signaling short setups
PRACTICAL APPLICATION STRATEGY GUIDE
📋 Operational Deployment Instructions:
Strategic Planning Initiatives:
• Define precise profit targets considering realistic reward/risk scenarios
→ Set maximum acceptable loss thresholds protecting available resources adequately
↓ Develop contingency plans addressing unexpected adverse developments promptly
Live Trading Engagement Protocols:
→ Maintaining vigilant monitoring of label placement activities continuously
↓ Tracking order fill success rates across implemented grids regularly
↑ Evaluating system effectiveness compared alternative methodologies periodically
Performance Optimization Techniques:
✔ Implement incremental improvements iteratively throughout lifecycle
❌ Eliminate ineffective component variations systematically
⟹ Ensure proportional growth capability matching user needs appropriately
EFFICIENCY ENHANCEMENT APPROACHES
🚀 Ongoing Development Strategy:
Resource Management Focus Areas:
→ Minimizing redundant computation cycles through intelligent caching mechanisms
↓ Leveraging parallel processing capabilities where feasible efficiently
↑ Optimizing storage access patterns improving response times substantially
Scalability Consideration Factors:
✔ Adapting to varying account sizes/market capitalizations seamlessly
❌ Preventing bottlenecks limiting concurrent operation capacity
⟹ Ensuring balanced growth capability matching evolving requirements accurately
Maintenance Routine Establishment:
✓ Regular codebase updates incorporation keeping functionality current
↓ Periodic performance audits conducting verifying continued effectiveness
↑ Documentation refinement updating explaining any material modifications made
SYSTEMATIC RISK CONTROL MECHANISMS
🛡️ Comprehensive Protection Systems:
Position Sizing Governance:
∅ Never exceed predetermined exposure limitations strictly observed
± Scale entries proportionally according to available resources carefully
× Include slippage allowances within planning stages realistically
Emergency Response Procedures:
↩ Well-defined exit strategies including trailing stops activation logic
🌀 Contingency plan formulation covering worst-case scenario contingencies
⇄ Recovery procedure documentation outlining restoration steps methodically
