Multi Type RSI [Misu]█ This Indicator is based on RSI ( Relative Strength Index ) & multiple type of MA (Moving Average) to show different variations of RSI.
The relative strength index (RSI) is a momentum indicator used in technical analysis to evaluate overvalued or undervalued conditions in the price of that security.
█ Usages:
The purpose of this indicator is to obtain the RSI calculated with different MAs modes instead of the classic RMA.
The red and green zones indicate the oversold and overbought zones.
Buy or sell signals are marked by the green and red circles
We have 2 different signal modes : when the different size RSIs cross and when the fast RSI crosses the extreme bands.
Alerts are setup.
█ Parameters:
Lenght RSI: The lenght of the RSI. (14 by default)
RSI MA Type: The type of MA with which the rsi will be calculated. ("SMA", "EMA", "SMMA (RMA)", "WMA", "VWMA")
Fast Lenght MA: The fast lenght smoothing MA.
Slow Lenght MA: The Slow lenght smoothing MA.
Lower Band: The lenght of the lower band. (25 by default)
Upper Band: The lenght of the upper band. (75 by default)
Signal Type: The mode with which buy and sell signals are triggered. ("Cross 2 Mas", "Cross Ma/Bands")
"rsi" için komut dosyalarını ara

RSI Stochastic AlignmentRSI Stochastic Alignment input RSI and Stochastic into 1 windows and align them to find bullish and bearish divergence.
A. The Line display in windows:
1. Fast RSI (green line) is RSI(close,3)
2. Slow Rsi (red line) is Linear Regession of Fast RSI with 5 period and offset 0 = linreg(rsi,5,0)
3. Fast Stochastic (blue line) is %K of Stochastic
4. Slow Stochastic (aqua line) is %D of Stochastic
B. Alignment and Divergence Detect
1. Bearish Divergence:
* Slow RSI at top
* Fast Stochastic at bottom
* Fast RSI over overbought level (default = 70)
* Slow Stochastic under overbought level minus a constant value (Divergence Power value, default this value = 1)
2. Bullish Divergence:
* Fast Stochastic at top
* Slow RSI at bottom
* Fast RSI under oversold level (default = 30)
* Slow Stochastic over oversold level plus a constant value (Divergence Power value, default this value = 1)
C. Script Option
1. RSI value adjustable
2. Stochastic value adjustable
3. Overbought and Oversold Level adjustable
4. Enable/Disable Level line
5. Enable/Disable Divergence Column
6. Enable/Disable Key Bar Colored

Stoch + RSI DashboardIndicator Description
MTF Stochastic + RSI Dashboard FLEX with STRONG Alerts
A compact, multi-timeframe dashboard that shows Stochastic %K/%D, RSI and signal states across user-defined timeframes. Columns can be toggled on/off to keep the panel as small as you need. Signal texts and colors are fully customizable. The table can be placed in any chart corner, and the background color & opacity are adjustable for perfect readability.
What it shows
• For each selected timeframe: %K, %D, a signal cell (Bullish/Bearish/Strong), RSI value, and RSI state (Overbought/Oversold/Neutral).
• Timeframes are displayed as friendly labels (e.g., 60 → 1h, W → 1w, 3D → 3d).
Signals & logic
• Bullish/Bearish when %K and %D show a sufficient gap (or an optional confirmed cross).
• Strong Bullish when both %K and %D are below the “Strong Bullish max” threshold.
• Strong Bearish when both %K and %D are above the “Strong Bearish min” threshold.
• Optional confirmation: RSI < 30 for Strong Bullish, RSI > 70 for Strong Bearish.
Alerts
• Global alerts for any selected timeframes when a STRONG BULLISH or STRONG BEARISH event occurs.
Key options
• Column visibility toggles (TF, %K, %D, Signal, RSI, RSI Status).
• Custom signal texts & colors.
• Dashboard position: top-left / top-right / bottom-left / bottom-right.
• Table background color + opacity (0 = opaque, 100 = fully transparent).
• Sensitivity (minimum %K–%D gap) and optional “cross-only” mode.
• Customizable timeframes for display and for alerts.
Default settings
• Stochastic: K=5, D=3, SmoothK=3
• RSI length: 14
• Decimals: 1
• Strong Bullish max: 20
• Strong Bearish min: 80
• Default TFs & alerts: 3m, 15m, 1h, 3h, 6h, 12h, 1d, 3d, 1w

RSI Divergence Indicator + Current Value - YOSIRSI Divergence Indicator – TradingView
The RSI Divergence Indicator is a custom TradingView tool designed to detect and visualize both regular and hidden divergences between price action and the Relative Strength Index (RSI).
🔹 Core Features:
Plots RSI with standard overbought (70), oversold (30), and midline (50) levels.
Highlights regular bullish divergence (price makes lower low, RSI makes higher low).
Highlights regular bearish divergence (price makes higher high, RSI makes lower high).
Detects hidden bullish divergence (price higher low, RSI lower low).
Detects hidden bearish divergence (price lower high, RSI higher high).
Clear visual signals using colored markers and labels (“Bull”, “Bear”, “H Bull”, “H Bear”).
Built-in alert conditions to notify traders when new divergences appear.
🔹 Customization:
Adjustable RSI period and source (default: 14, close).
Configurable pivot lookback (left & right) for fine-tuning divergence detection.
Options to enable/disable plotting of specific divergence types.
Custom colors for bullish, bearish, hidden bullish, and hidden bearish signals.
🔹 Added Upgrade (based on your request):
Displays the current RSI value next to the line, allowing quick reference without hovering.

Apex Edge - RSI Trend LinesThe Apex Edge - RSI Trend Lines indicator is a precision tool that automatically draws real-time trendlines on the RSI oscillator using confirmed pivot highs and lows. These dynamic trendlines track RSI structure in motion, helping you anticipate breakout zones, reversals, and hidden divergences.
Every time a new pivot forms, the indicator automatically re-draws the RSI trendline between the two most recent pivots — giving you an always-current view of momentum structure. You’ll instantly see when RSI begins compressing or expanding, long before price reacts.
Key Features: • Dynamic RSI trendlines drawn from the last 2 pivots
• Auto re-draws in real-time as new pivots form
• Optional "Full Extend" or "Pivot Only" modes
• Slope color-coded: green = support, red = resistance
• Built-in dotted RSI levels (30/70 default)
• Alert conditions for RSI trendline breakout signals
• Ideal for spotting divergence, compression, and early SMC confluence
This is not your average RSI — it’s a fully reactive momentum edge overlay designed to give you clarity, structure, and timing from within the oscillator itself. Perfect for traders using Smart Money Concepts, divergence setups, or algorithmic trend tracking.
⚔️ Built for precision. Built for edge. Built for Apex.

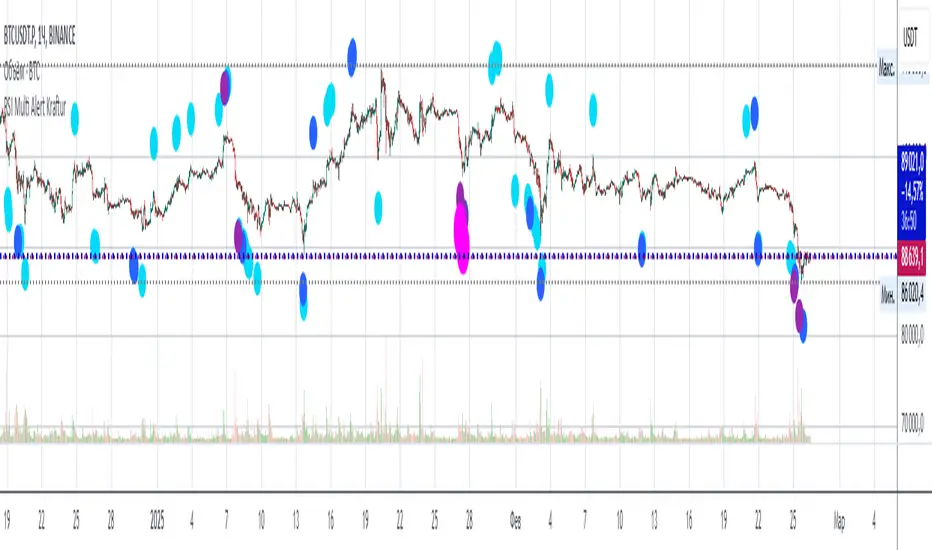
RSI Multi Alert KrafturRSI Multi Alert Kraftur
Description
The "RSI Multi-Level Signals" indicator is designed to help traders identify potential buy and sell opportunities based on RSI (Relative Strength Index) crossings of multiple customizable levels. Unlike traditional RSI indicators that focus on single overbought/oversold thresholds (e.g., 70/30), this script stands out by offering four distinct buy and sell levels for enhanced flexibility and precision. It plots signals directly on the price chart and provides real-time alerts when RSI crosses these levels, making it a powerful tool for spotting entry and exit points.
Key Features
Multi-Level RSI: Configurable buy levels (e.g., 30, 25, 20, 15) and sell levels (e.g., 70, 75, 80, 85) to capture varying degrees of overbought and oversold conditions.
Visual Signals: Buy signals are marked with circles below the bars, and sell signals above the bars, each color-coded for easy identification.
Real-Time Alerts: Generates alerts once per bar when RSI crosses a level, with a filter to prevent duplicate signals during oscillations.
Customizable: Adjustable RSI length, timeframe, and level colors to suit different trading strategies.
Recommended Usage
This indicator is best used as a scanning tool for finding entry points across multiple assets. Set up alerts for your entire watchlist of coins or stocks to detect when RSI crosses the configured levels in real time. It’s particularly effective in volatile markets or for traders employing multi-timeframe analysis. Combine it with other indicators (e.g., support/resistance or trend filters) to confirm signals and improve accuracy.
How to Use
Apply the indicator to your chart.
Customize the RSI length, timeframe, and signal levels to match your trading style.
Set up alerts for the indicator and apply them to your watchlist of assets.
Monitor the chart for buy (green) and sell (red) signals, or rely on alert notifications.
Perfect for scalpers, swing traders, or anyone looking to automate signal detection across a portfolio!
RSI Divergences (Regular, Hidden, Exaggerated)RSI Divergences (Regular, Hidden, Exaggerated)
This indicator detects and visually highlights all major types of RSI divergences on your chart: Regular, Hidden, and Exaggerated divergences, both bullish and bearish.
Key Features:
Calculates RSI based on a user-defined length and timeframe that automatically matches your chart's timeframe.
Identifies pivot highs and lows on both price and RSI using customizable pivot left/right bars.
Detects divergences when RSI and price movements disagree, signaling potential trend reversals or continuation.
Differentiates between three types of divergences:
Regular Divergence: Classic signal for possible trend reversal.
Hidden Divergence: Often indicates trend continuation.
Exaggerated Divergence: A less common form signaling momentum changes.
Draws clear colored lines and labels on the RSI pane for each divergence, using green for bullish and red for bearish signals.
Includes RSI overbought (70) and oversold (30) bands with gradient fills to help visualize RSI zones.
Efficient use of arrays to track pivots and manage plotting history for smooth performance.
Usage:
Ideal for traders looking to leverage RSI divergences for better timing entries and exits in trending and range-bound markets. The script is fully customizable and works seamlessly across different timeframes

Multifactor Buy/Sell Strategy V2 | RSI, MACD, ATR, EMA, Boll.BITGET:1INCHUSDT
This Pine Script code for TradingView is a multifactor Buy/Sell indicator that combines several technical factors to generate trading signals based on trend, volatility, and volume conditions. Here’s a breakdown of the main components and functionality:
Indicator Name
- Multifactor Buy/Sell Strategy V2 — an overlay indicator applied directly on the price chart.
### Input Parameters
The script includes multiple customizable parameters:
- RSI, EMA, MACD parameters — for setting periods and signals of MACD and RSI.
- ATR and Bollinger Bands — used for volatility analysis and level determination.
- Minimum Volatility Threshold — sets a minimum Bollinger Band width threshold for determining high volatility.
Core Indicators
1. RSI — calculated to identify oversold (below 30) and overbought (above 70) conditions.
2. EMA and MACD — calculates exponential moving averages and MACD histogram to determine trend direction.
3. ATR and Bollinger Bands — used to assess current volatility and establish dynamic upper and lower bands.
Volatility and Volume Analysis
- Determines the current ATR level and Bollinger Band width to evaluate high volatility.
- Calculates the volume moving average to track periods of increased volume during high volatility.
Trend Analysis
The script uses the difference between fast and slow EMAs to define strong trends:
- Uptrend — when the fast EMA is above the slow EMA, the price is above the fast EMA, and the trend is strong.
- Downtrend — when the fast EMA is below the slow EMA, the price is below the fast EMA, and the trend is strong.
Momentum Filter
- Based on the price change over the last three bars and compared against the minimum volatility threshold to identify strong momentum.
Buy and Sell Signal Generation
- Buy Signal: Uptrend with RSI oversold, positive MACD histogram, high volatility and volume, strong momentum, and sufficient Bollinger Band width.
- Sell Signal: Downtrend with RSI overbought, negative MACD histogram, high volatility and volume, strong momentum, and sufficient Bollinger Band width.
Visualization
- Buy and sell signals are displayed as green and red triangles on the chart.
- Plots for fast and slow EMAs, upper and lower bands, and Bollinger Bands.
Alerts
The script includes alert conditions for buy and sell signals, allowing notifications to be sent via email or mobile app.
Information Panel
A small table on the chart displays current volatility dataThis Pine Script code for TradingView is a multifactor Buy/Sell indicator that combines several technical factors to generate trading signals based on trend, volatility, and volume conditions. Here’s a breakdown of the main components and functionality:
Indicator Name
- Multifactor Buy/Sell Strategy V2 — an overlay indicator applied directly on the price chart.
Input Parameters
The script includes multiple customizable parameters:
- **RSI, EMA, MACD parameters** — for setting periods and signals of MACD and RSI.
- **ATR and Bollinger Bands** — used for volatility analysis and level determination.
- **Minimum Volatility Threshold** — sets a minimum Bollinger Band width threshold for determining high volatility.
Core Indicators
1. RSI — calculated to identify oversold (below 30) and overbought (above 70) conditions.
2. EMA and MACD — calculates exponential moving averages and MACD histogram to determine trend direction.
3. ATR and Bollinger Bands — used to assess current volatility and establish dynamic upper and lower bands.
Volatility and Volume Analysis
- Determines the current ATR level and Bollinger Band width to evaluate high volatility.
- Calculates the volume moving average to track periods of increased volume during high volatility.
Trend Analysis
The script uses the difference between fast and slow EMAs to define strong trends:
- Uptrend — when the fast EMA is above the slow EMA, the price is above the fast EMA, and the trend is strong.
- Downtrend — when the fast EMA is below the slow EMA, the price is below the fast EMA, and the trend is strong.
Momentum Filter
- Based on the price change over the last three bars and compared against the minimum volatility threshold to identify strong momentum.
Buy and Sell Signal Generation
- Buy Signal: Uptrend with RSI oversold, positive MACD histogram, high volatility and volume, strong momentum, and sufficient Bollinger Band width.
- Sell Signal: Downtrend with RSI overbought, negative MACD histogram, high volatility and volume, strong momentum, and sufficient Bollinger Band width.
Visualization
- Buy and sell signals are displayed as green and red triangles on the chart.
- Plots for fast and slow EMAs, upper and lower bands, and Bollinger Bands.
Alerts
The script includes alert conditions for buy and sell signals, allowing notifications to be sent via email or mobile app.
Information Panel
A small table on the chart displays current volatility
- Volatility Status — indicates high or low volatility.
- Bollinger Band Width — current width as a percentage.
- ATR Ratio — ratio of current ATR to long-term average ATR.
This script is suitable for trading in high-volatility conditions, combining multiple filters and factors to generate precise buy and sell signals.

RSI + Psy + ADXRSI + Psychological Line + ADX (with RCI-replacement logic)
This custom TradingView indicator combines three major technical analysis tools—RSI, Psychological Line (Psy), and ADX—to help traders identify trend strength, market momentum, and overbought/oversold conditions with improved clarity.
1. Multi-Period RSI
The indicator calculates three RSI values:
Short-term RSI (9)
Mid-term RSI (26)
Long-term RSI (52)
These help users observe short-, mid-, and long-term momentum simultaneously.
Threshold lines are drawn at 70, 50, and 30 for standard RSI overbought/oversold analysis.
2. Psychological Line (Psy) with Dynamic Column Display
The Psy indicator counts how many closes within the selected period (default: 12) were higher than the previous close.
Values above 75 indicate overbought markets.
Values below 25 indicate oversold markets.
When Psy crosses these thresholds, it is displayed as a column chart centered at 50, visually expanding upward (overbought) or downward (oversold).
3. ADX Trend Strength with Color Coding
ADX is calculated from DI+ and DI− values (using true range and directional movement).
The ADX line changes color based on trend strength:
Blue: Weak trend (below 20)
Yellow: Moderate trend (20–30)
Red: Strong trend (above 30)
This helps traders easily recognize when the market transitions from low-volatility to strong-trend conditions.

RSI Hybrid + EMA Cloud + Swings(15m/2H)RSI Hybrid + EMA Cloud (15m Trend + 2H Momentum)
A dual-timeframe trading system combining fast 15-minute trend structure with higher-timeframe 2-Hour momentum, volume and structural levels.
🧩 What This Indicator Does
This tool blends:
🔹 15m Trend (EMA Cloud) – 2 Points
EMA 7 vs 21 → Short trend
EMA 30 vs 74 → Long trend
Cloud shading highlights bullish/bearish alignment
Faster, intraday trend sensitivity
🔹 2H Momentum (RSI Hybrid) – 3 Points
RSI > 50
RSI > SMA(4)
RSI > SMA(12)
Gives short / medium / long momentum confirmation from the higher timeframe.
🔹 2H Volume Pressure – 1 Point
Volume vs 20-SMA
Mild / Moderate / Strong Bull/Bear
Confirms true participation behind price moves
⭐ Score System (0–6 Total)
Component Points
15m EMA Trend 2
2H RSI Hybrid 3
2H Volume Power 1
Total 6
Interpretation:
5–6 → High-confluence direction
3–4 → Partial confluence
1–2 → Weak bias
0 → No reliable direction
Designed for discretionary and semi-systematic intraday traders.
📊 15m Structural Levels
Includes:
✔ Last confirmed 15m Swing High / Swing Low
Based on close-price pivots, not highs/lows.
✔ Live Running High since last Swing LOW
Tracks how far price has extended upward.
✔ Live Running Low since last Swing HIGH
Tracks downward extension after a swing high.
✔ ATR(15m)
Volatility reference for SL/TP or risk modeling.
These levels help in timing entries, managing stops, and identifying breakout/breakdown zones.
🖥 On-Chart Info Table
Summarizes:
15m EMA short & long trend
2H RSI short/medium/long momentum
RSI vs 50
2H volume power
Bull & Bear score (with breakdown)
Last 15m swing highs/lows
ATR(15m)
Color-coded for clarity
💡 Why Use This Indicator
High-speed 15m trend detection
Higher-TF 2H momentum & volume confirmation
Multi-layered bias presented in a simple score
Built-in structure for more intelligent entries/exits
Works on indices, stocks, FX, crypto
Ideal for intraday traders who want speed + reliability

RSI-GringoRSI-Gringo — Stochastic RSI with Advanced Smoothing Averages
Overview:
RSI-Gringo is an advanced technical indicator that combines the concept of the Stochastic RSI with multiple smoothing options using various moving averages. It is designed for traders seeking greater precision in momentum analysis, while offering the flexibility to select the type of moving average that best suits their trading style.
Disclaimer: This script is not investment advice. Its use is entirely at your own risk. My responsibility is to provide a fully functional indicator, but it is not my role to guide how to trade, adjust, or use this tool in any specific strategy.
The JMA (Jurik Moving Average) version used in this script is a custom implementation based on publicly shared code by TradingView users, and it is not the original licensed version from Jurik Research.
What This Indicator Does
RSI-Gringo applies the Stochastic Oscillator logic to the RSI itself (rather than price), helping to identify overbought and oversold conditions within the RSI. This often leads to more responsive and accurate momentum signals.
This indicator displays:
%K: the main Stochastic RSI line
%D: smoothed signal line of %K
Upper/Lower horizontal reference lines at 80 and 20
Features and Settings
Available smoothing methods (selectable from dropdown):
SMA — Simple Moving Average
SMMA — Smoothed Moving Average (equivalent to RMA)
EMA — Exponential Moving Average
WMA — Weighted Moving Average
HMA — Hull Moving Average (manually implemented)
JMA — Jurik Moving Average (custom approximation)
KAMA — Kaufman Adaptive Moving Average
T3 — Triple Smoothed Moving Average with adjustable hot factor
How to Adjust Advanced Averages
T3 – Triple Smoothed MA
Parameter: T3 Hot Factor
Valid range: 0.1 to 2.0
Tuning:
Lower values (e.g., 0.1) make it faster but noisier
Higher values (e.g., 2.0) make it smoother but slower
Balanced range: 0.7 to 1.0 (recommended)
JMA – Jurik Moving Average (Custom)
Parameters:
Phase: adjusts responsiveness and smoothness (-100 to 100)
Power: controls smoothing intensity (default: 1)
Tuning:
Phase = 0: neutral behavior
Phase > 0: more reactive
Phase < 0: smoother, more delayed
Power = 1: recommended default for most uses
Note: The JMA used here is not the proprietary version by Jurik Research, but an educational approximation available in the public domain on TradingView.
How to Use
Crossover Signals
Buy signal: %K crosses above %D from below the 20 line
Sell signal: %K crosses below %D from above the 80 line
Momentum Strength
%K and %D above 80: strong bullish momentum
%K and %D below 20: strong bearish momentum
With Trend Filters
Combine this indicator with trend-following tools (like moving averages on price)
Fast smoothing types (like EMA or HMA) are better for scalping and day trading
Slower types (like T3 or KAMA) are better for swing and long-term trading
Final Tips
Tweak RSI and smoothing periods depending on the time frame you're trading.
Try different combinations of moving averages to find what works best for your strategy.
This indicator is intended as a supporting tool for technical analysis — not a standalone decision-making system.

Daksh RSI POINT to ShootHere are the key points and features of the Pine Script provided:
### 1. **Indicator Settings**:
- The indicator is named **"POINT and Shoot"** and is set for non-overlay (`overlay=false`) on the chart.
- `max_bars_back=4000` is defined, indicating the maximum number of bars that the script can reference.
### 2. **Input Parameters**:
- `Src` (Source): The price source, default is `close`.
- `rsilen` (RSI Length): The length for calculating RSI, default is 20.
- `linestylei`: Style for the trend lines (`Solid` or `Dashed`).
- `linewidth`: Width of the plotted lines, between 1 and 4.
- `showbroken`: Option to show broken trend lines.
- `extendlines`: Option to extend trend lines.
- `showpivot`: Show pivot points (highs and lows).
- `showema`: Show a weighted moving average (WMA) line.
- `len`: Length for calculating WMA, default is 9.
### 3. **RSI Calculation**:
- Calculates a custom RSI value using relative moving averages (`ta.rma`), and optionally uses On-Balance Volume (`ta.obv`) if `indi` is set differently.
- Plots RSI values as a green or red line depending on its position relative to the WMA.
### 4. **Pivot Points**:
- Utilizes the `ta.pivothigh` and `ta.pivotlow` functions to detect pivot highs and lows over the defined period.
- Stores up to 10 recent pivot points for highs and lows.
### 5. **Trend Line Drawing**:
- Lines are drawn based on pivot highs and lows.
- Calculates potential trend lines using linear interpolation and validates them by checking if subsequent bars break or respect the trend.
- If the trend is broken, and `showbroken` is enabled, it draws dotted lines to represent these broken trends.
### 6. **Line Management**:
- Initializes multiple lines (`l1` to `l20` and `t1` to `t20`) and uses these lines for drawing uptrend and downtrend lines.
- The maximum number of lines is set to 20 for uptrends and 20 for downtrends, due to a limit on the total number of lines that can be displayed on the chart.
### 7. **Line Style and Color**:
- Defines different colors for uptrend lines (`ulcolor = color.red`) and downtrend lines (`dlcolor = color.blue`).
- Line styles are determined by user input (`linestyle`) and use either solid or dashed patterns.
- Broken lines use a dotted style to indicate invalidated trends.
### 8. **Pivot Point Plotting**:
- Plots labels "H" and "L" for pivot highs and lows, respectively, to visually indicate turning points on the chart.
### 9. **Utility Functions**:
- Uses helper functions to get the values and positions of the last 10 pivot points, such as `getloval`, `getlopos`, `gethival`, and `gethipos`.
- The script uses custom logic for line placement based on whether the pivots are lower lows or higher highs, with lines adjusted dynamically based on price movement.
### 10. **Plotting and Visuals**:
- The main RSI line is plotted using a color gradient based on its position relative to the WMA.
- Horizontal lines (`hline1` and `hline2`) are used for visual reference at RSI levels of 60 and 40.
- Filled regions between these horizontal lines provide visual cues for potential overbought or oversold zones.
These are the main highlights of the script, which focuses on trend detection, visualization of pivot points, and dynamic line plotting based on price action.

RSI Dashboard Monitor [Skiploss]RSI Dashboard Monitor is indicator for scanner Relative Strength Index ( RSI ) for 4 symbols and 10 Timeframe, detached from the main chart.
You can choose to display all 4 symbols or just 1 symbol, also can choose resolution (TF). Still, these 10 timeframes should be enough to use. Default is set to 14 but you can modify it from settings.
How it work??
RSI >= 75 : Fill color maximum overbought
RSI >= 65 : Fill color medium overbought
RSI >= 55 : Fill color minimum overbought
RSI >= 45 : Fill color minimum overbought
RSI >= 35 : Fill color medium overbought
RSI >= 25 : Fill color maximum overbought
** Values level and color style can modify it from settings

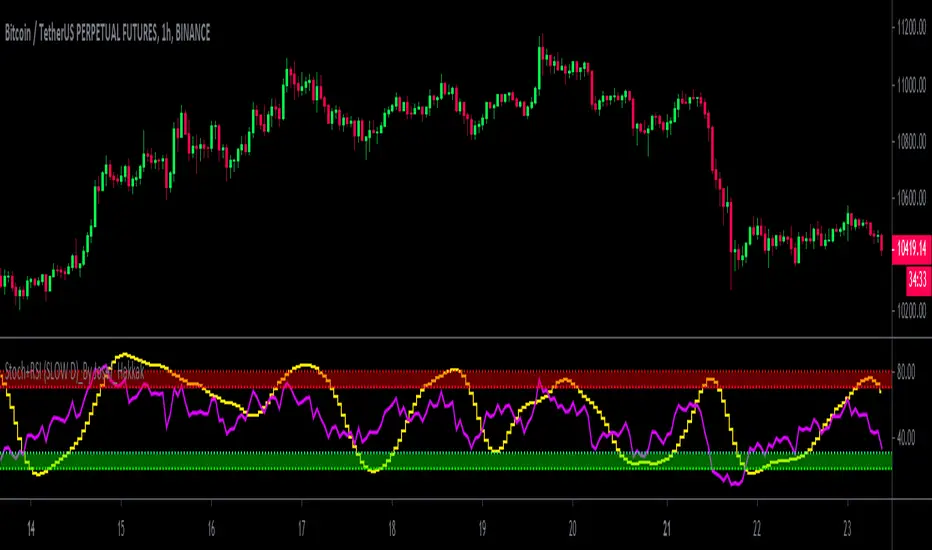
Stoch+RSI (SLOW D)_By Josef_HakkakStoch+RSI (SLOW D)_By Josef_Hakkak
Stochastic and RSI by SLOW D%
-> How to use:
B UY = When the yellow line (D of Slow Stoch ) goes out of the green range, it is better that the purple line ( RSI ) is be low
SELL = When the yellow line (D of Slow Stoch ) goes out of the red range, it is better to have the purple line ( RSI ) is be high
This script was previously written by RRanjanFX and has now been edited by me and changes have been made to optimize for shorter timeframes.
Edited and updated and optimized from:
RRanjanFX
Many thanks and loyal to RRanjanFX
RSI + Psy + ADX P2RSI + Psy + ADX
This indicator combines multi-length RSI analysis with the Psychological Line (PSY) and ADX trend strength to highlight reversal zones, emotional extremes, and trend conditions in a single unified panel.
🔹 Features
1️⃣ Triple RSI with Dynamic Colors
Displays Short / Mid / Long RSI values (9 / 26 / 52 by default)
Line color changes based on RSI levels:
🔴 Overbought (above 68)
🟢 Oversold (below 32)
⚪ Neutral market conditions
Fixed zone levels at 70 / 50 / 30 for simple visual analysis
2️⃣ Psychological Line (PSY) Extreme Signal
Measures the percentage of bearish candles in the selected period
Only highlights emotional extremes (overbought & oversold conditions)
Red/Green histogram makes market sentiment easy to read
3️⃣ ADX Trend Strength Detector
Confirms trend momentum using ADX
Color-coded levels:
🔵 Weak trend
🟡 Moderate trend
🔴 Strong trend (possible trend continuation)
Helps avoid counter-trend trades during strong momentum
4️⃣ RSI Background Highlight (Mid-term RSI Only)
Background turns RED in overbought area
Background turns GREEN in oversold area
Provides fast and clean recognition of reversal zones
🎯 Best Uses
Identifying low-risk reversal entry zones
Avoiding entries against strong trends
Confirming momentum and sentiment alignment
Useful for scalping, day-trading, and swing-trading strategies
💡 Tip
For higher precision, combine this indicator with:
🔹 Support/Resistance Levels
🔹 Candlestick Reversal Patterns
🔹 Volume Spikes or Breakout Tools

RSI, CCI, ADX Panel (Custom TF for Each)RSI, CCI, and ADX Combined – Multi-Timeframe, Fully Customizable Panel Indicator for TradingView
Overview
This Pine Script indicator integrates the Relative Strength Index (RSI), Commodity Channel Index (CCI), and Average Directional Index (ADX) into a single, clean panel for effortless technical analysis. Each indicator operates independently, with customizable length, smoothing, and time frame for maximum flexibility. Traders can now monitor momentum, trend strength, and overbought/oversold conditions across different time frames—all in one place.
Key Features
Independent Controls: Set length, smoothing (ADX), and time frame individually for each indicator via the settings panel.
Multi-Timeframe Support: Each oscillator (RSI, CCI, ADX) can be calculated on its own time frame, enabling nuanced inter-timeframe analysis.
Customizable Visualization: Adjust line color and thickness for each indicator to match your chart style.
Clean, Non-Overlay Display: All three indicators are plotted in a dedicated panel beneath the price chart, reducing clutter.
Reference Levels: Includes standard reference lines for oversold/overbought (RSI, CCI) and trend threshold (ADX) for quick visual cues.
Usage Ideas
Swing Trading: Compare short- and long-term momentum using different time frames for RSI, CCI, and ADX.
Trend Confirmation: Use ADX to filter RSI and CCI signals—only trade overbought/oversold conditions during strong trends.
Divergence Hunting: Spot divergences between time frames for early reversal signals.
Scalping: Set RSI and CCI to lower time frames for entry, while monitoring higher timeframe ADX for trend context.
How to Install
Paste the script into the Pine Editor on TradingView.
Add to chart. Adjust settings as desired.
Save as a template for quick reuse on any chart—all your custom settings will be preserved.
Customization
Edit lengths and time frames in the indicator’s settings dialog.
Toggle reference lines on/off as needed.
Fine-tune line appearance (color, thickness) for clarity.
Note:
This indicator does not provide automated buy/sell signals. It is a customizable analytical tool for manual or semi-automated trading. Use in combination with other technical or fundamental analysis for best results.
Combine Momentum, Trend, and Volatility—Seamlessly and Visually—With One Indicator.

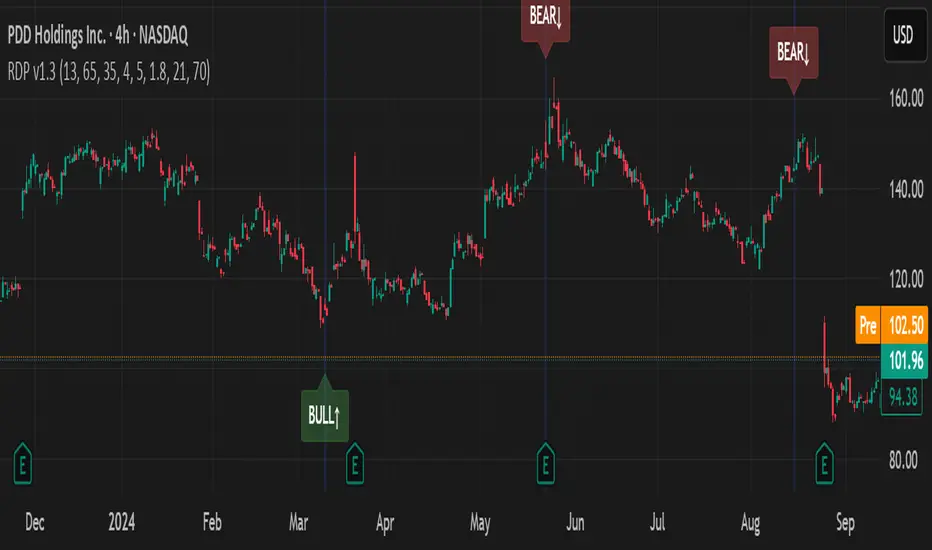
RSI Divergence Pro+ VolumeRSI Divergence Pro+ Volume
What It Does:
RSI Divergence Pro+ Volume is a non-repainting indicator that helps traders spot potential bullish and bearish reversal zones using a classic technical analysis concept—RSI divergence—combined with advanced volume confirmation. The script highlights moments when price and RSI disagree, filtering for signals only when there is a significant volume spike, which helps reduce false positives in quiet or illiquid markets.
How It Works:
Bullish Divergence: Triggered when price makes a lower low but RSI forms a higher low, suggesting possible exhaustion in selling pressure.
Bearish Divergence: Triggered when price makes a higher high but RSI forms a lower high, signaling potential buying exhaustion.
Volume Confirmation: Signals only appear when trading volume exceeds a dynamic threshold (based on a user-defined moving average and multiplier), making alerts more reliable.
Visual Features: Customizable labels and optional gradient highlights mark the exact bars where divergence with volume confirmation occurs, making signals easy to see.
Alert System: Built-in alerts for both bullish and bearish divergences so traders can receive instant notifications.
How to Use:
Apply the script to any timeframe or liquid asset (15m–4H recommended for best results).
Watch for green “BULL↑” labels below bars (bullish divergence) and red “BEAR↓” labels above bars (bearish divergence).
Blue/violet background highlights confirm volume-verified signals.
Combine with your own risk management and confirmation tools for trade entries/exits.
Adjust lookback and volume settings to match your asset and style.
Originality & Usefulness:
This indicator stands out by combining traditional RSI divergence with advanced volume filtering, giving more credible and actionable reversal alerts. All logic is non-repainting and calculated on closed bars only. Settings are fully grouped and customizable, with professional visuals for clarity.
Limitations & Disclaimers:
Not every divergence results in a major reversal—use with other analysis.
More effective in trending or volatile markets; may produce more false signals in choppy/range conditions.
Signals are generated on bar close and do not repaint.
No indicator is a substitute for proper trading discipline and risk management.
BUY/SELL RSI FLIUX v1.0The "BUY/SELL RSI FLUX v1.0" indicator is designed to provide buy and sell signals based on the RSI (Relative Strength Index) and price action in relation to support and resistance levels. It overlays directly on the price chart and includes the following components:
- Support and Resistance Levels: Determined over a specified number of bars (lengthSR), these levels represent potential barriers where price action may stall or reverse.
- ATR (Average True Range): Used to measure market volatility. While it's calculated in the script, it's not visualized on the chart as per the latest modification.
- RSI: The RSI is calculated over a defined period (lengthRSI) and is used to identify overbought or oversold conditions. Buy signals are generated when the RSI is below the oversold threshold (rsiOversold) and the price is above the support level. Conversely, sell signals occur when the RSI is above the overbought threshold (rsiOverbought), the price is below the resistance level, and additionally, the price is below a long-term moving average, which acts as a trend filter.
- Long-Term Moving Average: This moving average is plotted to help identify the prevailing market trend. Sell signals are filtered based on the price's position in relation to this moving average.
- Buy/Sell Signals: Visual representations in the form of shapes are plotted below (for buy) or above (for sell) the price bars to indicate potential entry points.
By combining these elements, the indicator aims to provide high-probability trading signals that align with both the market's momentum and trend.

DW-RSI EMA with EMA of RSIThis is an RSI Oscillator with an EMA of the RSI for a signal line. The RSI line is Green when above the signal line and Red when below the signal line.
This does not use the traditional 30% / 70% over sold / over bought analysis. Therefore the levels are not shown.
The analysis is this:
When the RSI is above the signal line then price has a bullish bias.
When the RSI is below the signal line then price has a bearish bias.
I wrote use this for Forex Spot Currencies where I feel overbought and oversold may be less valid than it may be in other markets such as stocks.
As with all indicators, do not use as your sole reason to enter the market, but use with other indicators or price action signals to get a confluence of signals to confirm your entry.
I use it with an 8, 21 and 50 EMA to confirm entry and exit. I give it more weight for exits than I do for entries.

RSI with Visual Buy/Sell Setup | Corrective/Impulsive IndicatorRSI with Visual Buy/Sell Setup | 40-60 Support/Resistance | Corrective/Impulsive Indicator v2.15
|| RSI - The Complete Guide PDF ||
Modified Zones with Colors for easy recognition of Price Action.
Resistance @ downtrend = 60
Support @ uptrend = 40
Over 70 = Strong Bullish Impulse
Under 30 = Strong Bearish Impulse
Uptrend : 40-80
Downtrend: 60-20
--------------------
Higher Highs in price, Lower Highs in RSI = Bearish Divergence
Lower Lows in price, Higher Lows in RSI = Bullish Divergence
--------------------
Trendlines from Higher/Lower Peaks, breakout + retest for buy/sell setups.
###################
There are multiple ways for using RSI, not only divergences, but it confirms the trend, possible bounce for continuation and signals for possible trend reversal.
There's more advanced use of RSI inside the book RSI: The Complete Guide
Go with the force, and follow the trend.
"The Force is more your friend than the trend"

VCAI Stochastic RSI+VCAI Stoch RSI+ is a cleaned-up Stochastic RSI built with V-Core colours for faster, clearer momentum reads and more reliable OB/OS signals.
What it shows:
Purple %K line → bearish momentum strengthening
Yellow %D line → bullish momentum building and smoothing
Soft purple/yellow background bands → OB/OS exhaustion zones, not just raw 80/20 triggers
Midline at 50 → balance point where momentum shifts between bull- and bear-side control
Optional HTF mode → run Stoch RSI from any timeframe while viewing it on your current chart
How to read it:
Both lines rising out of OS → early bullish shift; pullbacks that hold direction favour continuation
Both lines falling from OB → early bearish shift; bounces into the purple OB zone can become fade setups
Lines stacked and moving together → strong, cleaner momentum
Lines crossing repeatedly → low-conviction, choppy conditions
OB/OS shading highlights exhaustion so you focus on moves with context, not every 80/20 tick
Why it’s different:
Classic Stoch RSI is hyper-sensitive and mostly noise.
VCAI Stoch RSI+ applies V-Core’s colour-driven regime logic, controlled OB/OS shading, and optional HTF smoothing so you see momentum structure instead of clutter — making it easier to judge when momentum is genuinely shifting and when it’s just another wiggle.

RSI 20/80 Arrows + AlertsRSI 20/80 Arrows + Alerts
This indicator is a modified Relative Strength Index (RSI) tool designed to help traders spot potential overbought and oversold conditions using customizable threshold levels (default 80 for overbought, 20 for oversold).
Features:
Custom RSI Levels – Default to 80/20 instead of the standard 70/30, but fully adjustable by the user.
Visual Signals –
Blue Arrow Up appears below the bar when RSI crosses up from below the oversold level (potential buy zone).
Red Arrow Down appears above the bar when RSI crosses down from above the overbought level (potential sell zone).
Alerts Built In – Receive notifications when either signal occurs, with the option to confirm signals only on bar close for reduced noise.
Guide Levels – Optionally display overbought/oversold reference lines on the chart for quick visual reference.
Overlay Mode – Signals are plotted directly on the price chart, so you don’t need to switch between chart windows.
Use Case:
Ideal for traders who want quick, visual confirmation of potential turning points based on RSI, especially in strategies where more extreme levels (like 20/80) help filter out weaker signals. Works well across all markets and timeframes.

RSI Zones - Directional Entry Strict RSI Zones – Directional Entry Tool (Modified RSI)
This is a simple modification of the standard RSI indicator. I’ve added two custom horizontal lines at the 60–65 and 35–40 zones to help spot momentum shifts and potential reversal points.
60–65 zone: When RSI returns here from above 65, it often signals weakening bullish momentum — useful for spotting short opportunities.
35–40 zone: When RSI returns here from below 35, it can indicate momentum loss on the downside — good for potential long setups.
This version helps traders filter out weak signals and avoid chasing extreme moves.
It works best when combined with price action, structure, or divergence.
Only 2 lines were added to the default RSI for better zone awareness. Everything else remains unchanged.
