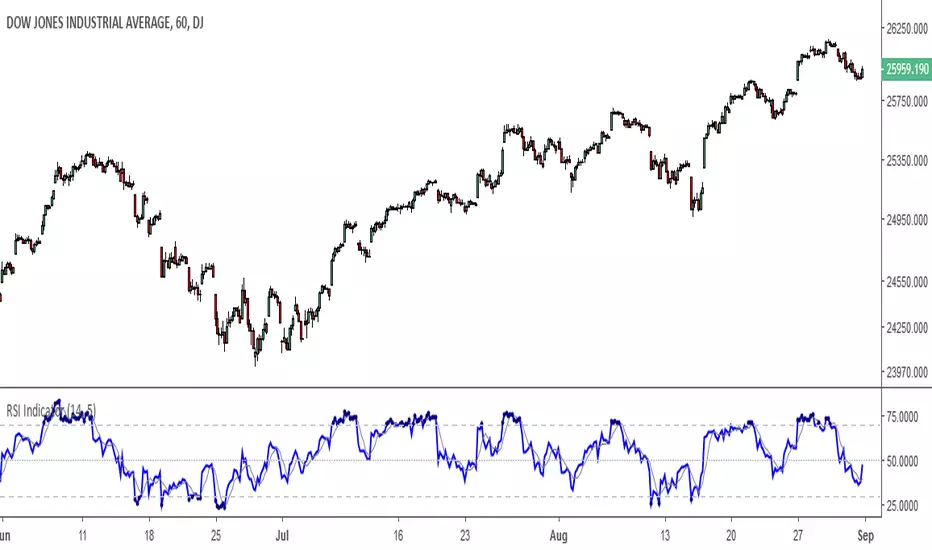
RSI Indicator (basic)Basic RSI indicator, formatted a little differently from the built-in one. Includes an optional signal line, as well as optional highlighting of overbought/oversold values with dots.
"rsi" için komut dosyalarını ara
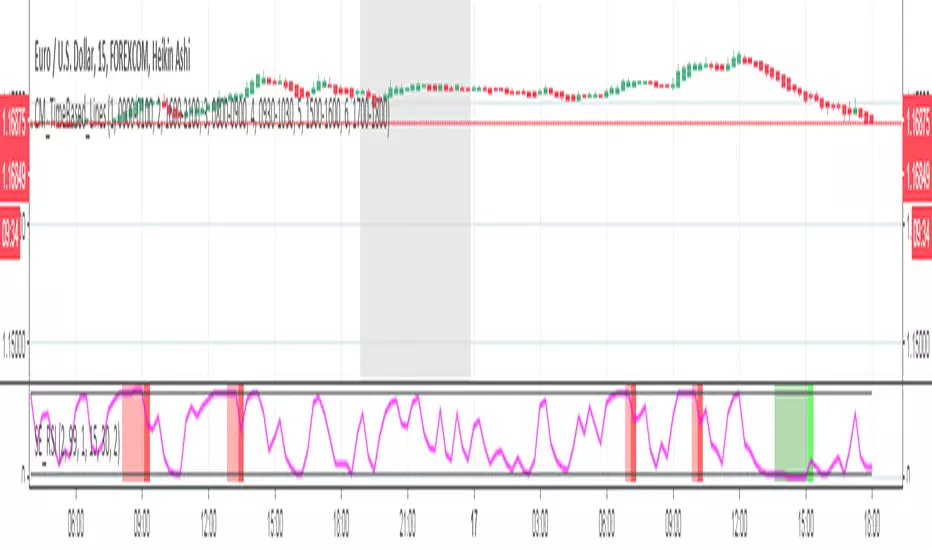
RSI or MFI %BPlot where RSI or MFI is in its Bollinger Bands . Can be used in many different way: as a trend indicator (above below 0.5), part of a trend following strategy when crossing above 0 (resume bullish trend ) or crossing below 1 (resume bearish trend ), also useful for divergences, etc...


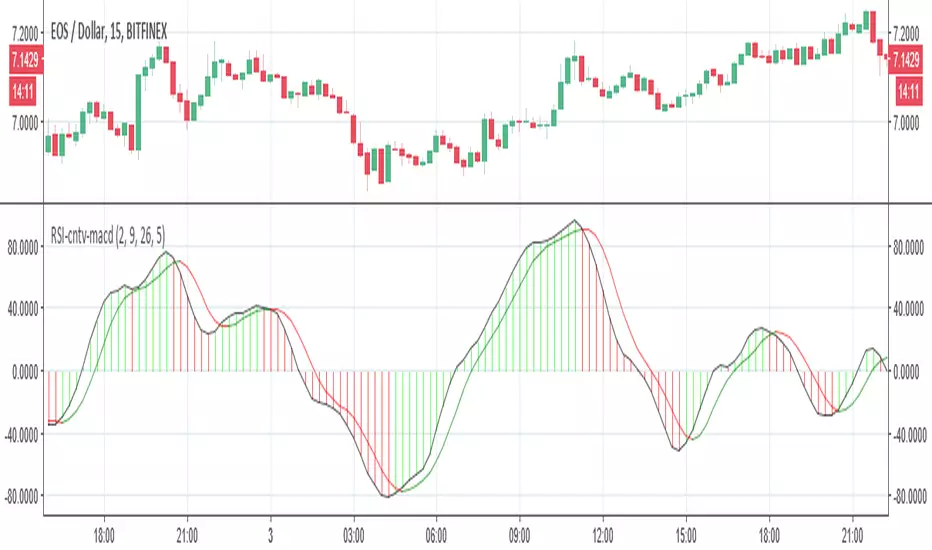
RSI-cumulative net volume as MACDSo here in this model I take the RSI-cumulative net volume and convert it to MACD
I think it look nicer then original but it just idea:)
for different time frame just change setting:)


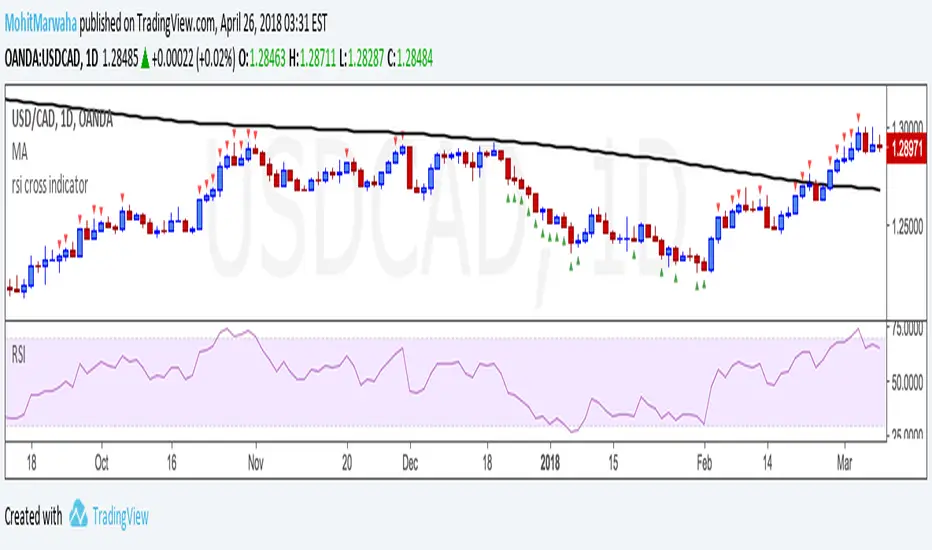
rsi cross indicatorNeat little RSI oversold and overbought markers above and below the bars. Helps visually identify whether the indicator is in overbought or oversold conditions.

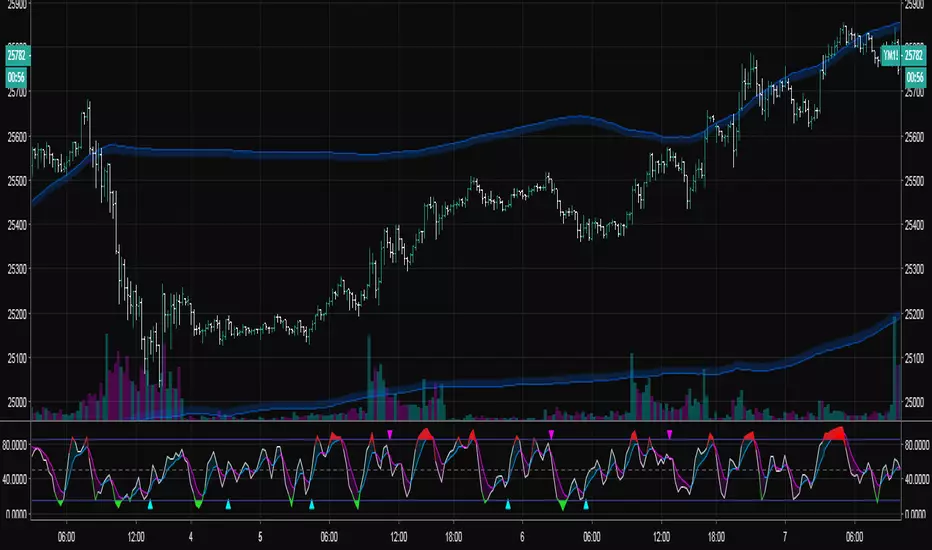
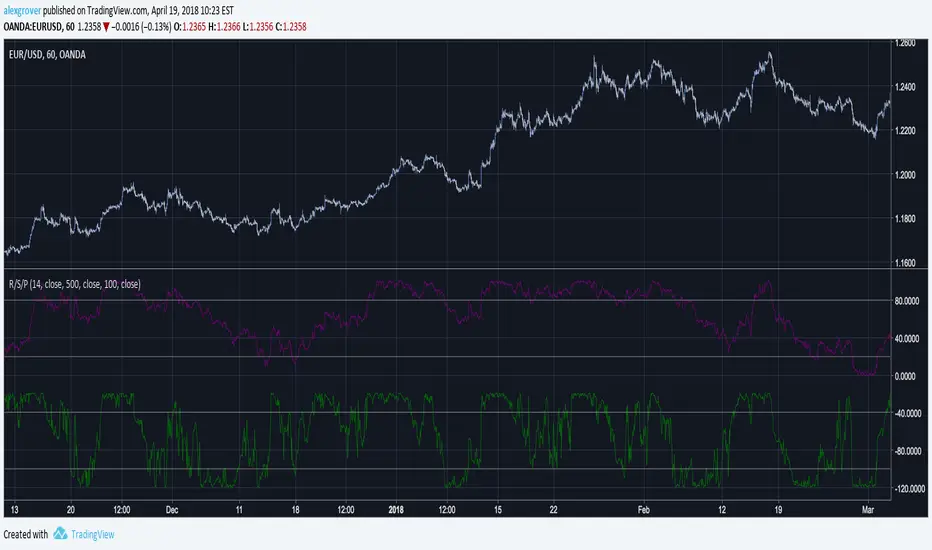
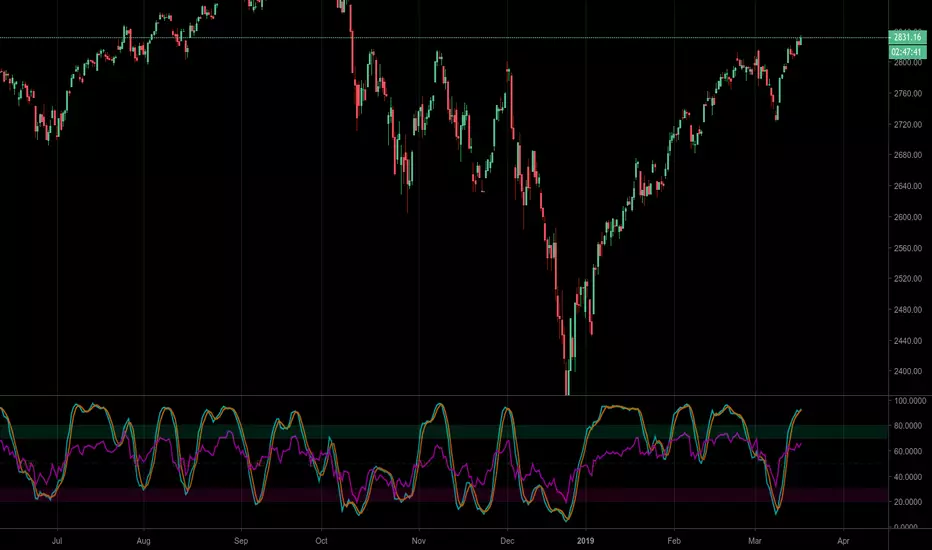
RSI/Stochastic/Percentrank all on chart and all in oneThe limitation of max 3 indicators on tradingview is pretty bad for indicators lovers (like me) so i made this script able to contain a rsi, a stochastic and a percent rank and that in only one indicator !! Pretty cool isn't it ? ;)
Every parameter is linked to one indicator, you can have all of them with differents period lengths
You have the possibility to disable each indicators and add clarity to the chart.
Do you want me to add more indicators ? If yes witch ? Comment bellow :D
Hope this help

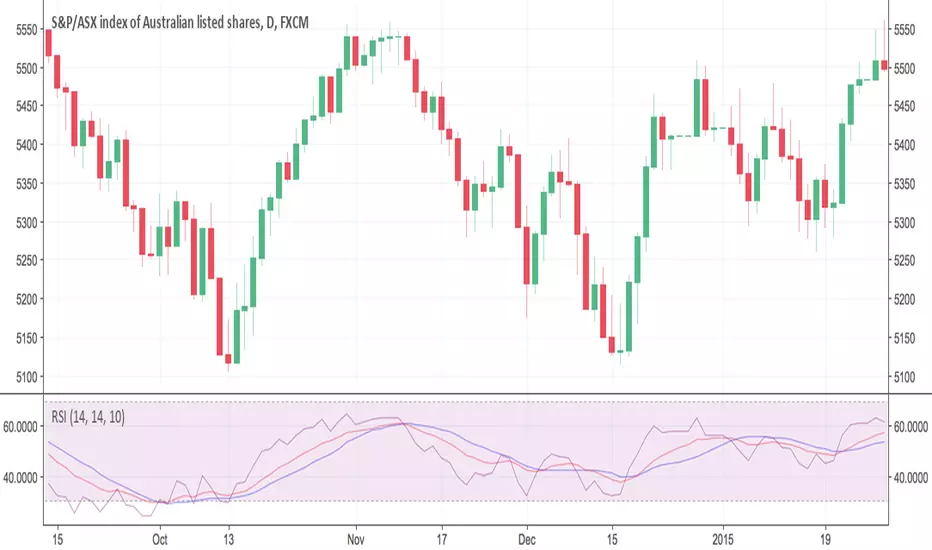
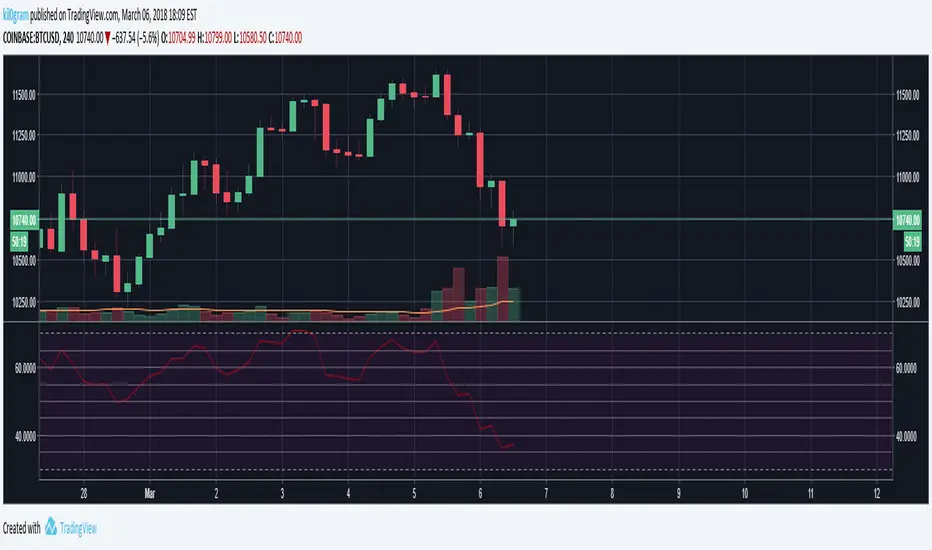
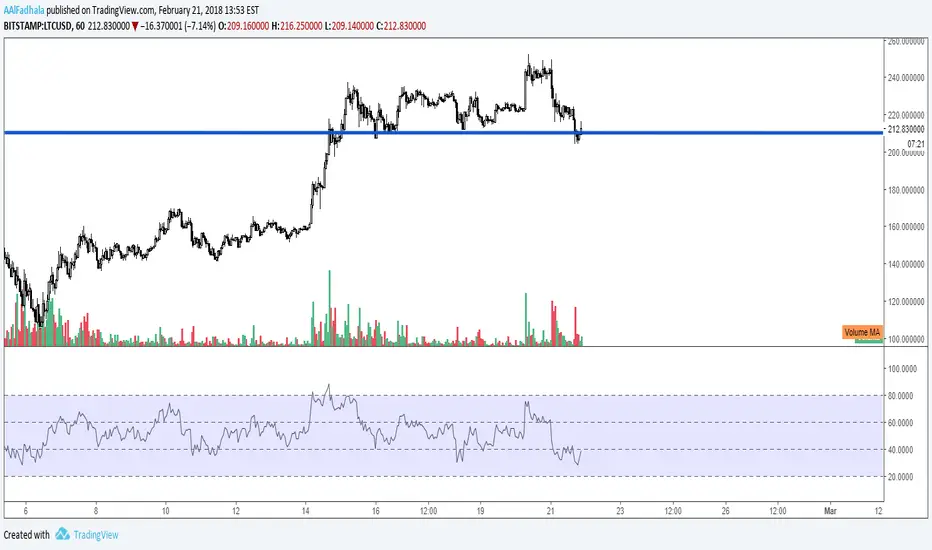
RSI with ChannelsThis is basically the default RSI indicator with lines drawn on increments of 5, nothing special really.
This can be used in crypto/forex/traditional markets.
Please let me know if you found this to be useful and/or if you think it could use some additional work. Thanks!
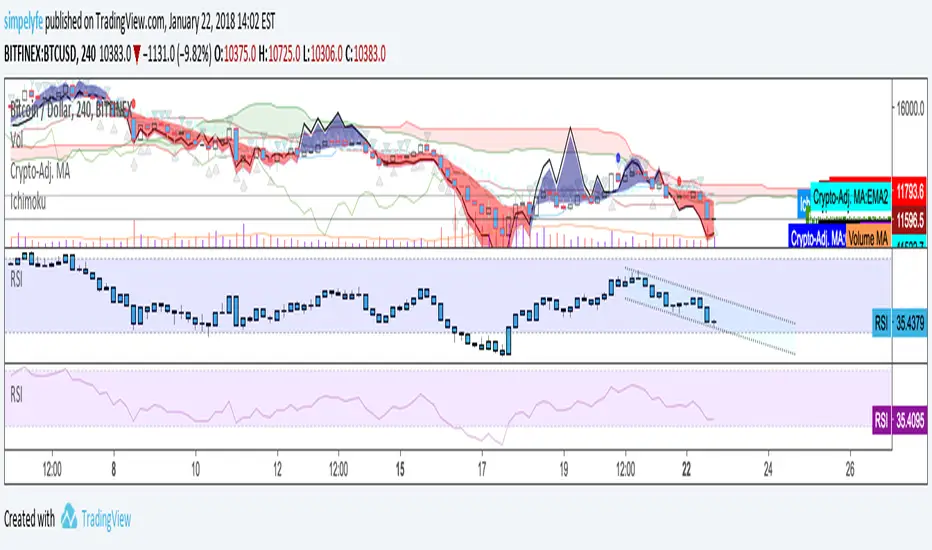
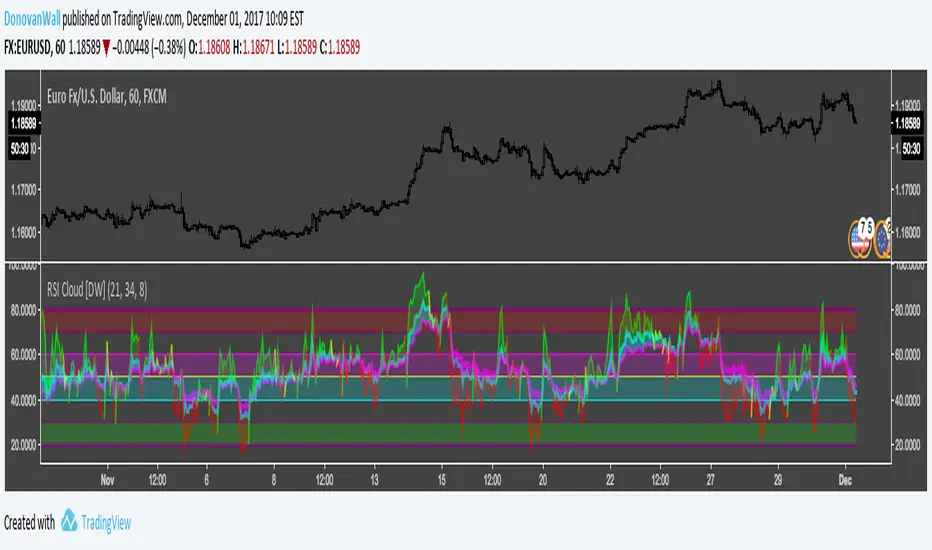
RSI Cloud [DW]This is a simple experimental study utilizing multiple RSIs and their divergences to visualize price activity.
RSI/MFI with Volatility Bands [GVD]This is an edit of the LAzyBear script.
The script is adjusted to show both the RSI and the MFI on 1 chart.