Session RangeThis Pine Script™ code is subject to the terms of the Mozilla Public License 2.0 at mozilla.org
This script plots the high and low price ranges for up to four customizable trading sessions directly on your chart. It is designed to help traders visualize price activity during specific trading hours.
Features
Customizable Sessions: Define up to four distinct trading sessions using the input.session parameter.
Visual Highlights: Each session range is highlighted with customizable colors for top and bottom lines as well as a fill between them.
Historical Ranges: Option to show historical session ranges with adjustable opacity.
Toggle Sessions: Enable or disable the display of specific trading sessions to tailor your analysis.
Overlay on Chart: The script works as an overlay, ensuring your analysis stays on the main chart.
How It Works:
Session Setup: Input the start and end times for each session in the Session 1, Session 2, Session 3, and Session 4 fields.
Dynamic Range Calculation: The script automatically calculates the high and low during active sessions, updating the range as new data comes in.
Customizable Colors: Adjust the colors for lines, fills, and historical ranges to match your charting style.
Clean Presentation: The script is designed to avoid clutter by limiting overlays to active and relevant sessions only.
Identify price action trends during key trading hours.
Compare ranges between multiple sessions for market behavior analysis.
Highlight significant session overlaps or range extensions.
Disclaimer :
This script is intended for educational purposes and should not be considered financial advice. Trading involves risks, and past performance does not guarantee future results.
"range" için komut dosyalarını ara

Viper Futures Range Bar CandlesThe Range Bars used in more Professional trading platforms to keep smoothness on the charts and help make custom range price candles based on the range size chosen for the market being traded. Example an 8 Range bar on the ES or MES Futures is 8 ticks = 2 points. Another Example on NQ a 22 Range bar popularly traded by trading professionals is a total of 22 ticks = 5 1/2 points on the Nasdaq or Micro NQ futures. Simple add to charge, set the range bar setting with a particular range setting in mind and then for clarity uncheck the original price chart on top left corner, same way you would disable an indicator temporarily. Works very clear and nice. A good accommodation for trading View as trading view does not offer historical tick data to use Renko bars very well at the moment.
Basically plots a candle rather then a OHLC bar for Range Bars on TV!
Default color was set to my Viper Futures Chart, you can change back to green/red, etc.
Enjoy!
Strategy: Range BreakoutWhat?
In the price action, levels have a significant role to play. Based on the price moving above/below the levels - the underlying instrument shows some price-action in the direction of breakout/breakdown.
There are plenty of ways level can be determined. Levels are the decision point to take a trade or not. But if we make the level derivation complex, then the execution may get hamper.
This strategy script, developed in PineScript v5, is our attempt at solving this problem at the core by providing this simple, yet elegant solution to this problem.
It's essentially an attempt to Trade Simple by drawing logical (horizontal) lines in the chart and take actions, after multiple associated parameters confirmation, on the breakout / breakdown of the levels.
How?
Let us explain how we are drawing the levels.
We are depending on some of the parameters as described below:
Open Range : During intraday movement, often if prices move beyond a particular level, it exibits more movement in the same swing in same direction. We found out, through our back testing for Indian Indices like NSE:NIFTY , NSE:BANKNIFTY or NSE:CNXFINANCE the first 15m (i.e 09:15 AM to 09:30 AM, IST) is one of such range. For Indian stocks, it is 9:15 to 9:45. And for MCX MCX:CRUDEOIL1! it's 5:00 pm to 6:00 pm. There are our first levels.
PDHCL : Previous Day High, Close, Low. This is our next level
VWAP : The rolling VWAP (volume weighted average price)
In the breakout/breakdown of the Open Range and Previous Day High/Low, we are taking the trade decisions as follows using CEST principle:
C onditions :
If current bar's (say you are in 5m timeframe) closing is broken out the Open Range High or Previous Day High, taken a Buy/Long decision (let's say buying a Call Option CE or selling a Put Option PE or buying the future or cash).
If current bar's (say you are in 5m timeframe) closing is broken down the Open Range Low or Previous Day Low, taken a Sell/Short decision (let's say buying a Put Option CE or selling a Call Option PE or selling the future or cash).
Additionally, and optionally (default ON, one can turn off): we are checking various other associated multiple confirmations as follows:
1. Momentum : Checking 14-period RSI value is more than 50 or less than 50 (all parameters like period, OB, OS ranges are configurable through settings)
2. Current bar's volume is more than the last 20 bars volume average. How much more - that multiplier is also configurable. (default is 1)
3. The breakout candle is bullish (green) or bearish (red).
E ntry :
All of these happens only on the closing of the candle . Means: Non Repainting! .
Clearly in the chart we are showing as green up arrow BO (breakout for buy) and red down arrow BD (breakdown for sell) to take your decision process smooth.
So, on the closing of the decision BO/BD candle we are entering the trade (with a thumping heart and nail biting ...)
S top Loss :
We are relying on the time tasted (last 40 years) mechanism of Average True Range (ATR) of default 14 period. This default period is also configurable.
So for Long trades: the 14 period ATR low band is the SL.
For Short trades: the 14 period ATR high band is the SL.
T arget :
We are depending on the thump rule of 1:2 Risk Reward. It's simple and effective. No fancy thing. We are closing the trade on double the favorable price movement compared to the SL placed. Of course, this RR ratio is confiurable from the settings, as usual.
What's Unqiue in it?
The utter simplicity of this trading mechanism. No fancy things like complex chart pattern, OI data, multiple candlestick patterns, Order flow analysis etc.
Simple level determination,
Marking clearly in the chart.
Making each parameter configurable in Settings and showing tooltip adjacent to the parameter to make you understand it better for your customization,
Wait for the candle close, thus eliminating the chances of repainting menace (as much as possible)
Additional momentum and volume check to trade entry confirmation.
Works with normal candlestick (nothing special ones like HA ...)
Showing everything as a Summary Table (which, again can be turned off optionally) overlaying at the bottom-right corner of the chart,
Optionally the Summary Table can be configured to alert you back (say you get it notified in your email or SMS).
That way, a single, simple, effective trade setup will ease your journey as smooth sail as possible.
Mentions
There are plenty of friends from whom time to time we borrowed some of the ideas while working closely together over last one year.
From tradingview community, we took the spirit of @zzzcrypto123 awesome work done long back (in 2020) as the indicator "ORB - Opening Range Breakout". (We tried to reach him for his explicit consent, unable to catch hold of him).
Some other publicly available materials we have consulted to get the additional checks (like RSI, volume).
Lat word
Use it please and thank you for your constant patronage in following us in this awesome platform. Let's keep growing together.
Disclaimer :
This piece of software does not come up with any warrantee or any rights of not changing it over the future course of time.
We are not responsible for any trading/investment decision you are taking out of the outcome of this indicator.

Quantum Range Filter by MRKcoin### Quantum Range Filter by MRKcoin
**Overview**
This indicator is a sophisticated range detection tool designed based on the principles of quantitative multi-factor models. Instead of relying on a single condition, it assesses the market from three different dimensions to provide a more robust and reliable identification of range-bound (sideways) markets.
When the background is highlighted in red, it indicates that the market is likely in a range phase, suggesting that trend-following strategies may be less effective, and mean-reversion (range trading) strategies could be more suitable.
---
**Core Logic: A Multi-Factor Approach**
The filter evaluates the market state using the following three independent factors:
1. **Momentum Volatility (RSI Bollinger Bandwidth):**
* **Question:** Is the momentum of the market contracting?
* **Method:** It measures the width of the Bollinger Bands applied to the RSI. A narrow bandwidth suggests that momentum is consolidating, which is a common characteristic of a range market.
2. **Price Volatility (ATR Ratio):**
* **Question:** Is the actual price movement shrinking?
* **Method:** It calculates the Average True Range (ATR) as a percentage of the closing price. A low ratio indicates that the price volatility itself is low, reinforcing the case for a range environment.
3. **Absence of Trend (ADX):**
* **Question:** Is there a lack of a clear directional trend?
* **Method:** It uses the Average Directional Index (ADX), a standard tool for measuring trend strength. A low ADX value provides active confirmation that the market is not in a trending phase.
---
**How to Use**
1. **Range Detection:** The primary use is to identify ranging markets. The red highlighted background serves as a visual cue.
2. **Strategy Selection:**
* **Inside the Red Zone:** Consider using range-trading strategies (e.g., buying at support, selling at resistance, using oscillators like RSI or Stochastics for overbought/oversold signals). Avoid using trend-following indicators like moving average crossovers, as they are prone to generating false signals in these conditions.
* **Outside the Red Zone:** The market is likely trending. Trend-following strategies are more appropriate.
3. **Parameter Tuning (In Settings):**
* **This is the key to adapting the filter to any market or timeframe.** Different assets (like BTC vs. ETH) and different timeframes have unique volatility characteristics. Don't hesitate to adjust the parameters to fit the specific chart you are analyzing.
* **Range Detection Score:** This is the most important setting. It determines how many of the three factors must agree to classify the market as a range. The default is `2`, which provides a good balance.
* If the filter seems **too sensitive** (highlighting too often), increase the score to `3`.
* If the filter seems **not sensitive enough** (missing obvious ranges), decrease the score to `1`.
* **Factor Thresholds:** For fine-tuning, adjust the thresholds for each factor.
* **`RSI BB Width Threshold`:** If you want to detect even tighter momentum consolidations, *decrease* this value.
* **`ATR Ratio Threshold`:** If you want to be stricter about price volatility, *decrease* this value.
* **`ADX Threshold`:** To be more lenient on what constitutes a "trendless" market, *increase* this value (e.g., to 30). To be stricter, *decrease* it (e.g., to 20).
* **Pro Tip:** Use the Debug Table (uncomment it in the script's code) to see the live values of each factor. This will give you a clear idea of how to set the thresholds for the specific asset you are trading.
**Disclaimer**
This indicator is a tool to assist in market analysis and should not be used as a standalone signal for making financial decisions. Always use it in conjunction with your own trading strategy, risk management, and analysis. Past performance is not indicative of future results.
**Credits**
* **Concept & Vision:** MRKcoin

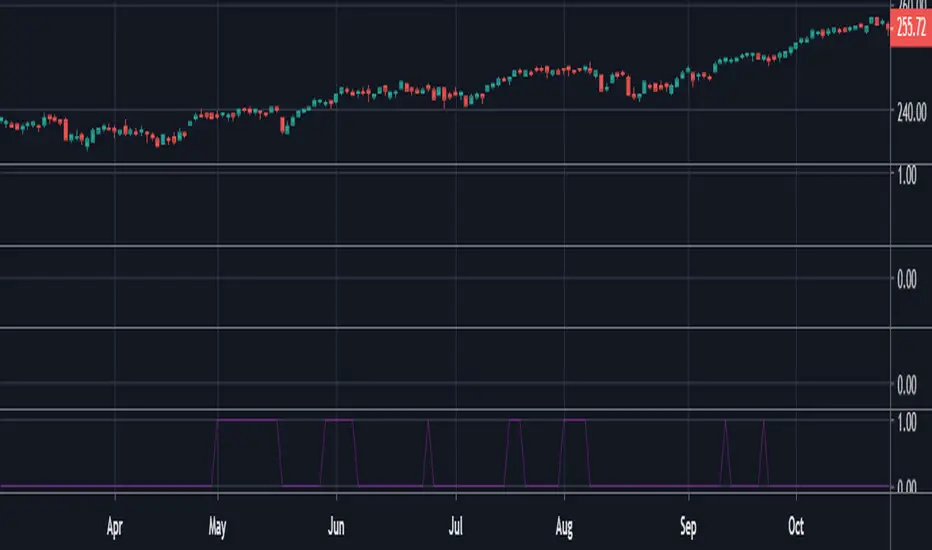
Trading Range Indicator - TRISimple script made to identify trading ranges in any timeframe
The oscillator bounces between 1 and 0. 1 means that the current asset is in a trading range and 0 meaning it is not.
The determination of a trading range is determined by the following:
ATR(14)40 and RSI<60
ADX<25
Due to all 3 having to be fulfilled in order for the oscillator to show there is a trading range, this causes a problem where 2 of the conditions are fulfilled and therefore still shows 0 on the oscillator, however, the asset could very well be in a trading range.
So what in the world do you use this for if there is such a significant margin of error?
Since all 3 conditions need to be fulfilled in order for it to be considered a trading range, this gives a very strong indicator of said trading ranges. So if a person is looking at individual stock tickers or the SPY index ticker, then when the oscillator reads a 1, it could be ideal to open an Iron Condor on said ticker. This means that this indicator is not well suiting for traditional long and short stock positions, but rather it is made for options traders who by using an Iron Condor can make money of a range-bound market.
Session Range Breakouts With Targets [AlgoAlpha]⛓️💥Session Range Breakouts With Targets 🚀
Introducing the "Session Range Breakouts With Targets" indicator by AlgoAlpha, a powerful tool for traders to capitalize on session-based range breakouts and identify precise target zones using ATR-based calculations! Whether you trade the Asian, American, European, or Oceanic sessions, this script highlights key breakout levels and targets that adapt to market volatility, ensuring you're always prepared for those crucial price movements. 🕒📊
Session-based Trading : The indicator highlights session-specific ranges, offering clear breakouts for Asian, American, European, Oceanic, and even custom sessions 🌍.
Adaptive Volatility Zones : Uses ATR to determine dynamic zone widths, filtering out fakeouts and adjusting to market conditions ⚡.
Precise Take-Profit Targets : Set multiple levels of take-profits based on ATR multipliers, ensuring you can manage both aggressive and conservative trades 🎯.
Customizable Appearance : Tailor the look with customizable colors for session highlights and breakout zones to fit your chart style 🎨.
Alerts on Key Events : Built-in alert conditions for breakouts and take-profit hits, so you never miss a trading opportunity 🔔.
🚀 Quick Guide to Using the Indicator
🛠 Add the Indicator : Add the indicator to favorites by pressing the star icon. Choose your session (Asia, America, Europe, Oceana, or Custom) and adjust the ATR length, zone width multiplier, and target multipliers to suit your strategy.
📊 Analyze Breakouts : Watch for the indicator to plot upper and lower range boxes based on session highs and lows. Price breaking through these boxes will signal a potential entry.
📈 Monitor Targets : Track bullish and bearish targets as price moves, with up to three take-profit levels based on ATR multipliers.
🔔 Set Alerts : Enable alerts for session breakouts or when price hits your designated take-profit targets.
🔍 How It Works
This script operates by identifying session-specific ranges based on highs and lows from the beginning of the selected session (Asia, America, Europe, or others). After a user-defined wait period (default: 120 bars), it calculates the highest and lowest points and creates upper and lower zones using the Average True Range (ATR) to adapt to market volatility. If the price breaks above or below these zones, it is identified as a breakout, and the script dynamically calculates up to three take-profit targets for both bullish and bearish scenarios using an ATR multiplier. The indicator also includes alerts for breakouts and take-profit hits, providing real-time trading signals.

TradeChartist Range Bands ™TradeChartist Range Bands is an exceptionally well designed Entry/Exit indicator that plots fluid Range Bands and dynamic Support/Resistance levels on chart, along with trade entries by using both trend following and mean reversion principles.
===================================================================================================================
How does ™TradeChartist Range Bands work?
The Indicator plots Range Bands with Upper, Lower and Mean, calculated using trading models that use both Trend Following and Mean Reversion principles . It is the Range Bands that decide the trade Entries as the breakouts above upper band generates long entries and the breakouts below the lower band generates the short entries.
The Range Bands Type (Automatic, Aggressive or Normal) can be chosen from the settings. Default is Automatic and it uses Aggressive for non 24 hr markets and Normal for 24 hr markets like Cryptocurrencies.
The width of the Range Bands can be changed using the Range Multiplier from the settings. Default is 1.618 , minimum value is 0.618 and maximum value is 2.0.
The frequency of the Trade Signals depends on both Range Bands type and Range Multiplier. So it is worth spending some time to test the indicator based on these 2 factors on the asset traded, to maximise the profit potential by optimising the type and multiplier value.
In addition to the Range Bands, the indicator also plots Dynamic Support and Resistance bands that are more sensitive to price action and helps the user determine growing support/resistance which is indicated by coloured dots. These dots normally appear when the Support or Resistance stays at the same level for a few bars.
The expansion and contraction of the Support and Resistance bands also help in visualising the price volatility, and an extremely narrow squeeze of these levels within the Range Bands normally signals a lucrative market move. This is usually followed by a breakout from the bands and will be signalled by the Trade Entry plots (BUY and SELL).
The Dynamic Support and Resistance levels can be enabled or disabled from the settings. The fill between these dynamic levels helps the user to visualise the Bull and Bear strength/power. This fill can also be disabled from the settings if not required.
The indicator has a nice Fibonacci levels generator companion that helps spot near support and resistance levels using Fibonacci Retracement tool.
There are 3 types of Fib plots that can be chosen from the settings - Auto-Fibs, Fibs based on Lookback, Fibs based on Price Input .
The Auto-Fibs feature is used as default and it automatically plots fib retracement based on nearby significant high/low (highest from previous up and down trends). This is normally based on nearby trade entries too. Occasionally, during choppy markets/sideways movement, the range of these levels can be quite small and if close price exceeds the 4.618 fib level, one of the other Fib plot options can be used. Alternatively, Plot fibs from current high/low can also be used.
Fibs based on lookback can be used by choosing the number of candles or days lookback to help the indicator automatically find the high and low of the period to generate fib levels. Similarly, Fibs based on price input requires, user to manually enter the high and low price points for the indicator to generate fib levels based on user input.
The indicator has two colour schemes for the Dynamic Support/Resistance fill and bar colours. The coloured bars and the fill will help visualise the price trend. This can be changed or disabled from the settings.
The Fib levels can be disabled by unchecking lines and labels from the styles tab of indicator settings.
Long and Short entry Alerts can be created by using Once Per Bar Close .
The indicator does not repaint. Alerts may display potential repaint warning, but this is because the code uses bar index for fib labels. For confidence in the indicator, it can be tested using bar replay to make sure the real-time and bar replay trade entries and plots stay on the same bar/timestamp.
The different elements of the indicator are shown below in the chart.
===================================================================================================================
™TradeChartist Range Bands can also be connected to ™TradeChartist Plug and Trade to generate Targets, Stop Loss Plot etc. and other alerts can also be created. Use Range Bands Trend Identifier to connect as an Oscillatory Signal to Plug and Trade. Example chart shown below.
===================================================================================================================
Example charts:
1. ADA-USDT 4hr chart using Aggressive type and 1.618 Range Multiplier
2. ADA-USDT 4hr chart using Normal type and 1.618 Range Multiplier
3. XAU-USD 15m chart using Normal type and 1.618 Range Multiplier - Fibs based on 3 days lookback
4. DJI 4hr chart using Normal type and 2.0 Range Multiplier
5. GBP-USD 15m chart using Normal type and 1.618 Range Multiplier
6. LINK-USDT 1hr chart using Normal type and 1.236 Range Multiplier
===================================================================================================================
Best Practice: Test with different settings first using Paper Trades before trading with real money
===================================================================================================================
This is not a free to use indicator. Get in touch with me (PM me directly if you would like trial access to test the indicator)
Premium Scripts - Trial access and Information
Trial access offered on all Premium scripts.
PM me directly to request trial access to the scripts or for more information.
===================================================================================================================

TRV & nTRV - Trimmed Range VolatilityGrid bots require stable volatility measurement - ATR becomes misleading when gaps and sudden spikes distort the average. TRV (Trimmed Range Volatility) is an advanced version of ATR: it filters outliers at the extremes (highest and lowest ranges) and remains unaffected by gaps. This provides real-time, accurate volatility measurement for grid bot setup.Grid bots require stable volatility measurement - ATR becomes misleading when gaps and sudden spikes distort the average. TRV (Trimmed Range Volatility) is an advanced version of ATR: it filters outliers at the extremes (highest and lowest ranges) and remains unaffected by gaps. This provides real-time, accurate volatility measurement for grid bot setup.
Why We Developed TRV?
When a gap or sudden spike occurs in the morning, this extreme movement affects standard ATR calculations for an extended period. Even if the price moves sideways for the rest of the day, ATR remains elevated. This causes grid bots to operate with unnecessarily wide spacing and execute fewer trades.
TRV Advantages:
✅ Unaffected by Gaps: Opening gaps don't distort the calculation
✅ Extreme Point Elimination: Filters the largest and smallest outlier candles
✅ Real-Time Accuracy: Shows current market volatility
✅ Grid Bot Optimization: Enables tighter and more efficient grid spacing
✅ Comparison Capability: Compare different stocks and timeframes with nTRV
Grid Bot Usage:
The TRV value is used directly to calculate the number of grid lines:
(Resistance - Support) / TRV = Number of Grid Lines
Example:
Resistance: $110
Support: $90
TRV: $2
Grid Count: (110-90)/2 = 10 grid lines
Features:
Two Filtering Modes: Manual (enter number) or Percentage-Based (automatic ratio)
Four Indicators in One: nTRV, TRV, ATR, and nATR all displayed on the same panel
nTRV: Normalized value (percentage-based, for stock comparison)
TRV: Absolute value (currency-based, for grid calculation)
ATR & nATR Included: Standard ATR and nATR for direct comparison with TRV
Comprehensive Analysis: Compare filtered (TRV) vs unfiltered (ATR) volatility side-by-side
Default: 10% top, 10% bottom outlier elimination
Conclusion:
TRV is an advanced version of ATR specifically designed for grid bot traders. By filtering outlier movements, it provides more stable and reliable volatility measurement. The indicator includes both TRV (filtered) and ATR (unfiltered) on the same chart, giving traders a comprehensive view to make informed decisions. This dual-display approach enables more efficient grid strategies and increased trading frequency.

Opening-Range BreakoutNote: Default trading date range looks mediocre. Set date range to "Entire History" to see full effect of the strategy. 50.91% profitable trades, 1.178 profit factor, steady profits and limited drawdown. Total P&L: $154,141.18, Max Drawdown: $18,624.36. High R^2
█ Overview
The Opening-Range Breakout strategy is a mechanical, session‑based day‑trading system designed to capture the initial burst of directional momentum immediately following the market open. It defines a user‑configurable “opening range” window, measures its high and low boundaries, then places breakout stop orders at those levels once the range closes. Built‑in filters on minimum range width, reward‑to‑risk ratios, and optional reversal logic help refine entries and manage risk dynamically.
█ How It Works
Opening‑Range Formation
Between 9:30–10:15 AM ET (configurable), the script tracks the highest high and lowest low to form the day’s opening range box.
On the first bar after the range window closes, the range high (OR_high) and low (OR_low) are “locked in.”
Range‑Width Filter
To avoid false breakouts in low‑volatility mornings, the range must be at least X% of the current price (default 0.35%).
If the measured opening-range width < minimum threshold, no orders are placed that day.
Entry & Order Placement
Long: a stop‑buy order at the opening‑range high.
Short: a stop‑sell order at the opening‑range low.
Only one side can trigger (or both if reverse logic is enabled after a losing trade).
Risk Management
Once triggered, each trade uses an ATR‑style stop-loss defined as a percentage retracement of the range (default 50% of range width).
Profit target is set at a configurable Reward/Risk Ratio (default 1.1×).
Optional: Reverse on Stop‑Loss – if the initial breakout loses, immediately reverse into the opposite side on the same day.
Session Exit
Any open positions are closed at the end of the regular trading day (default 3:45 PM ET window end, with hard flat at session close).
Visual cues are provided via green (range high) and red (range low) step‑line plots directly on the chart, allowing you to see the range box and breakout triggers in real time.
█ Why It Works
Early Momentum Capture: The first 15 – 60 minutes of trading encapsulate overnight news digestion and institutional order flow, creating a well‑defined volatility “range.”
Mechanical Discipline: Clear, rule‑based entries and exits remove emotional guesswork, ensuring consistency.
Volatility Filtering: By requiring a minimum range width, the system avoids choppy, low‑range days where false breakouts are common.
Dynamic Sizing: Stops and targets scale with the opening range, adapting automatically to each day’s volatility environment.
█ How to Use
Set Your Instruments & Timeframe
-Apply to any futures contract on a 1‑ to 5‑minute chart.
-Ensure chart timezone is set to America/New_York.
Configure Inputs
-Opening‑Range Window: e.g. “0930-1015” for a 45‑minute range.
-Min. OR Width (%): e.g. 0.35 for 0.35% of current price.
-Reward/Risk Ratio: e.g. 1.1 for a modest profit target above your stop.
-Max OR Retracement %: e.g. 50 to set stop at 50% of range width.
-One Trade Per Day: toggle to limit to a single breakout.
-Reverse on Stop Loss: toggle to flip direction after a losing breakout.
Monitor the Chart
-Watch the green and red range boundaries form during the session open.
-Orders will automatically submit on the first bar after the range window closes, conditioned on your filters.
Review & Adjust
-Backtest across multiple months to validate performance on your preferred contract.
-Tweak range duration, minimum width, and R/R multiple to fit your risk tolerance and desired win‑rate vs. expectancy balance.
█ Settings Reference
Input Defaults
Opening‑Range Window - Time window to form OR (HHMM-HHMM) - 0930–1015
Regular Trading Day - Full session for EOD flat (HHMM-HHMM) - 0930–1545
Min. OR Width (%) - Minimum OR size as % of close to trigger orders - 0.35
Reward/Risk Ratio - Profit target multiple of stop‑loss distance - 1.1
Max OR Retracement (%) - % of OR width to use as stop‑loss distance - 50
One Trade Per Day - Limit to a single breakout order per day - false
Reverse on Stop Loss - Reverse direction immediately after a losing trade - true
Disclaimer
This strategy description and any accompanying code are provided for educational purposes only and do not constitute financial advice or a solicitation to trade. Futures trading involves substantial risk, including possible loss of capital. Past performance is not indicative of future results. Traders should assess their own risk tolerance and conduct thorough backtesting and forward-testing before committing real capital.

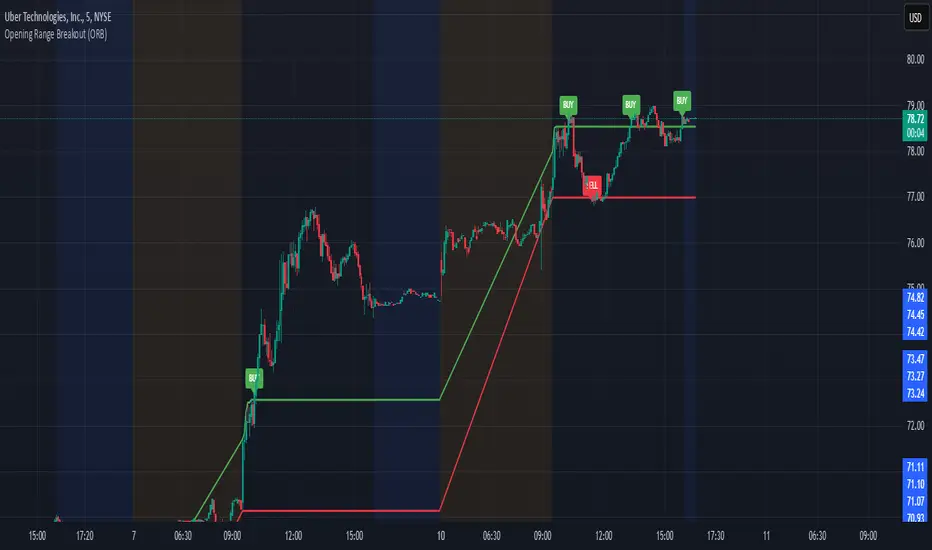
Opening Range Breakout (ORB)This is an Opening Range Break indicator. Best if used on a 5 minute chart. It plots the opening 30 minutes high and low of a ticker. (meaning mostly for stocks, options, etfs) and then it alerts a buy signal upon break of opening high and a sell signal upon break of opening low. This is a day trading type of indicator and there is a new opening range everyday.
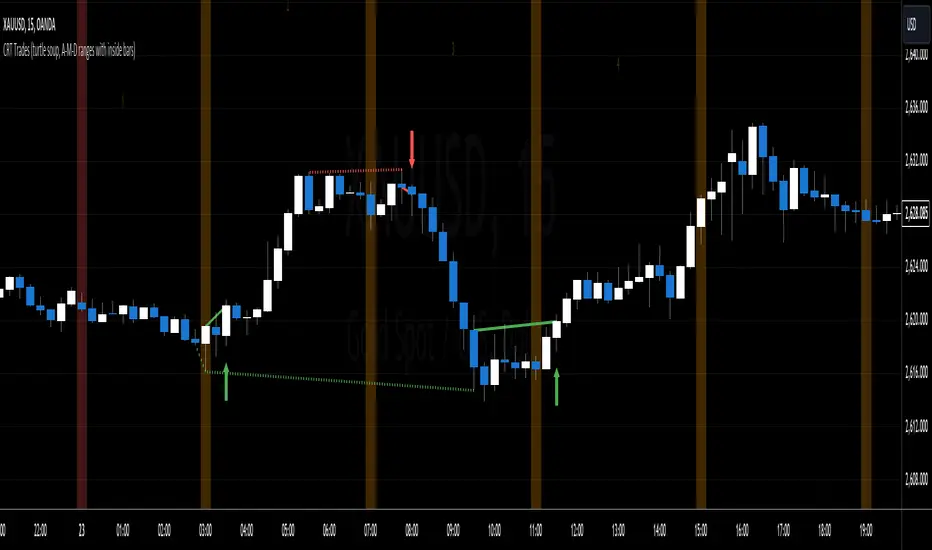
CRT Trades (turtle soup, A-M-D ranges with inside bars)CRT means Candle Range Theory. Every single candle is a range, on every single timeframe. Ranges may be either manipulated - turtle souped or broken - engulfed - closed above/below and retested.
CRT is usually presented as a 3 candle model. However it may consist of more than 3 candles due to inside bars. Inside bar is the candle where high is not higher then previous candle high and low is not lower then previous candle low.
First candle represents accumulation (may consist of more candles - inside bars), second candle represents manipulation (turtle soup) and third candle represents distribution. The abbreviation for that is A-M-D.
In accumulation the range with specific high and low is created. In manipulation (turtle soup) the high or low of the range is manipulated - liquidity taken and price should usually reverse back to the range. In distribution price is reversing back to the opposite side of the range. On higher timeframe it looks like manipulation candle wick is higher/lower than previous range high/low (may consist of 1 or more inside bar candles) but the body must not close above/below previous range high/low. Otherwise it is not manipulation (turtle soup) most likely and price should continue in direction of the candle close. Distribution candle should touch opposite side of range and it is mostly heavy and fast candle.
CRT model can be found on higher timeframe (e.g. 4h) and entries can be found on lower timeframe (e.g. 15m). You always use only lower timeframe on your chart because CRT model on the higher timeframe is shown on the lower one and also you can plan entries on the lower timeframe. You are able to change CRT model higher timeframe in the indicator settings.
There are two types of entries:
simple - wait for manipulation candle to close on higher timeframe (HTF) and then enter on lower timeframe (LTF) above open of the distribution candle on HTF if it is short or on LTF below open of the distribution candle on HTF if it is long. These entries can be done by market order.
advanced - wait for the break of previous range high/low and enter by limit order when price reverses back to the range and retraces to the order block or fair value gap created by the breaker candle.
Stop loss can be placed above/below of the top/bottom created by manipulation candle. First take profit should be placed in 1/2 of the accumulation range and second take profit should be placed at the opposite range of accumulation range.
It is possible to filter only particular accumulation (range) and manipulation (turtle soup) candles depending also on timezone set in the settings. For example on 4h CRT model if you fill input "indices" for section "range" like 1,2 and input "indices" for section "turtle soup" like 3,4 then you are awaiting the range to form during asia session and manipulation during london session if the timezone is somewhere around "UTC+2".
Dotted lines represent turtle soup of previous range and solid lines represent engulfing candle of the breaker candle on lower timeframe. When the engulfing is closed you can look for entries either by market order after closing or by limit order when the price retraces to order block (created by breaker candle) or fair value gap (created by engulfing).
Recommendations for combining lower (entries) and higher (crt model) timeframes:
1D CRT model => 1h entries,
4h CRT model => 15m entries,
1h CRT model => 5m entries,
15m CRT model => 1m entries.
Megabar Breakout (Range & Volume & RSI)Hey there,
This strategy is based on the idea that certain events lead to what are called Megabars. Megabars are bars that have a very large range and volume. I wanted to verify whether these bars indicate the start of a trend and whether one should follow the trend.
Summary of the Code:
The code is based on three indicators: the range of the bar, the volume of the bar, and the RSI. When certain values of these indicators are met, a Megabar is identified. The direction of the Megabar indicates the direction in which we should trade.
Why do I combine these indicators?
I want to identify special bars that have the potential to mark the beginning of a breakout. Therefore, a bar needs to exhibit high volume, have a large range (huge price movement), and we also use the Relative Strength Index (RSI) to assess potential momentum. Only if all three criteria are met within one candle, do we use this as an identifier for a megabar.
Explanation of Drawings on the Chart:
As you can see, there is a green background on my chart. The green background symbolizes the time when I'm entering a trade. Only if a Megabar happens during that time, I'm ready to enter a trade. The time is between 6 AM and 4 PM CET. It's just because I prefer that time. Also, the strategy draws an error every time a Megabar happens based on VOL and Range only (not on the RSI). That makes it pretty easy to go through your chart and check the biggest bars manually. You can activate or deactivate these settings via the input data of the strategy.
When Do We Enter a Trade?
We wait for a Megabar to happen during our trading session. If the Megabar is bullish, we open a LONG trade at the opening price of the next candle. If the Megabar is bearish, we open a SHORT trade at the opening price of the next candle.
Where Do We Put Our Take Profit & Stop Loss?
The default setting is TP = 40 Pips and SL = 30 Pips. In that case, we are always trading with a risk-reward ratio of 1.33 by default. You can easily change these settings via the input data of the strategy.
Strategy Results
The criteria for Megabars were chosen by me in a way that makes Megabars something special. They are not intended to occur too frequently, as the fundamental idea of this strategy would otherwise not hold. This results in only 37 closed trades within the last 12 months. If you change the criterias for a megabar to a milder one, you will create more Megabars and therefore more trades. It's up to you. I have adapted this strategy to the 30-minute chart of the EURUSD. In the evaluation, we consider a period of 12 months, which I believe is sufficient.
My default settings for the indicators look like this:
Avg Length Vol 20
Avg Multiplier Vol 3
Avg Length Range 20
Avg Multiplier Range 4
Value SMA RSI for Long Trades 50
Value SMA RSI for Short Trades 70
IMPORTANT: The current performance overview does not display the results of these settings. Please change the settings to my default ones so that you can see how I use this strategy.
I do not recommend trading this strategy without further testing. The script is meant to reflect a basic idea and be used as a tool to identify Megabars. I have made this strategy completely public so that it can be further developed. One can take this framework and test it on different timeframes and different markets.

Implied Range from Options [SS]I have been promising to post this for a while, but I just needed to make sure that a) there were no similar indicators already available and b) make it a bit more user friendly.
So here it is, a basic indicator that will display the implied range from options.
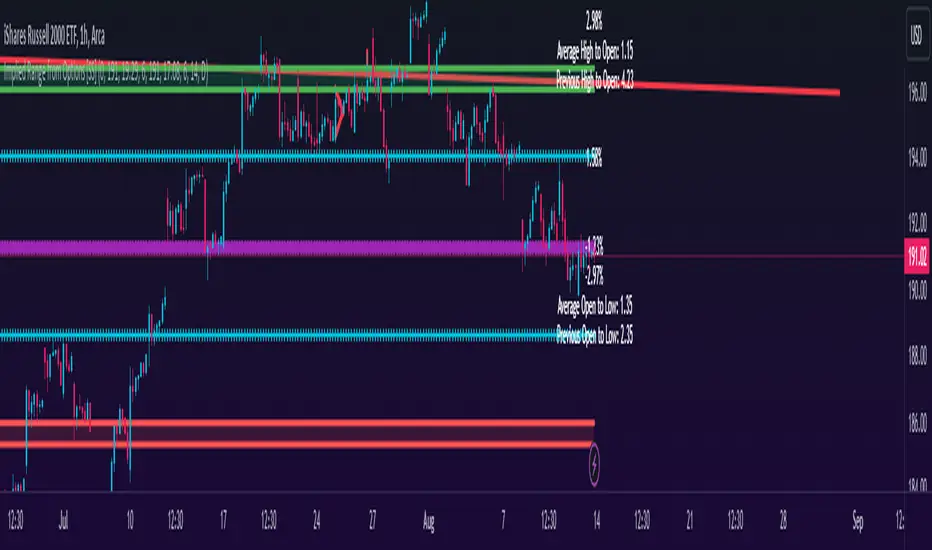
In addition to displaying the implied range from options, it will provide some secondary information to help add context to the implied range. Those are shown in the chart below:
The indicator will list various precents at each point to the upside and to the downside. This is the percent move required, based on the current close price, to obtain any point in the implied move range.
In addition, the indicator will display the average move from open to high and open to low over a user defined period (default to 14 candle period) as well as the previous open to high and open to low move from the previous day.
This is to give you context of:
a) How much of a % increase or decrease is required to reach the implied ranges; and
b) How does the implied range compare to the ticker's average moves.
An increased implied range that exceeds the ticker's average move can alert you that the market is pricing in an above average move. This can be helpful and alert you to potential news releases or other fundamental things that have the potential to move the market.
How to Use the indicator:
So unfortunately, this indicator requires a bit of manual input. I was going to do an auto IV calculcation using Black-Scholes Model but just to be more rigorous in accuracy, I decided to, for now, leave it at a manual input. So when you launch the settings menu, this is what you will see:
You can collect all of this required information from your broker. Inversely, you can collect it online for free from various services such as Barchart or COBE's exchange website. The easiest way is to just pull it from your broker though.
Make sure, if you are doing weekly options to see the weekly range, you set the timeframe to 1 week. The timeframe function will calculate the average move over the desired timeframe length. So if you are doing a 0 dte for the next day, you want to see the intra-day range and will select the 1 day timeframe. It will then present to you the range averages and information on the daily timeframe for you to compare to the implied options range.
Same for the weekly, monthly, yearly, etc.
Additional options:
The indicator provides the midline average and midway points, to add static targets if you are trading the implied range.
These can be toggled on or off in the settings menu:
As well, as you can see, you can also toggle off the range labels.
There is also an offset option. This allows you to extend the range into the future:
Simply select how many candles you would like to plot the range in advance.
Closing remarks
That is the indicator. Its very simple, but it is handy. I was never one to pay attention to option pricing data, but I have been plotting it out daily and weekly these past few weeks and it does add a bit of context in terms of what the market is thinking. So I do recommend actually adding it to your repertoire of analyses going into the weeks and months, and really just paying attention to how the average ranges compare to what the market is pricing in.
One quick suggestion, select the strike price that aligns with the closing price of the ticker. This gives you a better representation of the range.
Safe trades everyone and leave your comments, questions and suggestions below!
Dynamic Auto RangesBrief Overview:
The "Dynamic Auto Ranges" indicator automatically detects and displays dynamic price range levels around the current market price. This indicator was initially designed and optimized for price movements on Nasdaq, but may also be useful for other instruments with input adjustments. Its purpose is to help traders identify potential support/resistance zones or other key price levels in an adaptive manner. All range lines and their labels are displayed in red for clear visibility.
Key Features:
Automatic Main Range Detection: The indicator intelligently calculates a primary price range block (e.g., 21600-21800) based on the real-time price.
Adjustable Main Range Block Size: Users can select the size of this main range block via settings (e.g., 50, 100, 200, 500 points, etc.), allowing flexibility for various instruments and trading styles.
Automatic Subdivisions: Within the detected dynamic main range, the indicator automatically draws subdivision lines at intervals that are also user-configurable (e.g., every 25 points).
Full Horizontal Lines: All range lines are displayed as full horizontal lines extending to both the left and right sides of the chart (extend.both), providing a clear visualization of levels across history and into the future.
Informative Price Labels: Each subdivision line is accompanied by a clear price label, positioned below the line for easy readability. The label text size has also been adjusted to be larger and more visible (size.small).
Contrasting Red Visuals: Lines and price label text are displayed in red to ensure they stand out on your chart.
Line Style Configuration: Users can customize the line style (Solid, Dashed, Dotted) and the line width for general subdivisions, as well as for the main boundaries of the range block.
Real-time Updates: The range levels and their subdivisions will automatically shift and update as the market price moves into new main range blocks.
How to Use:
Add the "Dynamic Auto Ranges" indicator to your chart (optimized for Nasdaq, but can be tested on other instruments).
Open the indicator's settings (the gear icon next to the indicator name).
Adjust the "Main Range Block Size" to determine how large you want the primary range block to be around the current price.
Set the "Subdivision Step" to determine the interval for the lines within that main range.
Use the displayed lines as a reference for your price action analysis.
Customizable Settings:
Main Range Block Size: Choose the size of the main range block.
Subdivision Step: Set the interval for subdivision lines.
Style: Select the line style (Solid, Dashed, Dotted).
Width: Set the line width for subdivisions.
Main Boundary Width: Set a specific width for the main range block boundary lines.
Note:
This indicator is designed to provide visual guidance based on mathematical calculations of price movements. Like all trading tools, it should be used as part of a comprehensive trading strategy and not as the sole basis for making trading decisions.

Breakout/Breakdown Indicator (30 Min Range) by InvestYourAsset👉The indicator provided here is a technical analysis indicator for TradingView users that identifies potential breakout and breakdown opportunities on the initial 30-minute range in every trading session.
👉The indicator high and low of the initial 30-minute period and plotting them as horizontal lines on the chart. The high is marked in green line and the low is marked in red line.
📈The indicator then generates buy and sell signals based on whether the current close price crosses above or below the previous 30-minute high and low, respectively.
📢The indicator also has two inputs:
👉 sessionStartHour : The hour at which the trading session begins. The default value is 9, However users can change the time according to their own trading style.
👉 sessionStartMinute : The minute at which the trading session begins. The default value is 0.
These inputs can be used to adjust the indicator to the specific trading session that you are interested in.
✅How to use the Indicator:
👉To use the 30 Minute Breakout/Breakdown Indicator, simply add it to your chart and configure the inputs to your liking. Once the indicator is added to the chart, it will plot the 30-minute high and low as horizontal lines, as well as generate buy and sell signals based on the current close price.
✅Here is a step-by-step guide:
📈Open TradingView and select the chart that you want to add the indicator to.
📈Click on the "Indicators" tab and search for "30 Minute Breakout/Breakdown Indicator by InvestYourAsset".
📈Click on the indicator to add it to your chart.
📈Configure the inputs to your liking. The default values are typically fine, but you can experiment with different values to see what works best for you.
📈Once you are satisfied with the settings, click on the "Apply" button.
📈The indicator will now be displayed on your chart. You will see two horizontal lines representing the previous 30-minute high and low, as well as triangles representing buy and sell signals.
✅How to interpret the signals:
📈Buy signal : A buy signal is generated when the current close price crosses above the previous 30-minute high. This suggests that the price is likely to continue moving higher in the short term.
📈Sell signal : A sell signal is generated when the current close price crosses below the previous 30-minute low. This suggests that the price is likely to continue moving lower in the short term.
👉Traders should remember that the present indicator is just one tool that can be used to identify potential trading opportunities. It is important to use other technical analysis tools and risk management techniques to confirm your trading signals before entering any trades.
✅Things to consider while using the indicator:
📈Look for buy signals in an uptrend and sell signals in a downtrend. This will increase the likelihood of your trades being successful.
📈Place your stop losses below the previous 30-minute low for buy signals and above the previous 30-minute high for sell signals. This will help to limit your losses if the trade goes against you.
📈Consider taking profits at key resistance and support levels. This will help you to lock in your profits and avoid giving them back to the market.
Follow us for timely updates regarding indicators that we may publish in future and give it a like if you appreciate the indicator.

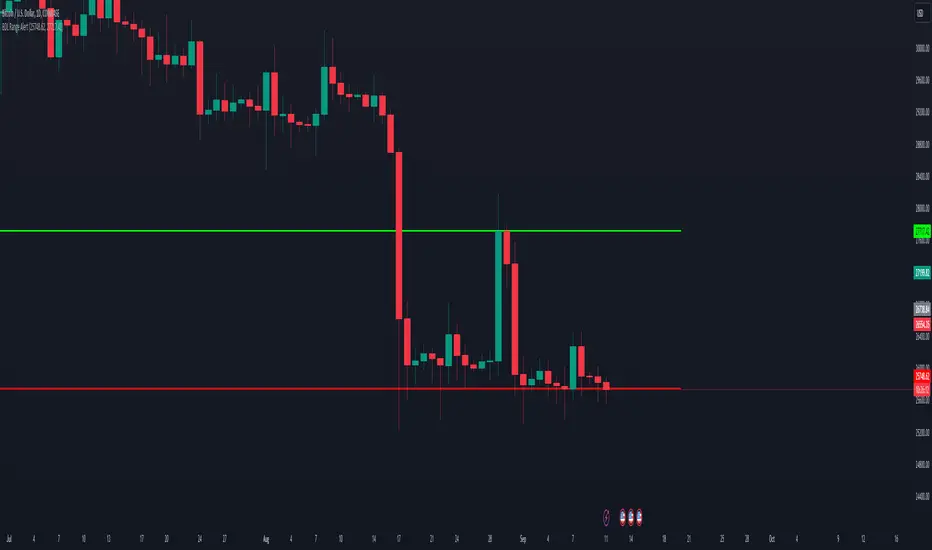
BDL Range AlertAs soon as you call this indicator, it asks you to define the range. Select the bottom and the top of the range. Next, set your alarm. There are 3 alarm options:
1: Bottom of the range breakout
2: Top of the range breakout
3: Bottom or top of the range breakout
As soon as you close a candle outside the selected range, only then will the alarm be triggered.
Mondays Range screener by B1rdIntroducing the long awaited Monday Range Screener by B1rd!
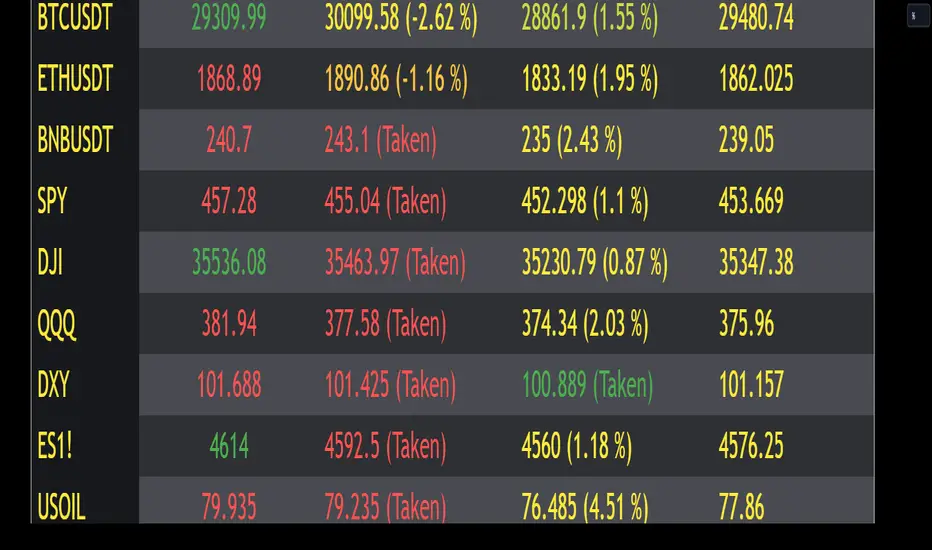
The Monday Range Screener is a powerful and intuitive indicator designed to help traders identify potential range trading opportunities based on Monday's price ranges. With user-friendly features and real-time data, this screener empowers you to make informed trading decisions.
Key Features:
Ticker Flexibility: The screener allows you to easily swap tickers, giving you the freedom to monitor and analyze multiple assets of your choice.
Comprehensive Information: The indicator displays essential data in a clear and organized manner. The left column shows the ticker symbol, followed by the current price, Monday's high, Monday's low, and Monday's average in the subsequent columns.
Range Trading Highlighting: The Monday Range Screener highlights the current price when it falls within Monday's high and low range, helping you quickly identify potential range trading opportunities.
Alert System: With the built-in alert feature, you can receive timely notifications whenever the current price enters Monday's high or low range. Stay on top of market movements even when you're away from the screen.
Get ready to take your trading to the next level with the Monday Range Screener by B1rd. This reliable indicator helps you identify range trading opportunities and stay informed about Monday's price ranges. Enhance your trading approach and make confident decisions using this powerful tool.
Important note: Please be aware that there is a known bug in certain chart layouts that may cause an array error and prevent the table from being plotted. The cause of this issue is unclear at the moment. However, based on my experience, there are a few potential solutions that you can try:
Set all the sources to a single asset, such as BTCUSDT. If this workaround works, you can gradually introduce new sources one by one and observe if the issue persists.
Experiment with different chart layouts, timeframes, and assets. Sometimes, applying the Monday Range Screener to alternative settings can help resolve the problem.
I apologize for any inconvenience this bug may cause. Please consider these workarounds as temporary solutions until a more permanent resolution can be found.
Original indicator this screener is based on:
Powertrend - Volume Range Filter Strategy [wbburgin]The Powertrend is a range filter that is based off of volume, instead of price. This helps the range filter capture trends more accurately than a price-based range filter, because the range filter will update itself from changes in volume instead of changes in price. In certain scenarios this means that the Powertrend will be more profitable than a normal range filter.
Essentials of the Strategy
This is a breakout strategy which works best on trending assets with high volume and liquidity. It should be used on middle to higher timeframes and can be used on all assets that have volume provided by the data source (stocks, crypto, forex). It is long-only as of now. It can work on lower timeframes if you optimize the strategy filters to make less trades or if your exchange/broker is low/no fees, provided that your exchange/broker has high liquidity and volume.
The strategy enters a long position if the range filter is trending upwards and the price crosses over the upper range band, which signifies a price-volume breakout. The strategy closes the long position if the range filter is trending downwards and the price crosses under the lower range band, which signifies a breakdown. Both these conditions can be altered by the three filter options in the settings. The default trend filter is not alterable because it helps prevent false entries and exits that are against the trend.
Settings
The Length setting is the lookback period for the range smoothing.
The ADX Filter setting enables you to turn on an ADX filter, which will halt entries and exits unless the ADX of your customizable length is above a ADX VWMA of that length.
The Range Supertrend setting creates a supertrend from the top and bottom ranges, which can be used to filter entries and exits. The length is customizable. The filter can show you whether the range is making higher highs and lower lows. Below is an example of the Range Supertrend being used as a filter and plotted on-chart:
The VWMA setting halts entries if they are below a customizable length VWMA.
Both the Range Supertrend and the VWMA can also be plotted separately without actually filtering the strategy, so that you can use them independently if you wish. You can turn off the bar color, the highlighting, and the labels if you wish in the settings. A note about the bar color: if the color changes but the strategy does not signal an exit or entry this means that the crossover was against the trend. In these circumstances it may be indicative of a pullback to enter or exit or to add onto your position.
About the Strategy Results Below
A range filter is normally composed of two components - the range filter itself and a smoothing function. In the development of this script I tested both normal and volume-based varieties of the range filter and the smoothing function:
Tests Performed
Volume-based Range x VWMA smoothing
Price-based Range x VWMA smoothing
Price-based Range x EMA smoothing
Volume-based Range x EMA smoothing (final result)
The highest-performing was a volume-based range filter and a normal EMA-based smoothing function, but that does not mean that this strategy will be profitable - exits are based off of signal reversion so I strongly encourage you to develop your own take profits/stop losses for the strategy if you think it may be a good fit for you. The results below are with a commission value of 0.05% (because I built the strategy first for equities), slippage of 3, so if your exchange/broker has a higher fee schedule, I recommend adding filters and/or moving to higher timeframes for the strategy. Additionally, I used 10% of equity in each trade, while using the Range Supertrend filter (the previous upload was unrealistic because it used 100% of equity - missed a 0, apologies, and added in slippage).

REVE Cohorts - Range Extension Volume Expansion CohortsREVE Cohorts stands for Range Extensions Volume Expansions Cohorts.
Volume is divided in four cohorts, these are depicted in the middle band with colors and histogram spikes.
0-80 percent i.e. low volumes; these get a green color and a narrow histogram bar
80-120 percent, normal volumes, these get a blue color and a narrow histogram bar
120-200 percent, high volume, these get an orange color and a wide histogram bar
200 and more percent is extreme volume, maroon color and wide bar.
All histogram bars have the same length. They point to the exact candle where the volume occurs.
Range is divided in two cohorts, these are depicted as candles above and below the middle band.
0-120 percent: small and normal range, depicted as single size, square candles
120 percent and more, wide range depicted as double size, rectangular candles.
The range candles are placed and colored according to the Advanced Price Algorithm (published script). If the trend is up, the candles are in the uptrend area, which is above the volume band, , downtrend candles below in the downtrend area. Dark blue candles depict a price movement which confirms the uptrend, these are of course in the uptrend area. In this area are also light red candles with a blue border, these depict a faltering price movement countering the uptrend. In the downtrend area, which is below the volume band, are red candles which depict a price movement confirming the downtrend and light blue candles with a red border depicting price movement countering the downtrend. A trend in the Advanced Price Algorithm is in equal to the direction of a simple moving average with the same lookback. The indicator has the same lagging.as this SMA.
Signals are placed in the vacated spaces, e.g. during an uptrend the downtrend area is vacated.
There are six signals, which arise as follows:
1 Two blue triangles up on top of each other: high or extreme volume in combination with wide range confirming uptrend. This indicates strong and effective up pressure in uptrend
2 Two pink tringles down on top of each other: high or extreme volume in combination with wide range down confirming downtrend. This indicates strong and effective down pressure in downtrend
3 Blue square above pink down triangle down: extreme volume in combination with wide range countering uptrend. This indicates a change of heart, down trend is imminent, e.g. during a reversal pattern. Down Pressure in uptrend
4 Pink square below blue triangle up: extreme volume in combination with wide range countering downtrend. This indicates a change of heart, reversal to uptrend is imminent. Up Pressure in downtrend
5 single blue square: a. extreme volume in combination with small range confirming uptrend, b. extreme volume in combination with small range countering downtrend, c. high volume in combination with wide range countering uptrend. This indicates halting upward price movement, occurs often at tops or during distribution periods. Unresolved pressure in uptrend
6 Single pink square: a extreme volume in combination with small range confirming downtrend, b extreme volume in combination with small range countering uptrend, c high volume in combination with wide range countering downtrend. This indicated halting downward price movement. Occurs often at bottoms or during accumulation periods. Unresolved pressure in downtrend.
The signals 5 and 6 are introduced to prevent flipping of signals into their opposite when the lookback is changed. Now signals may only change from unresolved in directional or vice versa. Signals 3 and 4 were introduced to make sure that all occurrences of extreme volume will result in a signal. Occurrences of wide volume only partly lead to a signal.
Use of REVE Cohorts.
This is the indicator for volume-range analyses that I always wanted to have. Now that I managed to create it, I put it in all my charts, it is often the first part I look at, In my momentum investment system I use it primarily in the layout for following open positions. It helps me a lot to decide whether to close or hold a position. The advantage over my previous attempts to create a REVE indicator (published scripts), is that this version is concise because it reports and classifies all possible volumes and ranges, you see periods of drying out of volume, sequences of falter candles, occurrences of high morning volume, warning and confirming signals.. The assessment by script whether some volume should be considered low, normal, high or extreme gives an edge over using the standard volume bars.
Settings of REVE Cohorts
The default setting for lookback is ‘script sets lookback’ I put this in my indicators because I want them harmonized, the script sets lookback according to timeframe. The tooltip informs which lookback will be set at which timeframe, you can enable a feedback label to show the current lookback. If you switch ‘script sets lookback’ off, you can set your own preferred user lookback. The script self-adapts its settings in such a way that it will show up from the very first bar of historical chart data, it adds volume starting at the fourth bar.
You can switch off volume cohorts, only range candles will show while the middle band disappears. Signals will remain if volume is present in the data. Some Instruments have no volume data, e.g. SPX-S&P 500 Index,, then only range candles will be shown.
Colors can be adapted in the inputs. Because the script calculates matching colors with more transparency it is advised to use 100 percent opacity in these settings.
Take care, Eykpunter

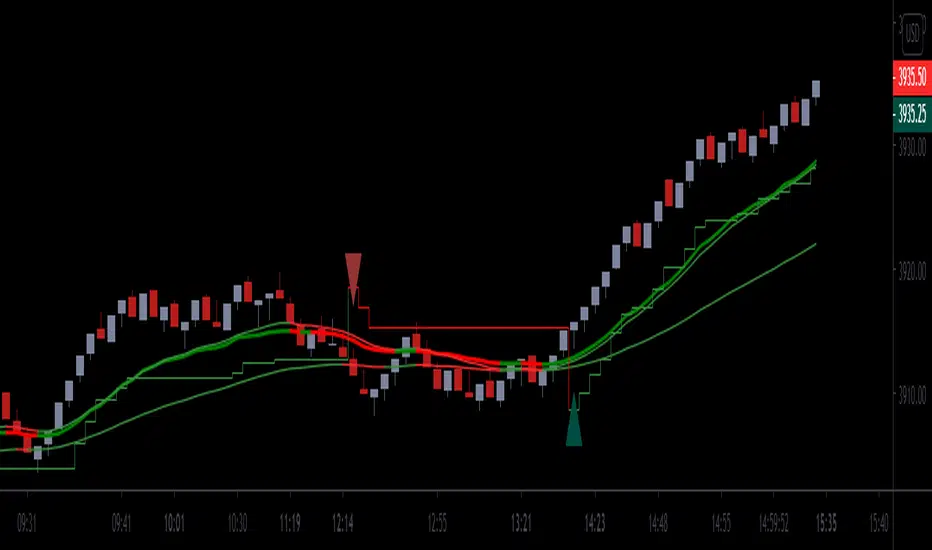
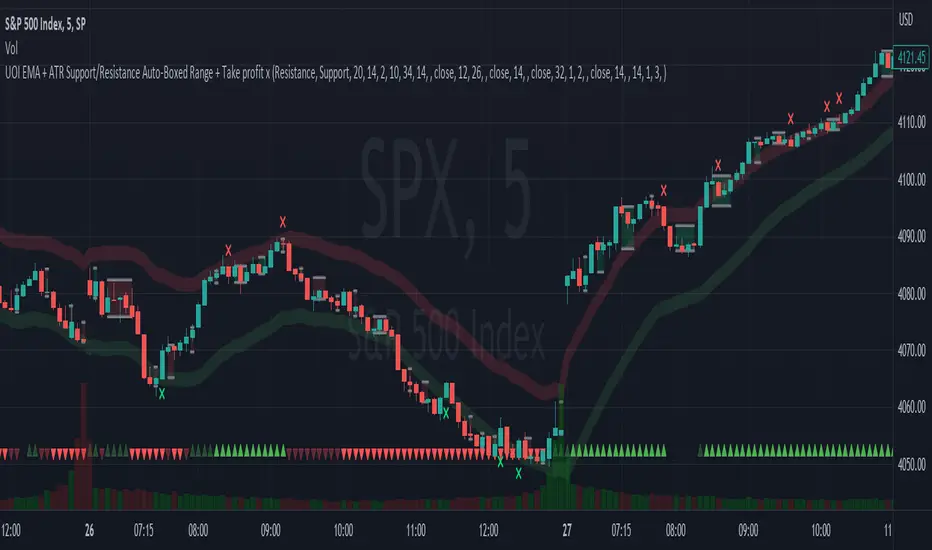
EMA + ATR Support/Resistance Auto-Boxed Range + Take profitUnveiling the 'EMA + ATR Support/Resistance Auto-Boxed Range + Take profit signal' tool, an innovative resource engineered for discerning traders to pinpoint crucial dynamic support and resistance levels (not like the common pivot based support and resistance indictors). The tool ingeniously amalgamates the power of EMA and ATR indicators to delineate these levels as green and red bands, offering invaluable insights into potential trading windows.
The real game-changers in this tool are the newly incorporated 'Auto Boxed Range Detector' and the 'Bull Bear Tug of War' detector. The Auto Boxed Range Detector is at the core of this update, illuminating price ranges to give you the upper hand in detecting breakouts or breakdowns. This feature has been designed meticulously to automate the identification of trading ranges, thereby increasing the accuracy and speed of your decision-making process. Also, this helps avoiding fake breakouts. If the top of the boxed range is near resistance line it is less likely to breakout unless we are on a trend day.
Simultaneously, the Bull Bear Tug of War detector (the little red and green triangles at the bottom) introduces an entirely new dimension of market dominance visualization. This detector embodies market power struggles through vivid red and green triangles, supplemented by translucent colors for transitional periods or potential false-outs. It's a dynamic, real-time pictorial representation of the ceaseless tug of war between bulls and bears captured by a combination of RSI, CCI, MACD, STOCHASTIC, AND VWAP, enabling you to anticipate market swings better. You can change the position of the triangles in the setting and move the red ones to top and keep the green ones in the bottom.
Customization options are plentiful, including the ability to tweak the EMA and ATR lengths, with default values set at 20 and 14 respectively. Additionally, you can modify the ATR multiplier in the S/R length setting, defaulted at 2, and the line width for optimal visibility. The EMA line can be made visible in the settings, while support and resistance lines are color-coded in green and red for instant recognition.
When prices make contact with these levels, the tool generates visual cues in the form of crosses above or below the price bars, thus serving as potential take profit or entry/exit points. Should you prefer, take profit signals can be deactivated in the settings.
To leverage this tool to its maximum potential:
- Fine-tune the EMA and ATR lengths to resonate with your trading strategy. Longer lengths yield smoother lines but may trail current prices.
- Determine the S/R length to govern the spacing of support and resistance lines from the EMA line.
- Stay alert for crosses above or below the price bar, signaling when prices have met support or resistance levels. These are key indicators for potential take profit or entry/exit decisions.
- For best results, this tool should be used in conjunction with other indicators to corroborate signals and minimize false alerts. The ultimate aim is to utilize other indicators to initiate a trade and rely on this tool to provide timely take profit reminders.
Bear in mind, this tool should not be the sole determinant in your investment decisions. Comprehensive research and a multifaceted approach are indispensable when contemplating any trades.
Impulse Range Compression & Expansion (IRCE)📌 Impulse Range Compression & Expansion (IRCE) – Visualizing Price Traps Before Breakouts
📖 Overview
The IRCE Indicator is a precision breakout detection tool designed to identify consolidation traps and price coil zones before expansion moves occur. Unlike traditional volatility indicators that rely solely on statistical thresholds (e.g., Bollinger Bands or ATR), IRCE focuses on behavioral price compression, detecting tight-range candle clusters and validating breakouts through body expansion and/or volume surges.
This makes it ideal for traders looking to:
• Catch breakouts from range traps
• Avoid choppy and premature signals
• Spot early-stage momentum moves based on clean price behavior
⸻
⚙️ How It Works
1. Impulse Range Compression Detection
• Measures the high-low range of each candle
• Compares it to a user-defined average range (default 7 bars)
• Flags candles where the range is significantly smaller (e.g., <60% of average)
• Groups these into tight clusters, indicating compression zones or potential “trap ranges”
2. Cluster Box Construction
• When a valid cluster (e.g., 3 or more tight candles) is detected, the indicator:
• Marks the high and low of the cluster
• Draws a shaded box over this “trap zone”
• This helps visually track where price has coiled before a breakout
3. Breakout Confirmation Logic
A breakout from the trap zone is only validated when:
• Price closes above the cluster high (bullish) or below the cluster low (bearish)
• One or both of the following confirm strength:
• Body Expansion: Current candle body is 120%+ of recent average
• Volume Expansion: Volume exceeds recent volume average
4. Optional Trend Filter
• An optional EMA filter (default: 50 EMA) ensures breakout signals align with trend direction
• Helps filter out countertrend noise in ranging markets
5. Signal Cooldown
• Prevents repeated signals by enforcing a cooldown period (e.g., 10 bars) between entries
⸻
🖥️ Visual Elements
• 📦 Yellow compression boxes represent tight price traps
• 🟢 Buy labels appear when price breaks above the trap with confirmation
• 🔴 Sell labels appear when price breaks below with confirmation
• All visuals are non-repainting and updated in real-time
🧠 How to Use
1. Wait for a yellow trap box to appear
2. Watch for a confirmed breakout from the trap zone
3. Take the trade in the direction of the breakout:
• Only if it satisfies body or volume confirmation
• And if trend alignment is enabled, it must match EMA direction
4. Place stops just outside the opposite end of the trap zone
5. Use risk/reward ratios or structure levels for exits
This logic works great on:
• Lower timeframes (scalping breakouts)
• Higher timeframes (detecting price coiling before major moves)
• Any market: Stocks, Crypto, FX, Commodities
⸻
🔒 Technical Notes
• ✅ No repainting
• ✅ No future-looking logic
• ✅ Suitable for both discretionary and systematic traders
• ✅ Built in Pine Script v6

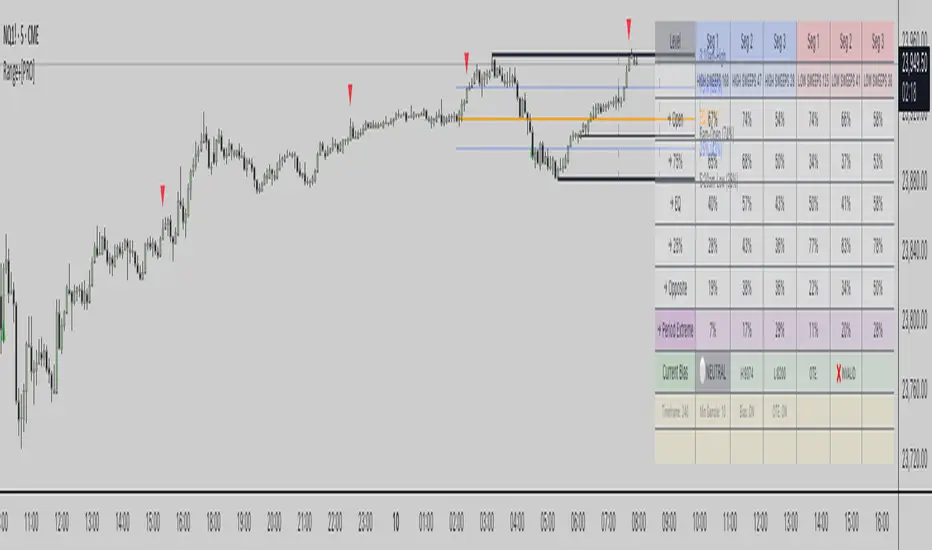
Range Stats with Sweeps + Time Analysis + BiasRange Stats with Sweeps + Time Analysis + Bias
Advanced range-based trading analysis with comprehensive sweep detection, time-based probability modeling, and intelligent bias calculation for institutional-grade market insights.
Overview
Range Stats with Sweeps + Time Analysis + Bias is a sophisticated Pine Script indicator designed for professional traders who demand precision in range-based market analysis. This comprehensive tool combines traditional range level analysis with advanced sweep detection algorithms, time-based probability modeling, and dynamic bias calculation to provide institutional-quality insights into market behavior patterns.
Core Features
Multi-Timeframe Range Analysis
Automatic or manual timeframe selection with intelligent defaults
Comprehensive range level calculation including High, Low, Open, 75%, EQ (50%), and 25% retracements
Dynamic period detection supporting both traditional timeframes and custom session-based analysis
Real-time range updates with historical data preservation
Advanced Sweep Detection System
Configurable sweep validation with customizable bar confirmation periods
Optional wick-based sweep requirements for enhanced precision
Segment-based sweep tracking dividing periods into three analytical zones
Real-time sweep markers with probability-enhanced labeling
Comprehensive Bias Calculation Framework
Intelligent range bias determination based on price action relative to range boundaries
Dynamic bias tracking with bullish, bearish, and neutral state identification
Historical bias performance statistics with hit rate analysis
Optimal Trade Entry (OTE) box generation based on current bias and displacement analysis
Time-Based Probability Analysis
Formation time tracking for high and low levels with customizable time buckets
Sweep probability calculation based on exact formation timing
Multiple time range displays including Full 24H, Extended Trading, US Market, EU Market, and Asia Market sessions
Custom session configuration with intelligent session-based level detection
Professional Visualization System
Customizable line styles, colors, and transparency settings for all range levels
Segment projection lines for period structure visualization
Comprehensive probability tables with real-time statistics
Time-enhanced labels showing formation times and sweep probabilities
Technical Implementation
Range Detection Logic
The system employs sophisticated algorithms to identify range boundaries using either traditional timeframe-based detection or custom session-based analysis. Range levels are calculated with mathematical precision, providing 75%, 50%, and 25% retracement levels based on period high-low ranges.
Sweep Analysis Framework
Advanced sweep detection monitors price action for liquidity grabs above highs and below lows, with configurable validation periods ensuring sweep authenticity. The system tracks sweep occurrences across three distinct period segments, enabling granular probability analysis.
Bias Calculation Engine
The intelligent bias system analyzes price behavior relative to range boundaries, considering factors such as wick interactions, close positioning, and directional momentum. This generates dynamic bias signals that adapt to changing market conditions.
Time-Based Modeling
Sophisticated time bucket analysis tracks formation times for range extremes, building comprehensive probability models that identify optimal trading windows based on historical performance patterns.
Configuration Options
Core Settings
Automatic or manual timeframe selection with comprehensive options
Global timezone support with major market timezone presets
Configurable label sizing and time format preferences
Advanced sweep validation parameters with wick-based options
Range Level Customization
Individual control over all range level displays and styling
Custom color schemes with transparency controls
Line style selection including solid, dashed, and dotted options
Adjustable line widths for enhanced visual hierarchy
Advanced Features
Segment projection line configuration for period structure analysis
Bias calculation toggle with OTE box generation
Sweep extreme probability tracking with period extreme analysis
Comprehensive sweep marker system with probability labeling
Time Analysis Configuration
Multiple time bucket options including 20-minute, 1-hour, 2-hour, and custom session buckets
Flexible time range displays optimized for different trading sessions
Custom session configuration with intelligent session-based level detection
Advanced table positioning and sizing options
Trading Applications
Range-Based Strategy Development
Identify key support and resistance levels within established ranges, analyze retracement probabilities for optimal entry timing, and utilize segment-based analysis for precise trade planning.
Sweep-Based Trading
Monitor liquidity grab events with high-probability retracement targets, track sweep occurrences across different period segments, and leverage time-based sweep probability for enhanced timing.
Bias-Driven Analysis
Utilize dynamic bias calculation for directional trade alignment, implement OTE box strategies for institutional-style entries, and monitor bias shifts for trend change identification.
Time-Based Optimization
Optimize trade timing using formation time probability analysis, focus on high-probability time windows for specific market behaviors, and customize analysis for preferred trading sessions.
Technical Specifications
Built on Pine Script v6 with advanced optimization techniques
Comprehensive data collection with intelligent memory management
Real-time probability calculation with historical data preservation
Multi-session support with custom timezone handling
Professional-grade visualization with institutional styling
Important Considerations
This indicator is designed for experienced traders familiar with range-based analysis and institutional trading concepts. Optimal performance requires adequate historical data for probability calculation accuracy. Users should ensure proper timeframe and session configuration alignment with their trading strategy.
Disclaimer
This indicator is provided for educational and informational purposes only. It does not constitute financial advice, investment recommendations, or trading signals. All trading decisions should be based on your own analysis, risk tolerance, and financial situation. Past performance does not guarantee future results. Trading involves substantial risk of loss and is not suitable for all investors. The probability statistics and bias calculations are based on historical data and may not predict future market behavior. Always conduct thorough research and consider consulting with qualified financial professionals before making trading decisions.
Copyright
© 2025 OmarxQQQ. All rights reserved. This Pine Script indicator and its associated documentation are protected by copyright law. Unauthorized reproduction, distribution, or modification is prohibited. This code is subject to the terms of the Mozilla Public License 2.0.
Range Stats with Sweeps + Time Analysis + Bias - Professional range analysis with institutional-grade probability modeling.
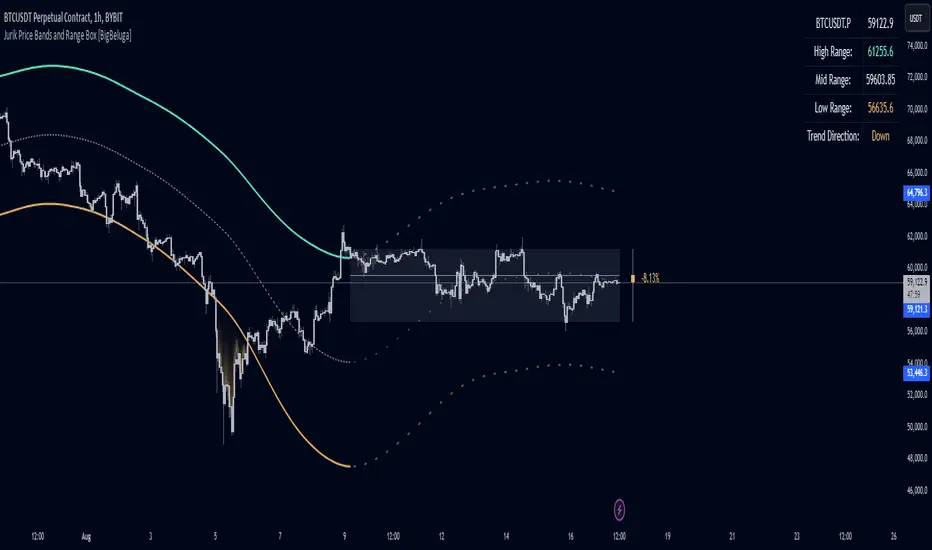
Jurik Price Bands and Range Box [BigBeluga]Jurik Price Bands and Range Box
The Jurik Price Bands and Range Box - BigBeluga indicator is an advanced technical analysis tool that combines Jurik Moving Average (JMA) based price bands with a dynamic range box. This versatile indicator is designed to help traders identify trends, potential reversal points, and price ranges over a specified period.
🔵 KEY FEATURES
● Jurik Price Bands
Utilizes Jurik Moving Average for smoother, more responsive bands
//@function Calculates Jurik Moving Average
//@param src (float) Source series
//@param len (int) Length parameter
//@param ph (int) Phase parameter
//@returns (float) Jurik Moving Average value
jma(src, len, ph) =>
var float jma = na
var float e0 = 0.0
var float e1 = 0.0
var float e2 = 0.0
phaseRatio = ph < -100 ? 0.5 : ph > 100 ? 2.5 : ph / 100 + 1.5
beta = 0.45 * (len - 1) / (0.45 * (len - 1) + 2)
alpha = math.pow(beta, phaseRatio)
e0 := (1 - alpha) * src + alpha * nz(e0 )
e1 := (src - e0) * (1 - beta) + beta * nz(e1 )
e2 := (e0 + phaseRatio * e1 - nz(jma )) * math.pow(1 - alpha, 2) + math.pow(alpha, 2) * nz(e2 )
jma := e2 + nz(jma )
jma
Consists of an upper band, lower band, and a smooth price line
Bands adapt to market volatility using Jurik MA on ATR
Helps identify potential trend reversal points and overextended market conditions
● Dynamic Range Box
Displays a box representing the price range over a specified period
Calculates high, low, and mid-range prices
Option for adaptive mid-range calculation based on average price
Provides visual representation of recent price action and volatility
● Price Position Indicator
Shows current price position relative to the mid-range
Displays percentage difference from mid-range
Color-coded for quick trend identification
● Dashboard
Displays key information including current price, range high, mid, and low
Shows trend direction based on price position relative to mid-range
Provides at-a-glance market context
🔵 HOW TO USE
● Trend Identification
Use the middle of the Range Box as the primary trend reference point
Price above the middle of the Range Box indicates an uptrend
Price below the middle of the Range Box indicates a downtrend
The bar on the right shows the percentage distance of the close from the middle of the box
This percentage indicates both trend direction and strength
Refer to the dashboard for quick trend direction confirmation
● Potential Reversal Points
Upper and lower Jurik Bands can indicate potential trend reversal points
Price reaching or exceeding these bands may suggest overextended conditions
Watch for price reaction at these levels for possible trend shifts or pullbacks
Range Box high and low can serve as additional reference points for price action
● Range Analysis
Use Range Box to gauge recent price volatility and trading range
Mid-range line can act as a pivot point for short-term price movements
Percentage difference from mid-range helps quantify price position strength
🔵 CUSTOMIZATION
The Jurik Price Bands and Range Box indicator offers several customization options:
Adjust Range Box length for different timeframe analysis
Toggle between standard and adaptive mid-range calculation
Standard:
Adaptive:
Modify Jurik MA length and deviation for band calculation
Toggle visibility of Jurik Bands
By fine-tuning these settings, traders can adapt the indicator to various market conditions and personal trading strategies.
The Jurik Price Bands and Range Box indicator provides a multi-faceted approach to market analysis, combining trend identification, potential reversal point detection, and range analysis in one comprehensive tool. The use of Jurik Moving Average offers a smoother, more responsive alternative to traditional moving averages, potentially providing more accurate signals.
This indicator can be particularly useful for traders looking to understand market context quickly, identify potential reversal points, and assess current market volatility. The combination of dynamic bands, range analysis, and the informative dashboard provides traders with a rich set of data points to inform their trading decisions.
As with all technical indicators, it's recommended to use the Jurik Price Bands and Range Box in conjunction with other forms of analysis and within the context of a well-defined trading strategy. While this indicator provides valuable insights, it should be considered alongside other factors such as overall market conditions, volume, and fundamental analysis when making trading decisions.