"mtf" için komut dosyalarını ara
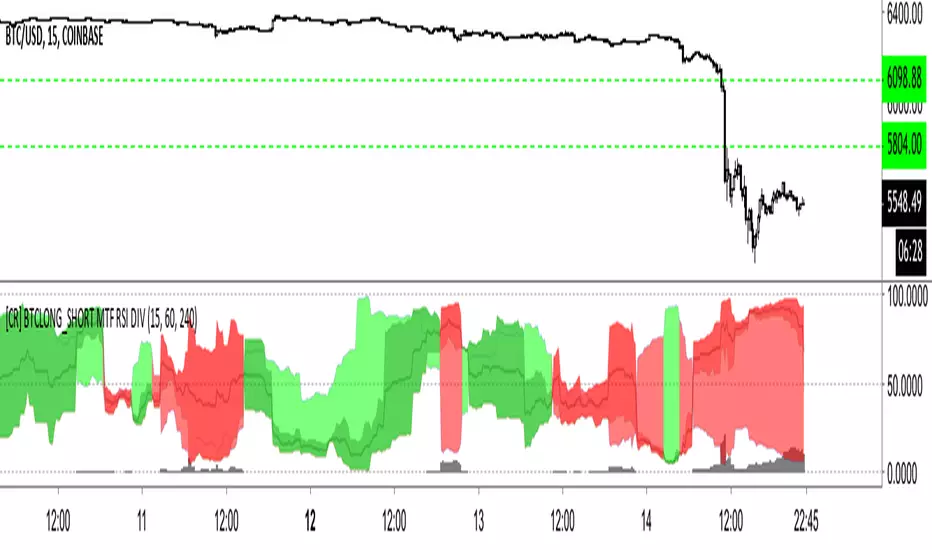
[CR] BTCLONG_SHORT MTF RSI DIV+ MTF x 3 BTCSHORT and BTCLONG on BITFINEX RSI
+ SHORT vs LONG RSI + Difference
This indicator demonstrates the difference between BTCLONG and BTCSHORT values on BITFINEX and compares their relative difference also in RSI.
Red = SHORT > LONG
Lime Over Green = LONG > SHORT difference RSI greater than LONG vs SHORT RSI.
Red Over Darker Red = SHORT > LONG difference RSI greater than SHORT vs LONG RSI.
Black trend line = Total SHORT/LONG RSI
Grey Columns = Total RSI / Difference RSI
MTF TRIX - squattterBest setting is 5, with a couple of signal lines set to 7 and 14 for crossovers or bounces.

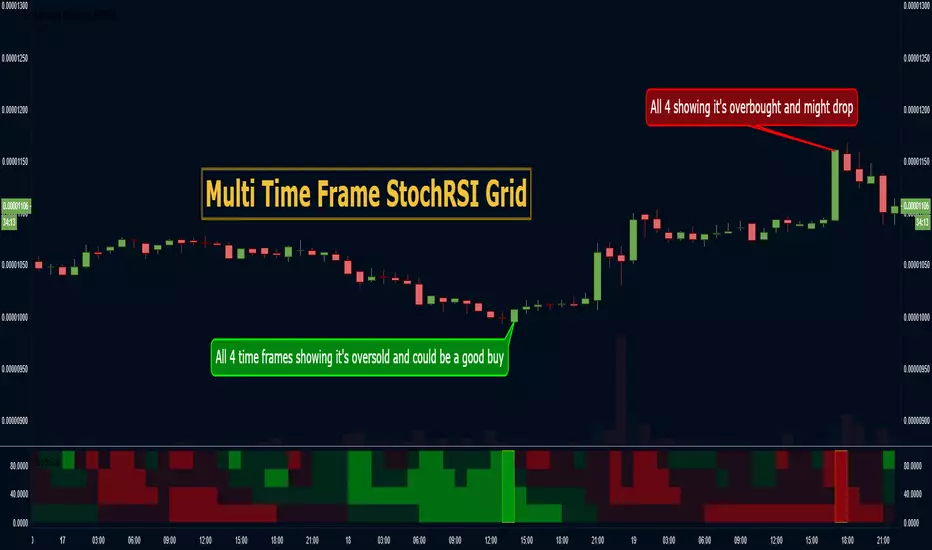
MTF StochRSI Grid - CryptoProToolsUsing this Grid you can monitor StochRSI OB and OS levels across multiple time frames with ease!
----------------------------------------------------------------------
Popular Recent Releases by CryptoProTools
----------------------------------------------------------------------
----------------------------------------------------------------------
May the profit be with you!
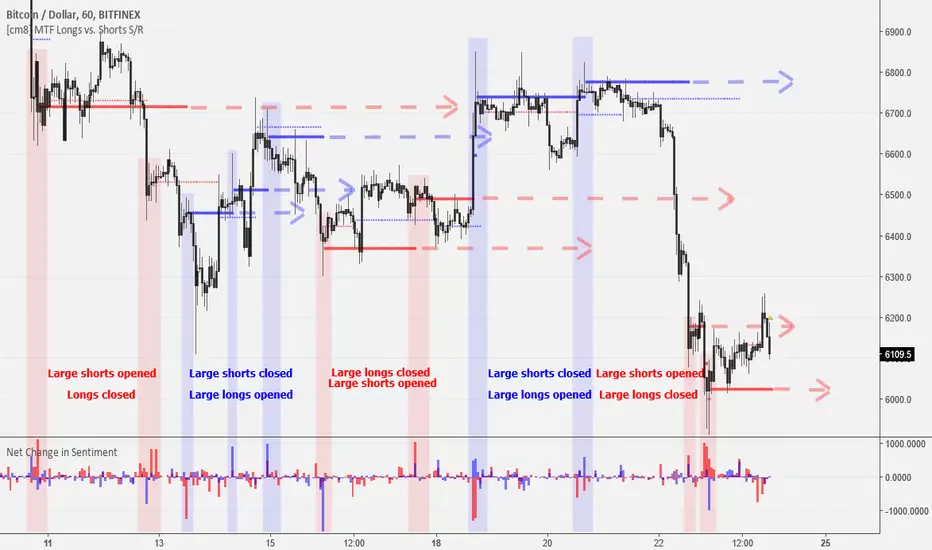
MTF Bitfinex Longs vs. Shorts Support/Resistance [checkm8]Hello and welcome to my multi-timeframe support and resistance indicator based on margin longs and shorts on Bitfinex :D
The premise of the script is simple. It draws support and resistance levels based on large margin movements ( effectively showing the break-even points of those positions ), where:
Longs opening and shorts closing is bullish pressure
Longs closing and shorts opening is bearish pressure
You can select your desired timeframe for the script to show the levels on. The script draws two sets of lines, one based on medium-sized movements and another based on large movements, where you can also manually input the size of the movements for it to track. By default, the script is optimized for 1-hour timeframes on BTCUSD, where the medium sized movements are set to bullish/bearish pressures of over 500 BTC, and large movements based on pressures of over 1000 BTC.
If you choose to use a different currency pair (ex. LTCUSD, ETCUSD, EOSUSD, etc..) you must adjust the volume that the script tracks , as tracking something like a 500 margin long in XRPUSD is useless. This also applies to timeframes , as timeframes lower than 1 hour may require smaller input values, while larger timeframes will require larger movements.
In addition, there is an input for the source. I recommend leaving this setting at hlc3 , because this will capture a more appropriate break-even points for the S/R levels.
A few tips:
If the current price is under a bullish support/resistance level , this implies that the bullish margin positions are underwater (the price is below their long break-evens), ie. shorts closed at the top or longs were entered at the top
If the current price is above a bullish support/resistance level , this implies that the bullish margin positions are in profit and will act as support (they will support their long break-even points)
If the current price is under a bearish support/resistance level , this implies that the bearish margin positions are in profit and will act as resistance (the price is below their short break-evens)
If the current price is above a bearish support/resistance level , this implies that the bearish margin positions are underwater (the price is above their short break-evens), ie. shorts entered at the bottom or longs were closed at the bottom
Happy trading and feel free to reach out with feedback and suggestions! :D
Special thanks goes to oh92 for his input and feedback on the idea. Check out his profile and his vast selection of indicators in the links below!
www.tradingview.com
depthhouse.com

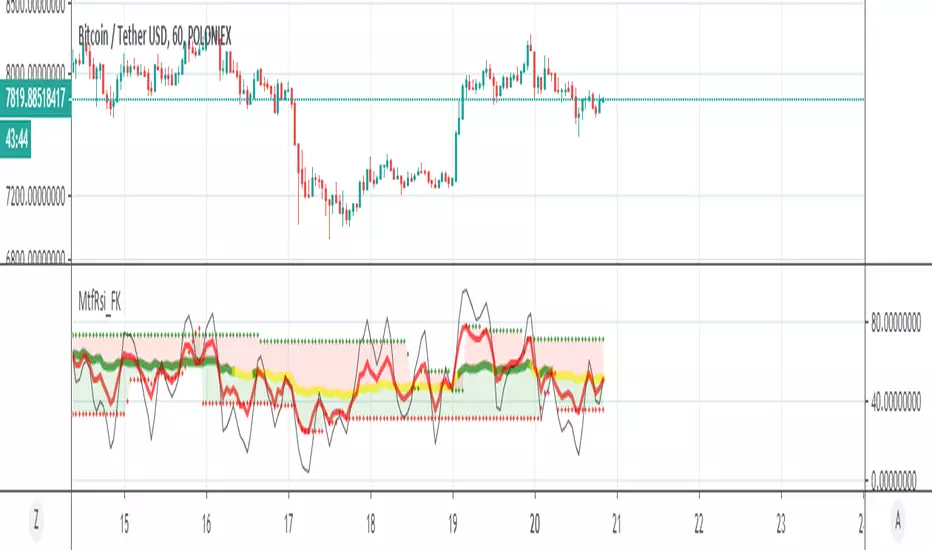
MTF RSIHello traders, I am happy to share with you my latest indicator I have developed. It's called " MTF RSI ".
The core idea of the EA is to get the average of RSI value of multiple timeframes, current , 3x and 6x of current time frame, and calculate a more accurate RSI value which will indicate more clear oversold or overbought levels that rsi has reached.
It is believed that when there is a convergence of the same indicator in multiple time frames, it is more likely traders will obtain a valid signal.
Besides the averaged RSI, an EMA of period of 14 is added to this EA. Traders can make use of crossing signals to kick off their trade decisions.
Please provide feedback on how I can improve this indicator and provide better quality signals. Thank you

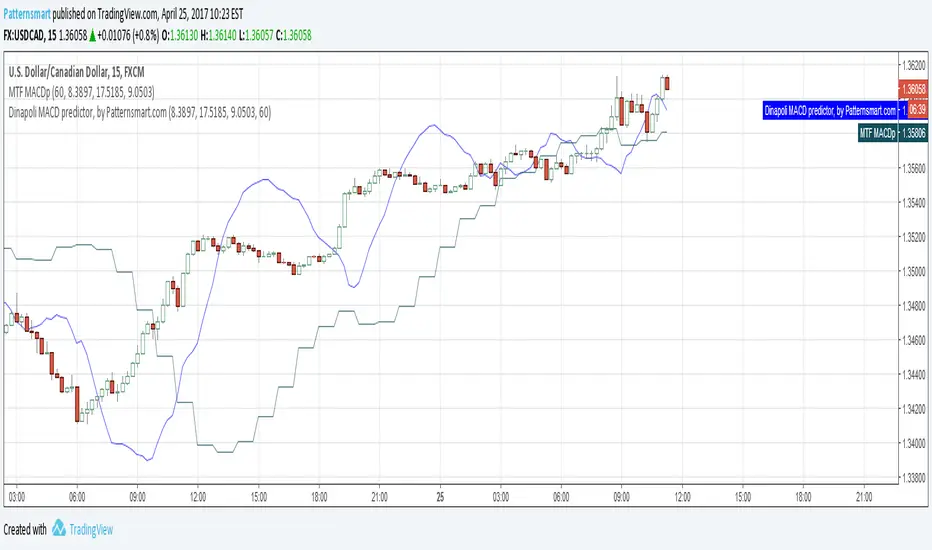
MTF Dinapoli MACD predictor V2This is the Multi Time Frame version of Dinapoli MACD predictor indicator
Fixed a bug of previous version.
Dinapoli macd predictor is a trending indicator that give you not only what direction a forex pair is moving but also how volatile the price is. When the Forex market starts giving new max or minimum level values, the Dinapoli macd predictor follows the price trend direction and pullsup the level of quit from the currency market . Stops should be applied where they are for a purpose, and in that case, should not be changed.
The whole idea behind a practical trading plan is to keep it as simple as possible.
MTF Trend 4 in 1 Multi Time Frame V2Price can be up trend and downtrend simultaneously in different timeframes.
Experienced traders know the importance of looking at Multiple Time Frames.
Analyzing multi time frame chart allows trader to have a greater view on the price action.
This MTF trend indicator shows the trend of current time frame and 3 higher time frames in a single chart. In addition, it will check the consistence of all 4 time frames. It will not repaint.
It will only work on time based charts. Tick and range charts are not supported.
The green dots represent uptrend, and the red dots represent downtrend.
The 'trend period' is used to measure the direction of price within the given number of bars.
The dots of value 1 at the bottom is the trend of 'timeframe 1'
The dots of value 2 is the trend of 'timeframe 2'
The dots of value 3 is the trend of 'timeframe 3'
The dots of value 4 is the trend of current timeframe.
If current and 3 higher time frames are in the same direction, the dots at the top will appear.
Otherwise, there will be no dots at value 6.
'timeframe1' 'timeframe2' and 'timeframe3' must be higher than current timeframe, if your chart is 15min, 'timeframe1' 'timeframe2' and 'timeframe3' must be15min or higher.
It will highlight bars when trends are inconsistent in different timeframes.
You can change the highlight color, or disable this feature.
The highlighted bars represent the situation where price may change its direction from previous trend, or in a short-term adjustment.


B3 MTF OHLCB3 M ulti T ime F rame - O pen H igh L ow C lose
For showing a 2nd resolution on one chart; Not much more to say about that :)

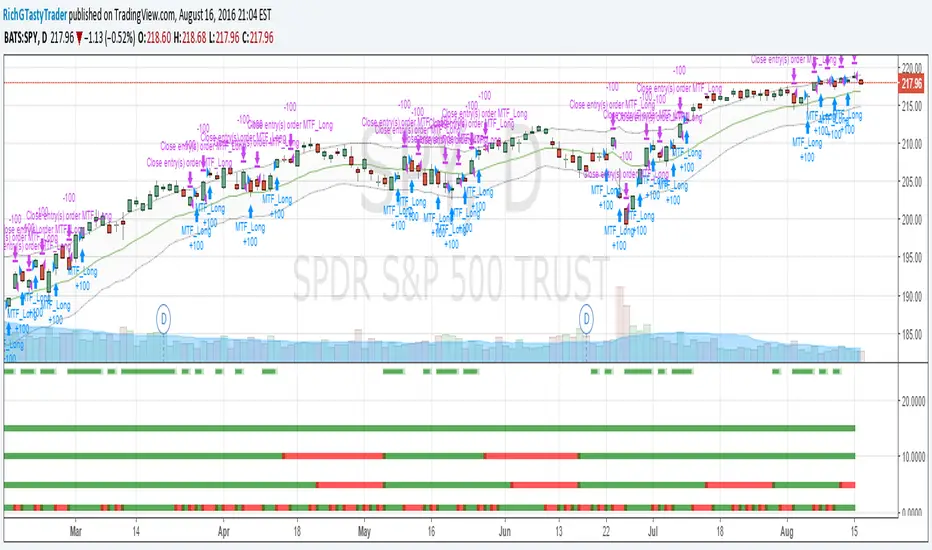
[RichG] Easy MTF Strategy v1.1This is a second attempt at an easy to understand multiple time frame strategy. This one uses ATR for exits. If the position is long, and the price closes below the ATR multiplier, it triggers a close. If the position is short, and the price closes above the ATR/multiplier, it triggers a close. This generates a lot of little trades but is useful because it uses multiple time frames along with cutting losses when the ATR disagrees.
MTF Stochastic CCI ALERTWorks good on 5 or 15min set to the 2hr or 4hr time frame.
Set an alarm (Set an alert on each Long/Short "crossing down", 0.8 (or anything below 0.99), "on condition" )
Or just as a visual.
Best to use other factors to confirm but most of the time it does a pretty decent job.

[RichG] Easy MTF StrategyAs we all know, timeframe agreement is a powerful tool. This strategy uses 4 time frames and the Keltner ATR for entries and exits.

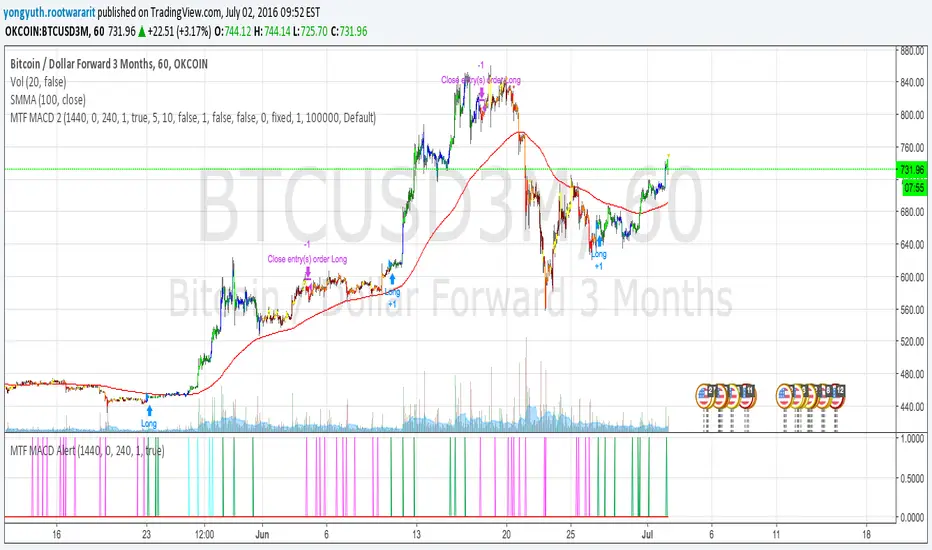
MTF MACD 2 By YuthavithiIf you want a good strategy without repaint. This one might be for you. Excellent profitable for BTCUSD3M for OKCoin.
It uses multiple time frame MACD for trading decision. To avoid repaint, set the delay period = 1 for both long term and midterm.
The idea is that, if long term, mid term and current time frame all agree on traidng direction, the trade will take place.
I also uses it in my automated trading bot with good result.
www.tradingview.com
Tamil | MTF DashboardThe Tamil | MTF Dashboard is a powerful multi-timeframe (MTF) market strength and trend-bias analyzer designed to give traders a fast, at-a-glance understanding of market conditions across 7 timeframes.
This dashboard consolidates essential indicators into a clean table plus a dynamic bias label that updates live with the chart timeframe.
⸻
✅ What This Dashboard Shows
1. RSI (Multi-Timeframe)
• Uses custom color logic:
• Green: RSI > 55
• Red: RSI < 45
• Gray: Neutral zone (45–55)
• Quickly identifies momentum shifts across multiple timeframes.
2. Stochastic (Multi-Timeframe)
• Values clamped to 0–100
• Color-coded:
• Oversold (<20): Green
• Overbought (>80): Red
• Neutral: Gray
3. Supertrend Direction
• Returns Buy / Sell / Neutral per timeframe
• Color-coded trend bias for quick directional confirmation.
4. Moving Average Trend (SMA or EMA)
• Choose between SMA or EMA
• Shows whether price is above/below MA
• Above MA → Bullish (Buy)
• Below MA → Bearish (Sell)
5. Combined Score (-4 to +4)
A powerful numeric sentiment summarizing 4 trend components:
• RSI score
• Stochastic score
• Supertrend score
• MA trend score
Each indicator contributes -1, 0, or +1, giving a total score:
• +2 to +4 = Bullish
• -2 to -4 = Bearish
• Between -1 and +1 = Neutral
Includes Trend Strength:
• Very Weak
• Weak
• Moderate
• Strong
All shown inside the Score cell per timeframe.
⸻
📌 Bias Label (Chart Timeframe Only)
Displays real-time information for the active chart timeframe:
• Bias (Bullish / Bearish / Neutral)
• Combined Score
• ATR value
• ADX value (0–100, DI-based calculation)
Perfect for gauging trend strength without cluttering the chart.
⸻
🧩 Supported Timeframes
The dashboard updates the following timeframes simultaneously:
• 1m, 3m, 5m, 15m, 1H, 4H, 1D
⸻
🎯 Designed For
• Intraday traders
• Swing traders
• Scalpers
• Multi-timeframe analysts
• Traders who want instant visual confirmation of market strength
⸻
⭐ Why This Dashboard Is Unique
• True multi-timeframe aggregation
• Custom, realistic scoring engine
• Accurate ADX (0–100) matching textbook DI calculation
• Clean color logic for fast interpretation
• Zero repainting (uses standard indicators + request.security)
• Works on any market: Stocks, Crypto, Forex, Futures

Indicator ***TuYa*** V8.2 – HH/HL MTF + Peak Mid ZoneIndicator TuYa V8.0 – HH/HL MTF + Peak Mid Zone
TuYa V8.0 combines multi-timeframe market structure with a Peak Reaction midline to create clean, rule-based reversal and trend entries – designed primarily for 1-minute execution with 1-hour bias.
🧠 Core Concept
This indicator fuses three ideas:
HTF Peak Reaction Midline (1H)
Uses a Peak Reaction style logic on the higher timeframe (HTF, default: 1H).
Identifies a reaction high and reaction low, then calculates their midpoint → the Peak Mid Zone.
This midline acts as a dynamic sentiment divider (above = premium / below = discount).
Multi-Timeframe HH/HL/LH/LL Structure
HTF structure (1H): detects HH, HL, LH, LL using pivot highs/lows.
LTF structure (1m): detects HH, HL, LH, LL on the execution timeframe (chart TF, intended for 1m).
HTF → LTF Confirmation Window
After a 1H structure event (HH, HL, LL, LH), the indicator opens a confirmation window of up to N LTF candles (default: 10 x 1m bars).
Within that window, the required 1m structure event must occur to confirm an entry.
🎯 Signal Logic
All entries are generated on the LTF (e.g. 1m chart), using HTF (e.g. 1H) bias + Peak Mid Zone:
1️⃣ Price ABOVE Peak Mid (Bullish premium zone)
Reversal SELL
HTF: HH (Higher High)
Within N 1m bars: LTF HH
→ SELL signal (fading HTF strength near premium)
Trend/Bullish BUY
HTF: HL (Higher Low)
Within N 1m bars: LTF LL
→ BUY signal (buying dips in an uptrend above midline)
2️⃣ Price BELOW Peak Mid (Bearish discount zone)
Reversal BUY
HTF: LL (Lower Low)
Within N 1m bars: LTF LL
→ BUY signal (catching potential reversal from discount)
Trend/Bearish SELL
HTF: LH (Lower High)
Within N 1m bars: LTF HH
→ SELL signal (shorting strength in a downtrend below midline)
Signals are plotted as small BUY/SELL triangles on the chart and exposed via alert conditions.
🧾 Filters & Options
⏳ HTF → LTF Delay Window
Input: “Max 1m bars after HTF trigger” (default: 10)
After a 1H HH/HL/LL/LH event, the indicator waits up to N LTF candles for the matching 1m structure pattern.
If no match occurs within the window, no signal is generated.
📉 RSI No-Trade Zone (HTF)
Toggle: Use RSI no-trade zone
Inputs:
RSI Length (HTF)
No-trade lower bound (default 45)
No-trade upper bound (default 65)
If HTF RSI is inside the defined band (e.g. 45–65), signals are blocked (no-trade regime), helping to avoid noisy mid-range conditions.
You can turn this filter ON/OFF and adjust the band dynamically.
🧱 5m OB / Direction Filter (Optional)
Toggle: Use 5m OB direction filter
Timeframe: Configurable (default: 5m).
Uses a simple directional proxy on the OB timeframe:
For BUY signals → require a bullish candle on OB timeframe.
For SELL signals → require a bearish candle on OB timeframe.
When enabled, this adds an extra layer of confluence by aligning entries with the short-term directional context.
⚙️ Key Inputs (Summary)
Timeframes
HTF (Peak Reaction & Structure): default 60 (1H)
Peak Reaction
Lookback bars (HTF)
ATR multiplier for zones
Show/Hide Peak Mid line
Structure
Pivot left/right bars (for HH/HL/LH/LL swings)
Toggle structure labels (HTF & LTF)
Confirmation
Max LTF bars after HTF trigger (default 10, fully configurable)
RSI Filter
Use filter (on/off)
RSI length
No-trade range (low/high)
5m OB Filter
Use filter (on/off)
OB timeframe (default 5m)
📡 Alerts & Automation
The script includes alertconditions for both BUY and SELL signals, with JSON-formatted alert messages suitable for routing to external bridges (e.g. bots, MT5/MT4, n8n, etc.).
Each alert includes:
Symbol
Side (BUY / SELL)
Price / Entry
SL & TP placeholders (from hidden plots, ready to be wired to your own logic)
Time
Performance tag
CommentCode (for strategy/type tagging on the receiver side)
You can attach these alerts to a webhook and let your execution engine handle SL/TP and order management.
📌 How to Use
Attach the indicator to a 1-minute chart.
Set HTF timeframe to 60 (or your preferred higher timeframe).
Optionally enable:
RSI regime filter
5m OB direction filter
Watch for:
Price relative to the Peak Mid line
BUY/SELL triangles that respect HTF structure + LTF confirmation + filters.
For automation, create alerts using the built-in conditions and your preferred JSON alert template.
⚠️ Disclaimer
This tool is for educational and informational purposes only.
It is not financial advice and does not guarantee profits. Always test thoroughly in replay / paper trading before using with live funds, and trade at your own risk.

Moving Average with Multiple Display Mode(MTF/Non MTF MA)Japanese below / 日本語説明は下記
It's an upper version of "MTF SMA on specific timeframe(5M-4H)" which I previously developed.
MTF SMA on specific timeframe(5M-4H)
This is a simple indicator that shows a moving average(MA) but you can choose two display mode depending on your needs;
1. MTF mode
2. Non MTF Mode(Display always)
1. MTF mode
MA becomes MTF MA, meaning that a MA is displayed on the timeframe that users select as MTF MA timeframe or lower timeframe.
i.e. If you select Daily timeframe from MTF MA timeframe, MA will be displayed on daily or lower timeframe; daily, 4 hour, 1 hour, 30mins, 15min, 5mins, 1min.
Note: You need to select "MTF MA timeframe" on input screen.
2. Non MTF Mode(Display always)
MA will always be displayed regardless of timeframe that users open.
Note: If you select Non MTF Mode, MTF MA timeframe on input screen is ignored.
Enjoy your trading!
----------------------------------------------------
以前リリースした "MTF SMA on specific timeframe(5M-4H)" の上位バージョンインジケーターです。
MTF SMA on specific timeframe(5M-4H)
1本の移動平均線(MA)を表示するインジケーターですが、ユーザーのニーズに応じて二つの表示モードを選択することができます。
1. MTFモード
2. Non MTFモード
(常に表示)
1. MTFモード
上位足のMAを下位足に表示するMTF MAとして機能させることができます。MAはユーザーが上位足のタイムフレームとして選択したタイムフレームとそれ未満のタイムフレームで表示されます。
例: 日足を上位足タイムフレームとして選択した場合、日足のMAが日足とそれ以下のタイムフレーム(4時間足、1時間足、30分足、15分足、5分足、1分足)に表示されます。
注: 設定画面で"MTF MA timeframe" を上位足のタイムフレームとして選択してください。
2. Non MTFモード
(常に表示)
ユーザーが現在開いているタイムフレームに関係なく、設定したMAが各タイムフレームで常に表示されます。通常の移動平均線インジケーターと同じ機能です。
注: Non MTFモードを選択した場合、設定画面のMTF MA timeframe は無視されます。

12 multi time frame MA displayed on specific timeframe/複数MTF MAJapanese below. / 日本語説明は下記
——Republishing after issues pointed out by a moderator resolved.—————
This indicator shows 12 sets of multi time frame moving average(MTF MA) from different time frames which is weekly, daily, 4 hour and 1 hour to lower time frames.
Purpose
This indicator has been developed to show higher timeframe’s moving average as they are expected to work as support and resistance .
How is it different from other MTF MA indicators?
Problems with other conventional MTF MA indicators are;
1.If you set higher timeframe MA, it will also be shown on further higher time frames.
e.g. If you set 4hour chart’s MA on 1 hour or lower time frame charts, it will also appear on daily and weekly chart, which is unnecessary and annoys your chart.
2.One indicator displays one MTF MA only which impacts the number of indicators that you can set.
To tackle these problems, this indicator has incorporated functions below.
1. Control time frames where MTF MA is displayed to avoid showing unnecessary information.
2. One indicator contains 12 MTF MA in which 3 MTF MA from weekly chart, 3 MTF MA from daily chart , 3 MTF MA from 4 hour chart and 3 MTF MA from 1 hour chart. Thus, this contributes to save the number of indicators that you can set.
These are the value added on this indicator.
Specification
-This indicator shows weekly MTF MA, daily MTF MA, 4 hour MTF MA and 1 hour MTF MA.
To be clear, daily MTF MA means that moving average created based on daily chart , which can be shown on daily chart and lower timeframes.
-Each MTF MA will be shown as follows based on timeframes that you select.
1. Weekly MTF MA: Shown on weekly, daily, 4hour, 1 hour, 30M, 15M and 5M chart(Monthly chart does not show MTF MA)
2. Daily MTF MA: Shown on daily, 4hour, 1 hour, 30M, 15M and 5M chart(Weekly and Monthly chart does not show MTF MA)
3. 4hour MTF MA: Shown on 4hour, 1 hour, 30M, 15M and 5M chart(Daily, Weekly and Monthly chart does not show MTF MA)
4. 1hour MTF MA: Shown on 1 hour, 30M, 15M and 5M chart(4hour, Daily, Weekly and Monthly chart does not show MTF MA)
-Each MTF MA can be enabled and disabled by ticking checkbox.
Sample chart with the indicator
●Sample parameters setting
2 MA from weekly timeframe and 3 MA from daily timeframe set.
Here is how MAs are displayed.
It does not show anything.
Only 2 MA from weekly timeframe are shown. MA from daily timeframe are not appeared. This is the difference between this indicator and other conventional MTF MA indicators.
You can see 5 MAs, which are 2 MA from weekly timeframe and 3 MA from daily timeframe .
<4hour chart>
<15M chart>
Journey to use indicator
This indicator is paid indicator and invited-only indicator.
Please contact me via private chat or follow links in my signature so that we can initiate the process to access the indicator
--------------------------------------------------------------------------------------------------
週足、日足、4時間足、1時間足という異なる複数のタイムフレームから最大で12本(各タイムフレームから3本ずつ)のマルチタイムフレーム移動平均線を設定できるインジケーターです。
インジケーターの目的
上位足の移動平均線を下位足に表示することで、上位足での目線を持ったまま下位足の分析を行ったり、上位足によるレジサポの判断に使うことを想定しています。
他のマルチタイムフレーム移動平均線との違い
他のマルチタイムフレーム移動平均線インジケーターでは、よく以下の問題に直面します。
・上位足の移動平均線を表示しようとすると、さらに上位足でもその移動平均線が表示され、チャートが見にくくなる。
例: 4時間足の移動平均線を1時間足で表示可能なように設定すると、日足や週足でも4時間足の移動平均線が表示され、チャートがノイズだらけに・・・
・一つのインジケーターでは原則一つの移動平均線のみ表示。異なる時間軸のマルチタイムフレーム移動平均線を表示しようとするとその数だけインジケーターを追加する必要あり。
これらの問題に対応するため、このインジケーターでは、
・マルチタイムフレーム移動平均線を表示する時間軸を制御することで上位足側に不必要な情報を表示させない。これによりチャートをスッキリと見やすくすることができる。
・週足、日足、4時間足、1時間足という4つの異なる時間軸から3つずつ、最大で12本のマルチタイムフレーム移動平均線を設定可能。これによりインジケーター数を節約。
という機能を加えることでこれらの問題を解決しています。
これがこのインジケーターが提供する付加価値だと考えています。
仕様
機能概要
・このインジケーターでは週足、日足、4時間足、1時間足の4つの時間軸のマルチタイムフレーム移動平均線を表示します。
・設定できる移動平均線は週足から3本、日足から3本、4時間足から3本、1時間足から3本の最大12本まで設定可能です。
・それぞれの移動平均線はSMA(単純移動平均線)とEMA(加重移動平均線)を選択することができます。期間の設定も移動平均線ごとに設定可能です。
・各移動平均線は表示しているチャートの時間軸に応じて以下の様に表示されます。
例えば週足の移動平均線を設定すると、その移動平均線は週足、日足、4時間足、1時間足、30分、15分、5分足に表示されます。
・毎回チャートを開くごとにそれぞれの移動平均線の表示・非表示を切り替えることは可能ですが、この移動平均線はこの時間足では常に非表示といった制御は不可能です。
サンプルチャート
週足の移動平均線を2本、日足の移動平均線を3本設定した場合のチャートの例です。
<月足>
月足では週足の移動平均線も日足の移動平均線も表示されません。
<週足>
週足では2本の移動平均線のみが表示されていることがわかります。
日足の移動平均線が上位足である週足に表示されないのが、他のマルチタイムフレーム移動平均線との違いです。
<日足>
日足では週足と日足両方の移動平均線が表示されます。
<4時間足>
<15分足>
インジケーターの使用について
当インジケーターは招待制インジケーター(有料)となっています。
使用を希望される方はプライベートチャットや下記リンクのDMでご連絡ください。
このページのコメント欄はインジケーターそのものに対するコメントやアップデートの記載のためのものとなっております。Tradingviewのハウスルールを守るためにもコメント欄からの連絡はご遠慮ください。

Multi SMA EMA WMA HMA BB (4x3 MAs Bollinger Bands) Pro MTF - RRBMulti SMA EMA WMA HMA 4x3 Moving Averages with Bollinger Bands Pro MTF by RagingRocketBull 2018
Version 1.0
This indicator shows multiple MAs of any type SMA EMA WMA HMA etc with BB and MTF support, can show MAs as dynamically moving levels.
There are 4 MA groups + 1 BB group. You can assign any type/timeframe combo to a group, for example:
- EMAs 50,100,200 x H1, H4, D1, W1 (4 TFs x 3 MAs x 1 type)
- EMAs 8,13,21,55,100,200 x M15, H1 (2 TFs x 6 MAs x 1 type)
- D1 EMAs and SMAs 12,26,50,100,200,400 (1 TF x 6 MAs x 2 types)
- H1 WMAs 7,77,231; H4 HMAs 50,100,200; D1 EMAs 144,169,233; W1 SMAs 50,100,200 (4 TFs x 3 MAs x 4 types)
- +1 extra MA type/timeframe for BB
compile time: 25-30 sec
full redraw time after parameter change in UI: 3 sec
There are several versions: Simple, MTF, Pro MTF, Advanced MTF and Ultimate MTF. This is the Pro MTF version. The Differences are listed below. All versions have BB
- Simple: you have 2 groups of MAs that can be assigned any type (5+5)
- MTF: +2 custom Timeframes for each group (2x5 MTF)
- Pro MTF: +4 custom Timeframes for each group (4x3 MTF), MA levels and show max bars back options
- Advanced MTF: +2 extra MAs/group (4x5 MTF), custom Ticker/Symbol, backreferences for type, TF and MA lengths in UI
- Ultimate MTF: +individual settings for each MA, custom Ticker/Symbols
Features:
- 4x3 = 12 MAs of any type including Hull Moving Average (HMA)
- 4x MTF groups with step line smoothing
- BB +1 extra TF/type for BB MAs
- 12 MA levels with adjustable group offsets, indents and shift
- show max bars back
- you can show/hide both groups of MAs/levels and individual MAs
Notes:
1. based on 3EmaBB, uses plot*, barssince and security functions
2. you can't set certain constants from input due to Pinescript limitations - change the code as needed, recompile and use as a private version
3. Levels = trackprice implementation
4. Show Max Bars Back = show_last implementation
5. uses timeframe textbox instead of input resolution to allow for 120 240 and other custom TFs. Also supports TFs in hours: 2H or H2
6. swma has a fixed length = 4, alma and linreg have additional offset and smoothing params
7. Smoothing is applied by default for visual aesthetics on MTF. To use exact ma mtf values (lines with stair stepping) - disable it
MTF Notes:
- uses simple timeframe textbox instead of input resolution dropdown to allow for 120, 240 and other custom TFs, also supports timeframes in H: 2H, H2
- Groups that are not assigned a Custom TF will use Current Timeframe (0).
- MTF will work for any MA type assigned to the group
- MTF works both ways: you can display a higher TF MA/BB on a lower TF or a lower TF MA/BB on a higher TF.
- MTF MA values are normally aligned at the boundary of their native timeframe. This produces stair stepping when a higher TF MA is viewed on a lower TF.
Therefore X Y Point Density/Smoothing is applied by default on MA MTF for visual aesthetics. Set both to 0 to disable and see exact ma mtf values (lines with stair stepping and original mtf alignment).
- Smoothing is disabled for BB MTF bands because fill doesn't work with smoothed MAs after duplicate values are replaced with na.
- MTF MA Value fluctuation is possible on the current bar due to default security lookahead
Smoothing:
- X,Y == 0 - X,Y smoothing disabled (stair stepping on high TFs)
- X == 0, Y > 0 - X,Y smoothing applied to all TFs
- Y == 0, X > 0 - X smoothing applied to all TFs < deltaX_max_tf, Y smoothing disabled
- X > 0, Y > 0 - Y smoothing applied to all TFs, then X smoothing applied to all TFs < deltaX_max_tf
X Smoothing with Y == 0 - shows only every deltaX-th point starting from the first bar.
X Smoothing with Y > 0 - shows only every deltaX-th point starting from the last shown Y point, essentially filling huge gaps remaining after Y Smoothing with points and preserving the curve's general shape
X Smoothing on high TFs with already scarce points produces weird curve shapes, it works best only on high density lower TFs
Y Smoothing reduces points on all TFs, removes adjacent points with prices within deltaY, while preserving the smaller curve details.
A combination of X,Y produces the most accurate smoothing. Higher delta value - larger range, more points removed.
Show Max Bars Back:
- can't set plot show_last from input -> implemented using a timenow based range check
- you can't delete/modify history once plotted, so essentially it just sets a start point for plotting (from num_bars bars back) that works only in realtime mode (not in replay)
Levels:
You can plot current MA value using plot trackprice=true or by checking Show Price Line in Style. Problem is:
- you can only change color (not the dashed line style, width), have both ma + price line (not just the line), and it's full screen wide
- you can't set plot trackprice from input => implemented using plotshape/plotchar with fixed text labels serving as levels
- there's no other way of creating a dynamic level: hline, plot, offset - nothing else works.
- you can't plot a text var - all text strings must be constants, so you can't change the style, width and text labels without recompiling.
- from input you can only adjust offset, indent and shift for each level group, and change color
- the dot below each level line is the exact MA value. If you want just the line swap plotshape with plotchar, recompile and save as your private version, adjust Y shift.
To speed up redraw times: reduce last_bars to ~2000, recompile and use as your own private version
Pinescript is a rudimentary language (should be called Painscript instead) that can basically only plot data. You can't do much else. Please see the code for tips and hints.
Certain things just can't be done or require shady workarounds and weeks of testing trying to resolve weird node.js compiler errors.
Feel free to learn from/reuse/change the code as needed and use as your own private version. See comments in code. Good Luck!
