Z-Score Multi-Model ClusteringA price/volume clustering framework combining three market behavior models into a single indicator. Designed to help identify emerging trend strength, turning points, and volatility-driven entries or exits.
🔍 How It Works
This indicator classifies market states by comparing normalized price/volume behavior (via Z-Score) to different types of statistical or geometric "cluster centers." You can choose from three clustering approaches:
🧠 Clustering Models
1. Percentile (Z+CVD) – Trend Momentum Bias
Uses volume Z-Score + Cumulative Volume Delta (CVD).
Detects institutional pressure by clustering volume surges with directional delta.
Best for: Breakouts, momentum trades, volume-led reversals.
Cluster Colors:
🔹 Green triangle = Strong bullish confluence
🔻 Red triangle = Bearish divergence (bull trap risk)
⚪ Gray = Neutral/low conviction
2. Euclidean (Z+Slope) – Swing Mean-Reversion
Measures the angle of recent Z-score slope and compares it to directional cluster centers.
Helps detect early directional shifts or exhaustion.
Best for: Swing entries, pullback setups, exit timing
3. Hilbert Phase – Turn Detection via Signal Phase
Applies Hilbert Transform to the Z-Score, measuring the phase difference between trend and oscillator components.
Ideal for anticipating turns or detecting cyclical inflection points.
Useful for: Scalping, top/bottom spotting, volatility fades
✅ Features
Auto-updating cluster logic based on current data
Tooltips and clean user interface
Optional cluster bar coloring (can be toggled off)
Signal-only plotting keeps candlesticks readable
Clear entry/exit logic with triangle markers
Supports trend, swing, and oscillation-based systems
🛠️ Suggested Use Cases
Combine with VWAP, Session High/Low, or Liquidity Zones to confirm entry conditions.
Use Cluster 2 (strong bullish) on pullbacks to trend structure for add-on entries.
Use Cluster 1 in strong trends to watch for potential traps or exits.
Toggle models based on your strategy: e.g., Hilbert for scalping, Percentile for macro trend breaks.
🧪 Best Timeframes
Works across all markets and timeframes
For Percentile (Z+CVD), use intraday TF with 1m–5m CVD source
Hilbert and Euclidean preferred on 5m–1h for accurate slope/phase signals
⚠️ Notes
Clusters do not generate trade signals alone; use them in context with structure, VWAP, or trend filters.
Marker signals are filtered with a magnitude threshold to reduce noise.
Komut dosyalarını "liquidity" için ara

Momentum Candle V2 by Sekolah Trading📌 Momentum Candle V2 by Sekolah Trading – Pair-Based Volatility & Wick Ratio Filter
This script provides a structured and adaptive approach to detecting high-probability momentum candles in intraday markets. It dynamically adjusts pip thresholds and wick filtering conditions based on the selected symbol and timeframe, making it highly practical for real-time trading.
🔍 Concept and Originality
Momentum Candle V2 by Sekolah Trading implements a custom-built methodology combining:
Dynamic Pip Calibration
For each supported instrument (e.g., XAUUSD, USDJPY, GBPUSD, AUDUSD, EURUSD, BTCUSD), the user can define a pip threshold that determines the minimum valid body size for momentum candles. These thresholds are tailored for each pair and timeframe (M5, M15, H1), ensuring the logic adjusts to different volatility profiles.
Wick-to-Body Ratio Filtering
The script filters out candles with large wicks by requiring that total wick length (upper + lower) be no more than 30% of the full candle range. This helps identify decisive candles with minimal rejection.
Directional Validation
Bullish momentum is defined as: Close > Open with a shorter upper wick.
Bearish momentum is: Close < Open with a shorter lower wick.
Real-Time Timing Filter
Alerts are only triggered when the current candle is between 20 and 90 seconds from closing, which reduces noise and encourages confirmation-based entry.
Non-Repainting Logic
All calculations run in real-time with confirmed candles only — no lookahead or future leak.
📊 Visual Output – How to Read the Chart
When the conditions above are met, the script displays triangle markers on the chart:
🔺 Red downward triangle above the candle: valid bearish momentum signal
🔻 Blue upward triangle below the candle: valid bullish momentum signal
These shapes appear on live bars during the final moments of the candle to alert traders to potential confirmed momentum.
🔔 Alert Conditions
Two alert types are provided:
Momentum Bullish: Large bullish candle with small upper wick, during last 20–90s of bar
Momentum Bearish: Large bearish candle with small lower wick, same timing window
Alerts are designed for precision entries at candle close.
🧭 How to Use
Apply the script to a 5m, 15m, or 1h chart.
Configure pip thresholds for your preferred pairs from the input settings.
Watch for triangle markers near the close of each candle:
Blue = potential bullish momentum
Red = potential bearish momentum
Set alerts:
Go to Alerts → Select Momentum Bullish or Momentum Bearish
Frequency: Once Per Bar
Customize message: e.g. “Momentum Bullish on XAUUSD M15”
Combine signals with:
EMA, S/R, or trend filters
Volume/Order Flow
Liquidity zone or breakout context
🛡️ Why This Script Is Closed-Source
This script uses proprietary logic developed by Sekolah Trading, including:
Custom pip calibration engine
Adaptive wick filtering
Real-time entry validation with triangle plots
While the code is protected, the methodology has been explained transparently here in accordance with TradingView publishing rules.
⚠️ Disclaimer
This script is provided for educational and technical analysis purposes only.
It does not guarantee results or provide financial advice. Always verify trades with your own strategy and risk controls.
Author: Sekolah Trading
Version: Momentum Candle V2
Built with Pine Script v6

Sniper Mini VWAPThis script plots dynamic, session-based VWAPs for key intraday timeframes:
1H (green), 4H (orange), 8H (purple), and Daily (red).
Each VWAP resets at the start of its own session, giving traders a real-time view of price relative to average volume-weighted value. These lines often act as intraday support, resistance, or liquidity magnets — great for scalping, fade setups, and sniper-style entries.
You can toggle each VWAP on or off for a cleaner chart.
This version does not use anchored VWAPs — it’s designed for traders who need fast feedback as price develops within active sessions.

National Financial Conditions Index (NFCI)This is one of the most important macro indicators in my trading arsenal due to its reliability across different market regimes. I'm excited to share this with the TradingView community because this Federal Reserve data is not only completely free but extraordinarily useful for portfolio management and risk assessment.
**Important Disclaimers**: Be aware that some NFCI components are updated only monthly but carry significant weighting in the composite index. Additionally, the Fed occasionally revises historical NFCI data, so historical backtests should be interpreted with some caution. Nevertheless, this remains a crucial leading indicator for financial stress conditions.
---
## What is the National Financial Conditions Index?
The National Financial Conditions Index (NFCI) is a comprehensive measure of financial stress and liquidity conditions developed by the Federal Reserve Bank of Chicago. This indicator synthesizes over 100 financial market variables into a single, interpretable metric that captures the overall state of financial conditions in the United States (Brave & Butters, 2011).
**Key Principle**: When the NFCI is positive, financial conditions are tighter than average; when negative, conditions are looser than average. Values above +1.0 historically coincide with financial crises, while values below -1.0 often signal bubble-like conditions.
## Scientific Foundation & Research
The NFCI methodology is grounded in extensive academic research:
### Core Research Foundation
- **Brave, S., & Butters, R. A. (2011)**. "Monitoring financial stability: A financial conditions index approach." *Economic Perspectives*, 35(1), 22-43.
- **Hatzius, J., Hooper, P., Mishkin, F. S., Schoenholtz, K. L., & Watson, M. W. (2010)**. "Financial conditions indexes: A fresh look after the financial crisis." *US Monetary Policy Forum Report*, No. 23.
- **Kliesen, K. L., Owyang, M. T., & Vermann, E. K. (2012)**. "Disentangling diverse measures: A survey of financial stress indexes." *Federal Reserve Bank of St. Louis Review*, 94(5), 369-397.
### Methodological Validation
The NFCI employs Principal Component Analysis (PCA) to extract common factors from financial market data, following the methodology established by **English, W. B., Tsatsaronis, K., & Zoli, E. (2005)** in "Assessing the predictive power of measures of financial conditions for macroeconomic variables." The index has been validated through extensive academic research (Koop & Korobilis, 2014).
## NFCI Components Explained
This indicator provides access to all five official NFCI variants:
### 1. **Main NFCI**
The primary composite index incorporating all financial market sectors. This serves as the main signal for portfolio allocation decisions.
### 2. **Adjusted NFCI (ANFCI)**
Removes the influence of credit market disruptions to focus on non-credit financial stress. Particularly useful during banking crises when credit markets may be impaired but other financial conditions remain stable.
### 3. **Credit Sub-Index**
Isolates credit market conditions including corporate bond spreads, commercial paper rates, and bank lending standards. Important for assessing corporate financing stress.
### 4. **Leverage Sub-Index**
Measures systemic leverage through margin requirements, dealer financing, and institutional leverage metrics. Useful for identifying leverage-driven market stress.
### 5. **Risk Sub-Index**
Captures market-based risk measures including volatility, correlation, and tail risk indicators. Provides indication of risk appetite shifts.
## Practical Trading Applications
### Portfolio Allocation Framework
Based on the academic research, the NFCI can be used for portfolio positioning:
**Risk-On Positioning (NFCI declining):**
- Consider increasing equity exposure
- Reduce defensive positions
- Evaluate growth-oriented sectors
**Risk-Off Positioning (NFCI rising):**
- Consider reducing equity exposure
- Increase defensive positioning
- Favor large-cap, dividend-paying stocks
### Academic Validation
According to **Oet, M. V., Eiben, R., Bianco, T., Gramlich, D., & Ong, S. J. (2011)** in "The financial stress index: Identification of systemic risk conditions," financial conditions indices like the NFCI provide early warning capabilities for systemic risk conditions.
**Illing, M., & Liu, Y. (2006)** demonstrated in "Measuring financial stress in a developed country: An application to Canada" that composite financial stress measures can be useful for predicting economic downturns.
## Advanced Features of This Implementation
### Dynamic Background Coloring
- **Green backgrounds**: Risk-On conditions - potentially favorable for equity investment
- **Red backgrounds**: Risk-Off conditions - time for defensive positioning
- **Intensity varies**: Based on deviation from trend for nuanced risk assessment
### Professional Dashboard
Real-time analytics table showing:
- Current NFCI level and interpretation (TIGHT/LOOSE/NEUTRAL)
- Individual sub-index readings
- Change analysis
- Portfolio guidance (Risk On/Risk Off)
### Alert System
Professional-grade alerts for:
- Risk regime changes
- Extreme stress conditions (NFCI > 1.0)
- Bubble risk warnings (NFCI < -1.0)
- Major trend reversals
## Optimal Usage Guidelines
### Best Timeframes
- **Daily charts**: Recommended for intermediate-term positioning
- **Weekly charts**: Suitable for longer-term portfolio allocation
- **Intraday**: Less effective due to weekly update frequency
### Complementary Indicators
For enhanced analysis, combine NFCI signals with:
- **VIX levels**: Confirm stress readings
- **Credit spreads**: Validate credit sub-index signals
- **Moving averages**: Determine overall market trend context
- **Economic surprise indices**: Gauge fundamental backdrop
### Position Sizing Considerations
- **Extreme readings** (|NFCI| > 1.0): Consider higher conviction positioning
- **Moderate readings** (|NFCI| 0.3-1.0): Standard position sizing
- **Neutral readings** (|NFCI| < 0.3): Consider reduced conviction
## Important Limitations & Considerations
### Data Frequency Issues
**Critical Warning**: While the main NFCI updates weekly (typically Wednesdays), some underlying components update monthly. Corporate bond indices and commercial paper rates, which carry significant weight, may cause delayed reactions to current market conditions.
**Component Update Schedule:**
- **Weekly Updates**: Main NFCI composite, most equity volatility measures
- **Monthly Updates**: Corporate bond spreads, commercial paper rates
- **Quarterly Updates**: Banking sector surveys
- **Impact**: Significant portion of index weight may lag current conditions
### Historical Revisions
The Federal Reserve occasionally revises NFCI historical data as new information becomes available or methodologies are refined. This means backtesting results should be interpreted cautiously, and the indicator works best for forward-looking analysis rather than precise historical replication.
### Market Regime Dependency
The NFCI effectiveness may vary across different market regimes. During extended sideways markets or regime transitions, signals may be less reliable. Consider combining with trend-following indicators for optimal results.
**Bottom Line**: Use NFCI for medium-term portfolio positioning guidance. Trust the directional signals while remaining aware of data revision risks and update frequency limitations. This indicator is particularly valuable during periods of financial stress when reliable guidance is most needed.
---
**Data Source**: Federal Reserve Bank of Chicago
**Update Frequency**: Weekly (typically Wednesdays)
**Historical Coverage**: 1973-present
**Cost**: Free (public Fed data)
*This indicator is for educational and analytical purposes. Always conduct your own research and risk assessment before making investment decisions.*
## References
Brave, S., & Butters, R. A. (2011). Monitoring financial stability: A financial conditions index approach. *Economic Perspectives*, 35(1), 22-43.
English, W. B., Tsatsaronis, K., & Zoli, E. (2005). Assessing the predictive power of measures of financial conditions for macroeconomic variables. *BIS Papers*, 22, 228-252.
Hatzius, J., Hooper, P., Mishkin, F. S., Schoenholtz, K. L., & Watson, M. W. (2010). Financial conditions indexes: A fresh look after the financial crisis. *US Monetary Policy Forum Report*, No. 23.
Illing, M., & Liu, Y. (2006). Measuring financial stress in a developed country: An application to Canada. *Bank of Canada Working Paper*, 2006-02.
Kliesen, K. L., Owyang, M. T., & Vermann, E. K. (2012). Disentangling diverse measures: A survey of financial stress indexes. *Federal Reserve Bank of St. Louis Review*, 94(5), 369-397.
Koop, G., & Korobilis, D. (2014). A new index of financial conditions. *European Economic Review*, 71, 101-116.
Oet, M. V., Eiben, R., Bianco, T., Gramlich, D., & Ong, S. J. (2011). The financial stress index: Identification of systemic risk conditions. *Federal Reserve Bank of Cleveland Working Paper*, 11-30.

Institutional Sweep Zone (Range-Based)Institutional Sweep Zone (Range-Based)
This indicator models potential stop sweep zones based on institutional capital ranges, helping traders visualize where high-probability liquidity grabs are likely to occur.
Unlike traditional volatility bands, this tool estimates price movement by calculating how far a specific amount of capital—entered into the market—can push price. By defining a lower and upper capital range (in millions of USD), the indicator dynamically draws bands representing the distance institutions could realistically move price in either direction.
It supports directional control, allowing you to focus on long sweeps, short sweeps, or both simultaneously. The pip cost is auto-calibrated based on the selected currency pair, making it highly adaptive to major FX pairs.
Key Features:
-Capital input range (in millions of USD)
-Directional sweep targeting: Long, Short, or Both
-Auto-detection of pip value based on FX pair
-Visual sweep zone mapped above and below current price
-Designed to highlight areas of institutional stop hunts
Why use it?
-Helps avoid setting stops inside common sweep zones
-Improves trade survivability when paired with higher timeframe strategies
-Offers a unique way to view price through an institutional lens
Created by: The_Forex_Steward
Explore more advanced tools and concepts on my TradingView profile.

Absorption DetectorABSORPTION DETECTOR -
The Absorption Detector identifies institutional order flow by detecting "absorption" patterns where smart money quietly accumulates or distributes positions by absorbing retail order flow. This creates high-probability support and resistance zones for trading. This is an approximation only and does not read any footprint data.
WHAT IS ABSORPTION?
Absorption occurs when institutions take the opposite side of retail trades, creating specific candlestick patterns with high volume and significant wicks. The indicator identifies two main patterns:
SELLING ABSORPTION (P-Pattern): Red zones above candles where institutions sell into retail buying pressure, creating resistance levels. Look for high volume candles with large upper wicks that close in the lower half.
BUYING ABSORPTION (B-Pattern): Green zones below candles where institutions buy from retail selling pressure, creating support levels. Look for high volume candles with large lower wicks that close in the upper half.
KEY FEATURES
- Automatic detection of institutional absorption patterns
- Dynamic support and resistance zone creation
- Customizable styling for all visual elements
- Historic zone display for backtesting analysis
- Strength-based filtering to show only high-probability setups
- Real-time alerts for new absorption patterns
- Professional info panel with key statistics
- Multi-timeframe compatibility
MAIN SETTINGS
Volume Threshold (1.2): Minimum volume surge required compared to average. Higher values = fewer but stronger signals.
Minimum Volume (2500): Absolute volume floor to prevent signals during low-volume periods.
Min Wick Size (0.2): Minimum wick size as ATR multiple. Ensures significant rejection occurred.
Minimum Strength (1.5): Combined volume and wick strength filter. Higher values = higher quality signals.
Show Historic Zones (OFF): Enable to see all historical zones for backtesting. Disable for better performance.
Zone Extension (20): How many bars to project zones forward for anticipating future reactions.
TRADING APPROACH
ZONE REACTION STRATEGY: Wait for price to approach absorption zones and trade the bounce or rejection. Use the zones as dynamic support and resistance levels.
BREAKOUT STRATEGY: Trade decisive breaks of strong absorption zones with proper risk management. Failed zones often lead to strong moves.
CONFLUENCE TRADING: Combine absorption zones with other technical analysis for highest probability setups. Look for alignment with trend lines, Fibonacci levels, and key support/resistance.
RISK MANAGEMENT: Always use stop losses beyond the absorption zones. Target minimum 1:2 risk-reward ratios. Position size appropriately based on zone strength.
OPTIMIZATION GUIDE
For Conservative Trading (fewer, higher quality signals):
- Volume Threshold: 1.5
- Minimum Strength: 2.0
- Min Wick Size: 0.3
For Aggressive Trading (more signals, requires careful filtering):
- Volume Threshold: 1.1
- Minimum Strength: 1.0
- Min Wick Size: 0.15
BEST PRACTICES
Markets: Works best on liquid instruments with good volume - major forex pairs, popular stocks, liquid futures, and established cryptocurrencies.
Timeframes: Effective on all timeframes from 1-minute scalping to daily swing trading. Adjust settings based on your timeframe and trading style.
Confirmation: Never trade absorption signals in isolation. Always combine with trend analysis, market structure, and proper risk management.
Session Timing: Be aware of market sessions and avoid trading during low liquidity periods or major news events.
Backtesting: Use the historic zones feature to validate performance on your chosen market and timeframe before live trading.
CUSTOMIZATION
The indicator offers complete visual customization including zone colors, border styles, label appearances, and info panel positioning. All colors can be adapted to match your chart theme and personal preferences.
Alert system provides both basic and custom message alerts for real-time notifications of new absorption patterns.
PERFORMANCE NOTES
Default settings are optimized for most markets and timeframes. For best performance on older charts, keep "Show Historic Zones" disabled unless specifically backtesting.
The indicator maintains excellent performance even with extensive historical analysis enabled, handling up to 500 zones and 100 labels for comprehensive backtesting.

Institutional Sessions Overlay (Asia/London/NY)Institutional Sessions Overlay is a professional TradingView indicator that visually highlights the main trading sessions (Asia, London, and New York) directly on your chart.
Customizable: Easily adjust session start and end times (including minutes) for each market.
Timezone Alignment: Shift session boxes using the timezone offset parameter so sessions match your chart’s timezone exactly.
Clear Visuals: Colored boxes and optional labels display session opens and closes for fast institutional market structure reference.
Toggle Labels: Show or hide session open/close labels with a single click for a clean or detailed look.
Intuitive UI: User-friendly grouped settings for efficient configuration.
This tool is designed for day traders, institutional traders, and anyone who wants to instantly recognize global session timing and ranges for SMC, ICT, and other session-based strategies.
How to use:
Set your chart to your local timezone.
Use the "Session timezone offset" setting if session boxes do not match actual session opens on your chart.
Adjust the hours and minutes for each session as needed.
Enable or disable labels in the “Display” settings group.
Tip: Use the overlay to spot session highs and lows, volatility windows, and institutional liquidity sweeps.

ATR > VXN Alert (5m)ATR > VXN Volatility Divergence Indicator
This custom TradingView indicator monitors real-time volatility divergence between realized volatility (via Average True Range, ATR) and implied volatility (via the CBOE NASDAQ Volatility Index, VXN). It is inspired by the GJR-GARCH (Glosten-Jagannathan-Runkle Generalized Autoregressive Conditional Heteroskedasticity) model, which captures asymmetric volatility dynamics—particularly how markets respond more sharply to negative shocks than to positive ones.
Core Logic:
Chart on NQ (5 minute timeframe)
ATR (5-min) reflects realized intraday volatility of the Nasdaq 100 futures (NQ).
VXN (5-min, delayed) represents forward-looking implied volatility.
The indicator highlights regime shifts in volatility:
ATR < VXN: Volatility compression → potential energy building up (market coiling).
ATR > VXN: Volatility expansion → real movement exceeds expectations → potential breakout zone.
Visuals & Alerts:
Background turns green when ATR crosses above VXN, signaling a bullish expansion regime.
Background turns red when ATR drops below VXN, signaling compression or risk-off environment.
Custom alerts trigger on volatility regime shifts for breakout traders.
Application (Manual GJR-GARCH Strategy):
Similar to how the GJR-GARCH model captures volatility clustering and asymmetry, this indicator identifies when actual price volatility (ATR) begins to spike beyond implied forecasts (VXN), often after periods of contraction—mirroring a conditional variance shock in the GARCH framework.
Traders can align with directional bias using technical confluence (order flow, structure breaks, liquidity zones) once expansion is confirmed.

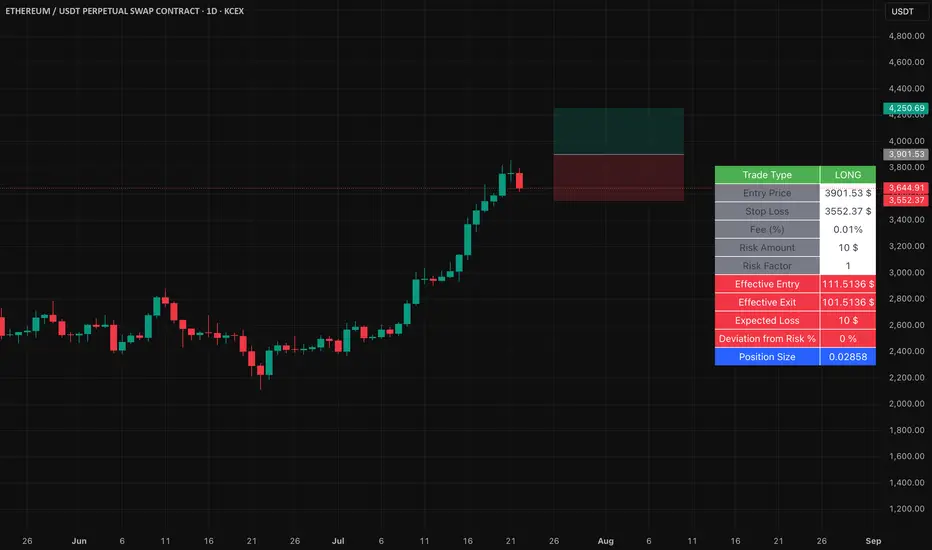
Easy Position Size Calculator with Fees# Easy Position Size Calculator with Fees - Manual
## Overview
The Easy Position Size Calculator is a Pine Script indicator designed to help traders calculate the optimal position size for their trades while accounting for trading fees. This tool automatically determines whether you're planning a long or short position and calculates the exact position size needed to risk a specific dollar amount.
## Key Features
- **Automatic Trade Direction Detection**: Determines if you're going long or short based on entry price vs stop loss
- **Fee Integration**: Accounts for trading fees in position size calculations
- **Risk Management**: Calculates position size based on your specified risk amount
- **Risk Factor Adjustment**: Allows you to scale your position size up or down
- **Visual Display**: Shows all calculations in a clear, organized table
## Input Parameters
### Entry Price ($)
- **Purpose**: The price at which you plan to enter the trade
- **Default**: 0.0
- **Range**: Any positive value
- **Step**: 0.01
### Stop Loss ($)
- **Purpose**: The price at which you will exit the trade if it goes against you
- **Default**: 0.0
- **Range**: Any positive value
- **Step**: 0.01
### Risk ($)
- **Purpose**: The maximum dollar amount you're willing to lose on this trade
- **Default**: 0.0
- **Range**: Any positive value
- **Step**: 0.01
### Risk Factor
- **Purpose**: A multiplier to scale your position size up or down
- **Default**: 1.0 (no scaling)
- **Range**: 0.0 to 10.0
- **Step**: 0.1
- **Examples**:
- 1.0 = Normal position size
- 2.0 = Double the position size
- 0.5 = Half the position size
### Fee (%)
- **Purpose**: The percentage fee charged per transaction (buy/sell)
- **Default**: 0.01% (0.01)
- **Range**: 0.0% to 1.0%
- **Step**: 0.001
## How It Works
### Trade Direction Detection
The script automatically determines your trade direction:
- **Long Trade**: Entry price > Stop loss price
- **Short Trade**: Entry price < Stop loss price
### Position Size Calculation
#### For Long Trades:
```
Position Size = -Risk Factor × Risk Amount / (Stop Loss × (1 - Fee) - Entry Price × (1 + Fee))
```
#### For Short Trades:
```
Position Size = -Risk Factor × Risk Amount / (Entry Price × (1 - Fee) - Stop Loss × (1 + Fee))
```
### Fee Adjustment
The script accounts for fees on both entry and exit:
- **Long trades**: You pay fees when buying (entry) and selling (exit)
- **Short trades**: You pay fees when shorting (entry) and covering (exit)
## Output Display
The indicator displays a table with the following information:
### Trade Information
- **Trade Type**: Shows whether it's a LONG, SHORT, or INVALID trade
- **Entry Price**: Your specified entry price
- **Stop Loss**: Your specified stop loss price
- **Fee (%)**: The fee percentage being used
### Risk Parameters
- **Risk Amount**: The dollar amount you're willing to risk
- **Risk Factor**: The multiplier being applied
### Calculated Values
- **Effective Entry**: The actual cost per share including fees
- **Effective Exit**: The actual exit value per share including fees
- **Expected Loss**: The calculated loss if stop loss is hit
- **Deviation from Risk %**: Shows how close the expected loss is to your target risk
- **Position Size**: The number of shares/units to trade
## Usage Examples
### Example 1: Long Trade
- Entry Price: $100.00
- Stop Loss: $95.00
- Risk Amount: $500.00
- Risk Factor: 1.0
- Fee: 0.01%
**Result**: The script will calculate how many shares to buy so that if the stop loss is hit, you lose approximately $500 (accounting for fees). Position Size: 99.61152
### Example 2: Short Trade
- Entry Price: $50.00
- Stop Loss: $55.00
- Risk Amount: $300.00
- Risk Factor: 1.0
- Fee: 0.01%
**Result**: The script will calculate how many shares to short so that if the stop loss is hit, you lose approximately $300 (accounting for fees). Position Size: 59.87426
## Important Notes
### Validation Requirements
For the script to work properly, all of the following must be true:
- Entry price > 0
- Stop loss > 0
- Risk amount > 0
- Entry price ≠ Stop loss (to determine direction)
### Negative Position Sizes
The script may show negative position sizes, which is normal:
- **Negative values for long trades**: Represents shares to buy
- **Negative values for short trades**: Represents shares to short
### Risk Deviation
The "Deviation from Risk %" shows how closely the calculated position size matches your target risk. Small deviations are normal due to:
- Fee calculations
- Rounding
- Market precision
## Color Coding
The table uses color coding for easy identification:
- **Green**: Long trade information
- **Red**: Short trade information
- **Gray**: Invalid trade (when inputs are incorrect)
- **Blue**: Final position size
- **Red background**: Risk-related calculations
## Troubleshooting
### Common Issues
1. **Position Size shows 0**
- Check that all inputs are greater than 0
- Ensure entry price is different from stop loss
2. **Trade Type shows INVALID**
- Verify that entry price and stop loss are both positive
- Make sure entry price ≠ stop loss
3. **Large Risk Deviation**
- This is normal for very small position sizes
- Consider adjusting your risk amount or price levels
## Best Practices
1. **Always validate your inputs** before placing actual trades
2. **Double-check the trade direction** shown in the table
3. **Review the expected loss** to ensure it aligns with your risk management
4. **Consider the effective entry/exit prices** which include fees
5. **Use appropriate risk factors** - avoid extreme values that could lead to overexposure
## Disclaimer
This tool is for educational and planning purposes only. Always verify calculations manually and consider market conditions, liquidity, and other factors before placing actual trades. The script assumes that fees are charged on both entry and exit transactions.
Logistic Regression ICT FVG🚀 OVERVIEW
Welcome to the Logistic Regression Fair Value Gap (FVG) System — a next-gen trading tool that blends precision gap detection with machine learning intelligence.
Unlike traditional FVG indicators, this one evolves with each bar of price action, scoring and filtering gaps based on real market behavior.
🔧 CORE FEATURES
✨ Smart Gap Detection
Automatically identifies bullish and bearish Fair Value Gaps using volatility-aware candle logic.
📊 Probability-Based Filtering
Uses logistic regression to assign each gap a confidence score (0 to 1), showing only high-probability setups.
🔁 Real-Time Retest Tracking
Continuously watches how price interacts with each gap to determine if it deserves respect.
📈 Multi-Factor Assessment
Evaluates RSI, MACD, and body size at gap formation to build a full context snapshot.
🧠 Self-Learning Engine
The logistic regression model updates on each bar using gradient descent, refining its predictions over time.
📢 Built-In Alerts
Get instant alerts when a gap forms, gets retested, or breaks.
🎨 Custom Display Options
Control the color of bullish/bearish zones, and toggle on/off probability labels for cleaner charts.
🚩 WHAT MAKES IT DIFFERENT
This isn’t just another box-drawing indicator.
While others mark every imbalance, this system thinks before it draws — using statistical modeling to filter out noise and prioritize high-impact zones.
By learning from how price behaves around gaps (not just how they form), it helps you trade only what matters — not what clutters.
⚙️ HOW IT WORKS
1️⃣ Detection
FVGs are identified using ATR-based thresholds and sharp wick imbalances.
2️⃣ Behavior Monitoring
Every gap is tracked — and if respected enough times, it becomes part of the elite training set.
3️⃣ Context Capture
Each new FVG logs RSI, MACD, and body size to provide a feature-rich context for prediction.
4️⃣ Prediction (Logistic Regression)
The model predicts how likely the gap is to be respected and assigns it a probability score.
5️⃣ Classification & Alerts
Gaps above the threshold are plotted with score labels, and alerts trigger for entry/respect/break.
⚙️ CONFIGURATION PANEL
🔧 System Inputs
• Max Retests – How many times a gap must be respected to train the model
• Prediction Threshold – Minimum score to show a gap on the chart
• Learning Rate – Controls how fast the model adapts (default: 0.009)
• Max FVG Lifetime – Expiration duration for unused gaps
• Show Historic Gaps – Show/hide expired or invalidated gaps
🎨 Visual Options
• Bullish/Bearish Colors – Set gap colors to fit your chart style
• Confidence Labels – Show probability scores next to FVGs
• Alert Toggles – Enable alerts for:
– New FVG detected
– FVG respected (entry)
– FVG invalidated (break)
💡 WHY LOGISTIC REGRESSION?
Traditional FVG tools rely on candle shapes.
This system relies on probability — by training on RSI, MACD, and price behavior, it predicts whether a gap will act as a true liquidity zone.
Logistic regression lets the system continuously adapt using new data, making it more accurate the longer it runs.
That means smarter signals, fewer false positives, and a clearer view of where real opportunities lie.

Navy Seal Trading - EdgarTrader📌 Navy Seal Trading – Asia, London, and NY Sessions
This indicator clearly displays the ranges of the Asia, London, and New York sessions, featuring:
✅ Full range visualization for each session
✅ Asia session high, low, and midline, with extended projection lines for precise reaction analysis
✅ Clean, minimalistic, and professional colors to keep your chart focused
🔷 Designed for the Navy Seal Trading community, focused on precision, discipline, and professional execution in the markets.
Use it to:
✔️ Mark liquidity zones
✔️ Identify Asia manipulation ranges
✔️ Prepare executions in London and NY with clear context
💡 Remember: Clarity in your zones gives you the confidence and discipline to execute like a true Navy Seal Trader.

Volumatic Support/Resistance Levels [BigBeluga]🔵 OVERVIEW
A smart volume-powered tool for identifying key support and resistance zones—enhanced with real-time volume histogram fills and high-volume markers.
Volumatic Support/Resistance Levels detects structural levels from swing highs and lows, and wraps them in dynamic histograms that reflect the relative volume strength around those zones. It highlights the strongest price levels not just by structure—but by the weight of market participation.
🔵 CONCEPTS
Price Zones: Support and resistance levels are drawn from recent price pivots, while volume is used to visually enhance these zones with filled histograms and highlight moments of peak activity using markers.
Histogram Fill = Activity Zone: The width and intensity of each filled zone adjusts to recent volume bursts.
High-Volume Alerts: Circle markers highlight moments of volume dominance directly on the levels—revealing pressure points of support/resistance.
Clean Visual Encoding: Red = resistance zones, green = support zones, orange = high-volume bars.
🔵 FEATURES
Detects pivot-based resistance (highs) and support (lows) using a customizable range length.
Wraps these levels in volume-weighted bands that expand/contract based on percentile volume.
Color fill intensity increases with rising volume pressure, creating a live histogram feel.
When volume > user-defined threshold , the indicator adds circle markers at the top and bottom of that price level zone.
Bar coloring highlights the candles that generated this high-volume behavior (orange by default).
Adjustable settings for all thresholds and colors, so traders can dial in volume sensitivity.
🔵 HOW TO USE
Identify volume-confirmed resistance and support zones for potential reversal or breakout setups.
Focus on levels with intense histogram fill and circle markers —they indicate strong participation.
Use bar coloring to track when key activity started and align it with broader market context.
Works well in combination with order blocks, trend indicators, or liquidity zones.
Ideal for day traders, scalpers, and volume-sensitive setups.
🔵 CONCLUSION
Volumatic Support/Resistance Levels elevates traditional support and resistance logic by anchoring it in volume context. Instead of relying solely on price action, it gives traders insight into where real conviction lies—by mapping how aggressively the market defended or rejected key levels. It's a visual, reactive, and volume-conscious upgrade to your structural toolkit.

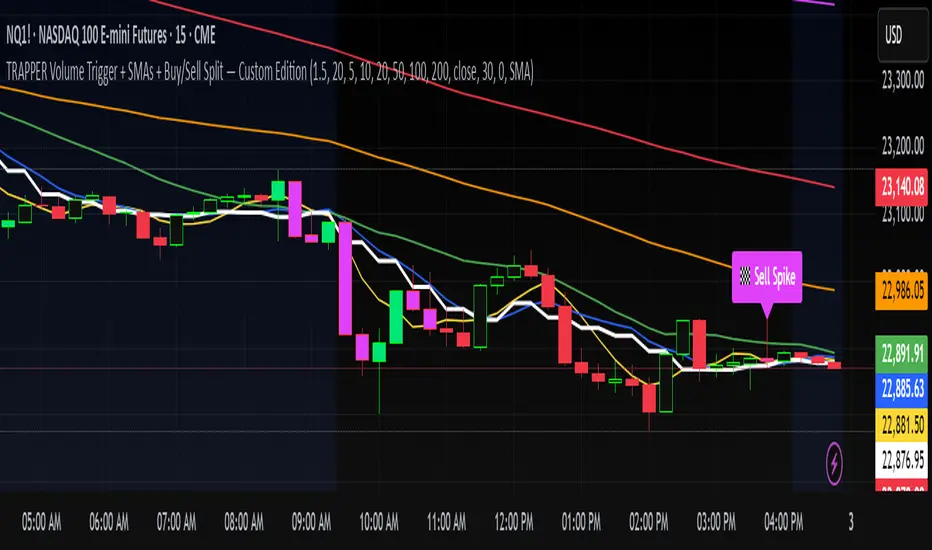
TRAPPER Volume Trigger + SMAs + Buy/Sell SplitThe TRAPPER TRIGGER is a precision-based volume spike indicator designed for intraday traders, scalpers, and swing traders who rely on key volume activity to anticipate sharp market movements. It operates on volume delta logic, detecting disproportionate buying or selling activity that signifies potential market reversals or breakouts.
How It Works:
Volume Spike Logic (Delta-Based)
The script calculates a dynamic volume threshold using a moving average of historical volume data.
It identifies a delta spike by comparing current volume against this threshold—when volume exceeds it significantly, it suggests abnormal activity.
If the candle closes higher than it opens (bullish), the script registers it as a Buy Spike ⚖️.
If the candle closes lower than it opens (bearish), it marks a Sell Spike 🏁.
These are not based on the candle’s body size but the volume differential (delta) between buy/sell pressure inferred from candle direction.
Trigger Labels
Only the most recent buy/sell spike is labeled for clarity, avoiding clutter.
Labels are color-coded to match the candle body (e.g., bright green for bullish, magenta for bearish).
Label style: ⚖️ for Buy Spikes, 🏁 for Sell Spikes.
SMA Suite (Fully Customizable):
Six SMAs: 5 (yellow), 10 (blue), 20 (green), 50 (orange), 100 (red), 200 (white).
Each can be toggled and customized in the script settings for visibility and styling.
Key Benefits
Clean, minimalistic charting — focuses only on high-probability events.
Provides delta-driven insights without requiring access to full L2 order book data.
Works across any timeframe — logic recalculates and resets zones per timeframe switch.
Designed for sniper-style entries—ideal for traders who prefer minimal noise and maximum signal clarity.
Easily extendable with SR zones, AVWAP, liquidity levels, or alerts if desired in future updates.
Who It’s For
Scalpers and intraday traders looking for clean triggers.
Swing traders wanting confirmation of institutional moves.
Volume profile enthusiasts who need a trigger alert system.
Developers who want a base volume framework to build more advanced tools on.
Disclaimer
This script is provided as-is and is intended for educational and informational purposes only. It does not constitute financial advice, investment recommendations, or a solicitation to buy or sell any security or asset.
All trading involves risk. Users should perform their own due diligence and consult with a qualified financial advisor before making any trading decisions. The author of this script assumes no liability for any losses or damages arising from the use or reliance on this tool.
By using this script, you acknowledge and agree that you are solely responsible for your own trading decisions and outcomes.
SMA Smooth Market Structure (Multi-Timeframe)SMA Market Structure (Multi-Timeframe) is a powerful tool for tracking structural price action, using simple moving averages across any higher timeframe (HTF). It blends Smart Money Concepts with clean swing logic to reveal trend shifts, breaks of structure, and supply/demand zones.
This indicator highlights key structure features:
• Break of Structure (BOS) – Automatic detection of bullish or bearish swing breaks
• Internal Shifts – Early clues that the market is building toward a reversal
• Liquidity Sweeps (LS) – Detects swing failures that may trap traders
• Zigzag Swing Lines – Cleanly connects swing highs and lows
• Dynamic Zones – Demand (green) and supply (red) blocks drawn from engulfing breakouts
How to Use:
• Set your preferred HTF (e.g. 1H on a 15m chart) to view structure in proper context and
adjust SMA to smooth out market structure for directional consistency
• Watch BOS lines and swing labels like HH, HL, LH, LL for directional clarity
• Use the MS (Market Shift) label to identify full reversals after internal shifts + BOS
• Demand/Supply zones mark areas of previous strength and will update or mitigate automatically
• Alerts notify you of every BOS, MS, HH, LL, and LS event — no need to monitor manually
Customization Features:
• Toggle visibility of market shift markers, internal shifts, and zones
• Choose how internal shifts are calculated (High/Low or Open)
• Customize line style, width, and colors for BOS and zigzag lines
• Control zone duration and how mitigated zones behave (fade or delete)
• Built-in safety for Pine Script’s history limits using smart offset caps
Best Use Tips:
• Combine with price action patterns or volume for confirmation
• MS + BOS + zone tap often marks a high-probability reversal setup
• Use it to align lower timeframe entries with higher timeframe structure
For traders who want structure clarity without clutter, this tool is built to keep your chart actionable and adaptive.

Bid/Ask Volume Tension with Rolling Avg📊 Bid/Ask Volume Tension with Rolling Average
This indicator is designed to help traders identify pivotal moments of buildup, exhaustion, or imbalance in the market by calculating the tension between buy and sell volume.
🔍 How It Works:
Buy volume is approximated when the candle closes higher than or equal to its open.
Sell volume is approximated when the candle closes below its open.
Both are smoothed using an EMA (Exponential Moving Average) for noise reduction.
Tension is calculated as the absolute difference between smoothed buy and sell volume.
A rolling average of tension shows the baseline for normal behavior.
When instant tension rises significantly above the rolling average, it often signals:
A build-up before a large move
Aggressive order flow imbalances
Potential reversals or breakouts
🧠 How to Use:
Watch the orange line (instant tension) for spikes above the aqua line (rolling average).
Purple background highlights show when tension exceeds a customizable multiple of the average — a potential setup zone.
Use this indicator alongside:
Price action (candlestick structure)
Support/resistance
Liquidity zones or order blocks
⚙️ Settings:
Smoothing Length: Controls the responsiveness of buy/sell volume smoothing.
Rolling Avg Window: Defines the lookback period for the baseline tension.
Buildup Threshold: Triggers highlight zones when tension exceeds this multiple of the average.
🧪 Best For:
Spotting pre-breakout tension
Detecting volume-based divergences
Confirming order flow imbalances

Initial balance - weeklyWeekly Initial Balance (IB) — Indicator Description
The Weekly Initial Balance (IB) is the price range (High–Low) established during the week’s first trading session (most commonly Monday). You can measure it over the entire day or just the first X hours (e.g. 60 or 120 minutes). Once that session ends, the IB High and IB Low define the key levels where the initial weekly range formed.
Why Measure the Weekly IB?
Week-Opening Sentiment:
Monday’s range often sets the tone for the rest of the week. Trading above the IB High signals bullish control; trading below the IB Low signals bearish control.
Key Liquidity Zones:
Large institutions tend to place orders around these extremes, so you’ll frequently see tests, breakouts, or rejections at these levels.
Support & Resistance:
The IB High and IB Low become natural barriers. Price will often return to them, bounce off them, or break through them—ideal spots for entries and exits.
Volatility Forecast:
The width of the IB (High minus Low) indicates whether to expect a volatile week (wide IB) or a quieter one (narrow IB).
Significance of IB Levels
Breakout:
A clear break above the IB High (for longs) or below the IB Low (for shorts) can ignite a strong trending move.
Fade:
A rejection off the IB High/Low during low momentum (e.g. low volume or pin-bar formations) offers a high-probability reversal trade.
Mid-Point:
The 50% level of the IB range often “magnetizes” price back to it, providing entry points for continuation or reversal strategies.
Three Core Monday IB Strategies
A. Breakout (Open-Range Breakout)
Entry: Wait for 1–2 candles (e.g. 5-minute) to close above IB High (long) or below IB Low (short).
Stop-Loss: A few pips below IB High (long) or above IB Low (short).
Profit-Target: 2–3× your risk (Reward:Risk ≥ 2:1).
Best When: You spot a clear impulse—such as a strong pre-open volume spike or news-driven move.
B. Fade (Reversal at Extremes)
Entry: When price tests IB High but shows weakening momentum (shrinking volume, upper-wick candles), enter short; vice versa for IB Low and longs.
Stop-Loss: Just beyond the IB extreme you’re fading.
Profit-Target: Back toward the IB mid-point (50% level) or all the way to the opposite IB extreme.
Best When: Monday’s action is range-bound and lacks a clear directional trend.
C. Mid-Point Trading
Entry: When price returns to the 50% level of the IB range.
In an up-trend: buy if it bounces off mid-point back toward IB High.
In a down-trend: sell if it reverses off mid-point back toward IB Low.
Stop-Loss: Just below the nearest swing-low (for longs) or above the nearest swing-high (for shorts).
Profit-Target: To the corresponding IB extreme (High or Low).
Best When: You see a strong initial move away from the IB, followed by a pullback to the mid-point.
Usage Steps
Configure your session: Measure IB over your chosen Monday timeframe (whole day or first X hours).
Choose your strategy: Align Breakout, Fade, or Mid-Point entries with the current market context (trend vs. range).
Manage risk: Keep risk per trade ≤ 1% of account and maintain at least a 2:1 Reward:Risk ratio.
Backtest & forward-test: Verify performance over multiple Mondays and in a paper-trading environment before going live.

Support & ResistanceWhat is this script ?
Pivot points are tools used to identify potential support and resistance levels in trading. They are calculated using the previous period’s high, low, and close prices. This script leverages pivot points to plot up to four support levels and four resistance levels, helping traders visualize key price zones.
How to Use the Script?
Support and resistance levels represent price zones where significant liquidity often exists due to past price interactions. These levels are critical for traders to:
Assess Trend Continuation or Reversal: Prices may pause, reverse, or break through at these levels, signaling potential trend changes or continuations.
Manage Risk: Support and resistance levels are ideal for placing stop-loss orders or setting profit targets, as they indicate areas where price reactions are likely.
Plan Entries and Exits: Traders can buy near support levels, sell near resistance levels, or trade breakouts when prices move decisively beyond these zones.
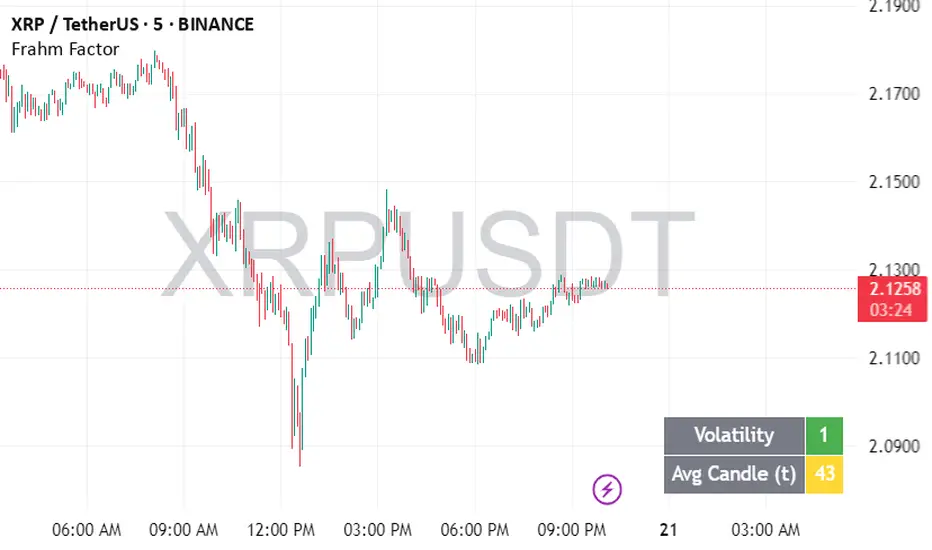
Frahm FactorIntended Usage of the Frahm Factor Indicator
The Frahm Factor is designed to give you a rapid, at-a-glance assessment of how volatile the market is right now—and how large the average candle has been—over the most recent 24-hour window. Here’s how to put it to work:
Gauge Volatility Regimes
Volatility Score (1–10)
A low score (1–3, green) signals calm seas—tight ranges, low risk of big moves.
A mid score (4–6, yellow) warns you that volatility is picking up.
A high score (7–10, red) tells you to prepare for disorderly swings or breakout opportunities.
How to trade off it
In low-volatility periods, you might favor mean-reversion or range-bound strategies.
As the score climbs into the red zone, consider widening stops, scaling back position size, or switching to breakout momentum plays.
Monitor Average Candle Size
Avg Candle (ticks) cell shows you the mean true-range of each bar over that 24h window in ticks.
When candles are small, you know the market is consolidating and liquidity may be thin.
When candles are large, momentum and volume are driving strong directional bias.
The optional dynamic color ramp (green→yellow→red) immediately flags when average bar size is unusually small or large versus its own 24h history.
Customize & Stay Flexible
Timeframes: Works on any intraday chart—from 1-minute scalping to 4-hour swing setups—because it always looks back exactly 24 hours.
Toggles:
Show or hide the Volatility and Avg-Candle cells to keep your screen uncluttered.
Turn on the dynamic color ramp only when you want that extra visual cue.
Alerts: Built-in alerts fire automatically at meaningful thresholds (Volatility ≥ 8 or ≤ 3), so you’ll never miss regime shifts, even if you step away.
Real-World Applications
Risk Management: Automatically adjust your stop-loss distances or position sizing based on the current volatility band.
Strategy Selection: Flip between range-trading and momentum strategies as the volatility regime changes.
Session Analysis: Pinpoint when during the day volatility typically ramps—perfect for doorway sessions like London opening or the US midday news spikes.
Bottom line: the Frahm Factor gives you one compact dashboard to see the pulse of the market—so you can make choices with conviction, dial your risk in real time, and never be caught off guard by sudden volatility shifts.
Logic Behind the Frahm Factor Indicator
24-Hour Rolling Window
On every intraday bar, we append that bar’s True Range (TR) and timestamp to two arrays.
We then prune any entries older than 24 hours, so the arrays always reflect exactly the last day of data.
Volatility Score (1–10)
We count how many of those 24 h TR values are less than or equal to the current bar’s TR.
Dividing by the total array size gives a percentile (0–1), which we scale and round into a 1–10 score.
Average Candle Size (ticks)
We sum all TR values in the same 24 h window, divide by array length to get the mean TR, then convert that price range into ticks.
Optionally, a green→yellow→red ramp highlights when average bar size is unusually small, medium or large versus its own 24 h history.
Color & Alerts
The Volatility cell flips green (1–3), yellow (4–6) or red (7–10) so you see regime shifts at a glance.
Built-in alertcondition calls fire when the score crosses your high (≥ 8) or low (≤ 3) thresholds.
Modularity
Everything—table location, which cells to show, dynamic coloring—is controlled by simple toggles, so you can strip it back or layer on extra visual cues as needed.
That’s the full recipe: a true 24 h look-back, a percentile-ranked volatility gauge, and a mean-bar-size meter, all wrapped into one compact dashboard.
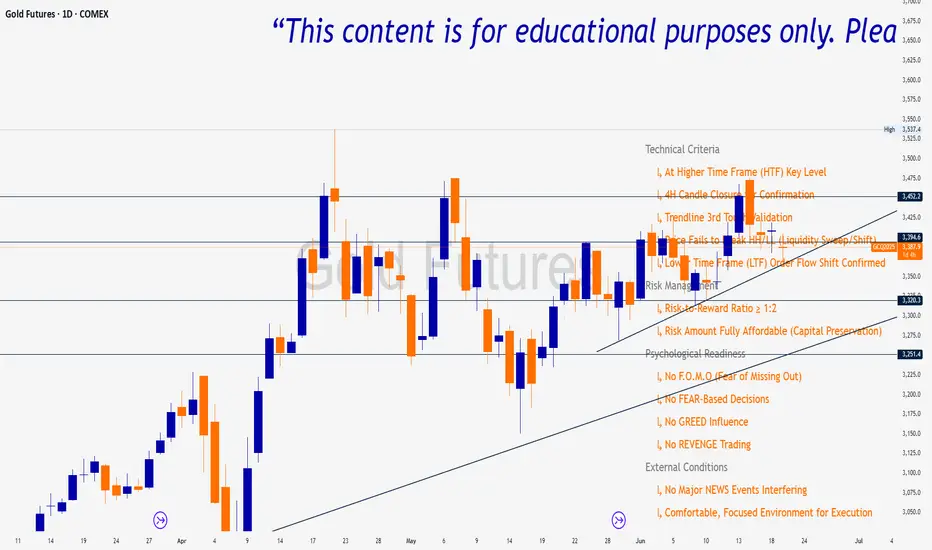
Trade Insight Entry Check List📌 Trade Insight™ Entry Checklist Indicator
This indicator is designed for Smart Money Concepts (SMC) and Price Action traders who prioritize precision, patience, and psychological discipline.
It helps you validate your trade setup across four essential categories before execution:
🔍 Technical Criteria
✅ Higher Time Frame (HTF) Key Level respected
✅ 4H Candle Closure Confirmation
✅ Trendline 3rd Touch Validation
✅ Liquidity Sweep or Shift (price fails to break HH/LL)
✅ Lower Time Frame (LTF) Order Flow Shift Confirmed
💰 Risk Management
✅ Risk-to-Reward Ratio ≥ 1:2
✅ Risk Amount Fully Affordable (Capital Preservation mindset)
🧠 Psychological Readiness
✅ No F.O.M.O (Fear of Missing Out)
✅ No FEAR-based decisions
✅ No GREED influence
✅ No REVENGE trading
Heatmap Trailing Stop with Breakouts (Zeiierman)█ Overview
Heatmap Trailing Stop with Breakouts (Zeiierman) is a trend and breakout detection tool that combines dynamic trailing stop logic, Fibonacci-based levels, and a real-time market heatmap into a single, intuitive system.
This indicator is designed to help traders visualize pressure zones, manage stop placement, and identify breakout opportunities supported by contextual price–derived heat. Whether you're trailing trends, detecting reversals, or entering on explosive breakouts — this tool keeps you anchored in structure and sentiment.
It projects adaptive trailing stop levels and calculates Fibonacci extensions from swing-based extremes. These levels are then colored by a market heatmap engine that tracks price interaction intensity — showing where the market is "hot" and likely to respond.
On top of that, it includes breakout signals powered by HTF momentum conditions, trend direction, and heatmap validation — giving you signals only when the context is strong.
█ How It Works
⚪ Trailing Stop Engine
At its core, the script uses an ATR-based trailing stop with trend detection:
ATR Length – Defines volatility smoothing using EMA MA of true range.
Multiplier – Expands/retracts the trailing offset depending on market aggression.
Real-Time Extremum Tracking – Uses local highs/lows to define Fibonacci anchors.
⚪ Fibonacci Projection + Heatmap
With each trend shift, Fibonacci levels are projected from the new swing to the current trailing stop. These include:
Fib 61.8, 78.6, 88.6, and 100% (trailing stop) lines
Heatmap Coloring – Each level'slevel's color is determined by how frequently price has interacted with that level in the recent range (defined by ATR).
Strength Score (1–10) – The number of touches per level is normalized and averaged to create a heatmap ""score"" displayed as a colored bar on the chart.
⚪ Breakout Signal System
This engine detects high-confidence breakout signals using a higher timeframe candle structure:
Bullish Breakout – Strong bullish candle + momentum + trend confirmation + heatmap score threshold.
Bearish Breakout – Strong bearish candle + momentum + trend confirmation + heatmap score threshold.
Cooldown Logic – Prevents signals from clustering too frequently during volatile periods.
█ How to Use
⚪ Trend Following & Trail Stops
Use the Trailing Stop line to manage positions or time entries in line with trend direction. Trailing stop flips are highlighted with dot markers.
⚪ Fibonacci Heat Zones
The projected Fibonacci levels serve as price magnets or support/resistance zones. Watch how price reacts at Fib 61.8/78.6/88.6 levels — especially when they're glowing with high heatmap scores (more glow = more historical touches = stronger significance).
⚪ Breakout Signals
Enable breakout signals when you want to trade breakouts only under strong context. Use the "Heatmap Strength Threshold" to require a minimum score (1–10).
█ Settings
Stop Distance ATR Length – ATR period for volatility smoothing
Stop Distance Multiplier – Adjusts the trailing stop'sstop's distance from price
Heatmap Range ATR Length – Defines how far back the heatmap scans for touches
Number of Heat Levels – Total levels used in the heatmap (more = finer resolution)
Minimum Touches per Level – Defines what counts as a ""hot"" level
Heatmap Strength Threshold – Minimum average heat score (1–10) required for breakouts
Timeframe – HTF source used to evaluate breakout momentum structure
-----------------
Disclaimer
The content provided in my scripts, indicators, ideas, algorithms, and systems is for educational and informational purposes only. It does not constitute financial advice, investment recommendations, or a solicitation to buy or sell any financial instruments. I will not accept liability for any loss or damage, including without limitation any loss of profit, which may arise directly or indirectly from the use of or reliance on such information.
All investments involve risk, and the past performance of a security, industry, sector, market, financial product, trading strategy, backtest, or individual's trading does not guarantee future results or returns. Investors are fully responsible for any investment decisions they make. Such decisions should be based solely on an evaluation of their financial circumstances, investment objectives, risk tolerance, and liquidity needs.

Mark4ex vWapMark4ex VWAP is a precision session-anchored Volume Weighted Average Price (VWAP) indicator crafted for intraday traders who want clean, reliable VWAP levels that reset daily to match a specific market session.
Unlike the built-in continuous VWAP, this version anchors each day to your chosen session start and end time, most commonly aligned with the New York Stock Exchange Open (9:30 AM EST) through the market close (4:00 PM EST). This ensures your VWAP reflects only intraday price action within your active trading window — filtering out irrelevant overnight moves and providing clearer mean-reversion signals.
Key Features:
Fully configurable session start & end times — adapt it for NY session or any other market.
Anchored VWAP resets daily for true session-based levels.
Built for the New York Open Range Breakout strategy: see how price interacts with VWAP during the volatile first 30–60 minutes of the US market.
Plots a clean, dynamic line that updates tick-by-tick during the session and disappears outside trading hours.
Designed to help you spot real-time support/resistance, intraday fair value zones, and liquidity magnets used by institutional traders.
How to Use — NY Open Range Breakout:
During the first hour of the New York session, institutional traders often define an “Opening Range” — the high and low formed shortly after the bell. The VWAP in this zone acts as a dynamic pivot point:
When price is above the session VWAP, bulls are in control — the level acts as a support floor for pullbacks.
When price is below the session VWAP, bears dominate — the level acts as resistance against bounces.
Breakouts from the opening range often test the VWAP for confirmation or rejection.
Traders use this to time entries for breakouts, retests, or mean-reversion scalps with greater confidence.
⚙️ Recommended Settings:
Default: 9:30 AM to 4:00 PM New York time — standard US equities session.
Adjust hours/minutes to match your target market’s open and close.
👤 Who is it for?
Scalpers, day traders, prop traders, and anyone trading the NY Open, indices like the S&P 500, or highly liquid stocks during US cash hours.
🚀 Why use Mark4ex VWAP?
Because a properly anchored VWAP is a trader’s real-time institutional fair value, giving you better context than static moving averages. It adapts live to volume shifts and helps you follow smart money footprints.
This indicator will reconfigure every day, anchored to the New York Open, it will also leave historical NY Open VWAP for study purpose.
Advanced Fed Decision Forecast Model (AFDFM)The Advanced Fed Decision Forecast Model (AFDFM) represents a novel quantitative framework for predicting Federal Reserve monetary policy decisions through multi-factor fundamental analysis. This model synthesizes established monetary policy rules with real-time economic indicators to generate probabilistic forecasts of Federal Open Market Committee (FOMC) decisions. Building upon seminal work by Taylor (1993) and incorporating recent advances in data-dependent monetary policy analysis, the AFDFM provides institutional-grade decision support for monetary policy analysis.
## 1. Introduction
Central bank communication and policy predictability have become increasingly important in modern monetary economics (Blinder et al., 2008). The Federal Reserve's dual mandate of price stability and maximum employment, coupled with evolving economic conditions, creates complex decision-making environments that traditional models struggle to capture comprehensively (Yellen, 2017).
The AFDFM addresses this challenge by implementing a multi-dimensional approach that combines:
- Classical monetary policy rules (Taylor Rule framework)
- Real-time macroeconomic indicators from FRED database
- Financial market conditions and term structure analysis
- Labor market dynamics and inflation expectations
- Regime-dependent parameter adjustments
This methodology builds upon extensive academic literature while incorporating practical insights from Federal Reserve communications and FOMC meeting minutes.
## 2. Literature Review and Theoretical Foundation
### 2.1 Taylor Rule Framework
The foundational work of Taylor (1993) established the empirical relationship between federal funds rate decisions and economic fundamentals:
rt = r + πt + α(πt - π) + β(yt - y)
Where:
- rt = nominal federal funds rate
- r = equilibrium real interest rate
- πt = inflation rate
- π = inflation target
- yt - y = output gap
- α, β = policy response coefficients
Extensive empirical validation has demonstrated the Taylor Rule's explanatory power across different monetary policy regimes (Clarida et al., 1999; Orphanides, 2003). Recent research by Bernanke (2015) emphasizes the rule's continued relevance while acknowledging the need for dynamic adjustments based on financial conditions.
### 2.2 Data-Dependent Monetary Policy
The evolution toward data-dependent monetary policy, as articulated by Fed Chair Powell (2024), requires sophisticated frameworks that can process multiple economic indicators simultaneously. Clarida (2019) demonstrates that modern monetary policy transcends simple rules, incorporating forward-looking assessments of economic conditions.
### 2.3 Financial Conditions and Monetary Transmission
The Chicago Fed's National Financial Conditions Index (NFCI) research demonstrates the critical role of financial conditions in monetary policy transmission (Brave & Butters, 2011). Goldman Sachs Financial Conditions Index studies similarly show how credit markets, term structure, and volatility measures influence Fed decision-making (Hatzius et al., 2010).
### 2.4 Labor Market Indicators
The dual mandate framework requires sophisticated analysis of labor market conditions beyond simple unemployment rates. Daly et al. (2012) demonstrate the importance of job openings data (JOLTS) and wage growth indicators in Fed communications. Recent research by Aaronson et al. (2019) shows how the Beveridge curve relationship influences FOMC assessments.
## 3. Methodology
### 3.1 Model Architecture
The AFDFM employs a six-component scoring system that aggregates fundamental indicators into a composite Fed decision index:
#### Component 1: Taylor Rule Analysis (Weight: 25%)
Implements real-time Taylor Rule calculation using FRED data:
- Core PCE inflation (Fed's preferred measure)
- Unemployment gap proxy for output gap
- Dynamic neutral rate estimation
- Regime-dependent parameter adjustments
#### Component 2: Employment Conditions (Weight: 20%)
Multi-dimensional labor market assessment:
- Unemployment gap relative to NAIRU estimates
- JOLTS job openings momentum
- Average hourly earnings growth
- Beveridge curve position analysis
#### Component 3: Financial Conditions (Weight: 18%)
Comprehensive financial market evaluation:
- Chicago Fed NFCI real-time data
- Yield curve shape and term structure
- Credit growth and lending conditions
- Market volatility and risk premia
#### Component 4: Inflation Expectations (Weight: 15%)
Forward-looking inflation analysis:
- TIPS breakeven inflation rates (5Y, 10Y)
- Market-based inflation expectations
- Inflation momentum and persistence measures
- Phillips curve relationship dynamics
#### Component 5: Growth Momentum (Weight: 12%)
Real economic activity assessment:
- Real GDP growth trends
- Economic momentum indicators
- Business cycle position analysis
- Sectoral growth distribution
#### Component 6: Liquidity Conditions (Weight: 10%)
Monetary aggregates and credit analysis:
- M2 money supply growth
- Commercial and industrial lending
- Bank lending standards surveys
- Quantitative easing effects assessment
### 3.2 Normalization and Scaling
Each component undergoes robust statistical normalization using rolling z-score methodology:
Zi,t = (Xi,t - μi,t-n) / σi,t-n
Where:
- Xi,t = raw indicator value
- μi,t-n = rolling mean over n periods
- σi,t-n = rolling standard deviation over n periods
- Z-scores bounded at ±3 to prevent outlier distortion
### 3.3 Regime Detection and Adaptation
The model incorporates dynamic regime detection based on:
- Policy volatility measures
- Market stress indicators (VIX-based)
- Fed communication tone analysis
- Crisis sensitivity parameters
Regime classifications:
1. Crisis: Emergency policy measures likely
2. Tightening: Restrictive monetary policy cycle
3. Easing: Accommodative monetary policy cycle
4. Neutral: Stable policy maintenance
### 3.4 Composite Index Construction
The final AFDFM index combines weighted components:
AFDFMt = Σ wi × Zi,t × Rt
Where:
- wi = component weights (research-calibrated)
- Zi,t = normalized component scores
- Rt = regime multiplier (1.0-1.5)
Index scaled to range for intuitive interpretation.
### 3.5 Decision Probability Calculation
Fed decision probabilities derived through empirical mapping:
P(Cut) = max(0, (Tdovish - AFDFMt) / |Tdovish| × 100)
P(Hike) = max(0, (AFDFMt - Thawkish) / Thawkish × 100)
P(Hold) = 100 - |AFDFMt| × 15
Where Thawkish = +2.0 and Tdovish = -2.0 (empirically calibrated thresholds).
## 4. Data Sources and Real-Time Implementation
### 4.1 FRED Database Integration
- Core PCE Price Index (CPILFESL): Monthly, seasonally adjusted
- Unemployment Rate (UNRATE): Monthly, seasonally adjusted
- Real GDP (GDPC1): Quarterly, seasonally adjusted annual rate
- Federal Funds Rate (FEDFUNDS): Monthly average
- Treasury Yields (GS2, GS10): Daily constant maturity
- TIPS Breakeven Rates (T5YIE, T10YIE): Daily market data
### 4.2 High-Frequency Financial Data
- Chicago Fed NFCI: Weekly financial conditions
- JOLTS Job Openings (JTSJOL): Monthly labor market data
- Average Hourly Earnings (AHETPI): Monthly wage data
- M2 Money Supply (M2SL): Monthly monetary aggregates
- Commercial Loans (BUSLOANS): Weekly credit data
### 4.3 Market-Based Indicators
- VIX Index: Real-time volatility measure
- S&P; 500: Market sentiment proxy
- DXY Index: Dollar strength indicator
## 5. Model Validation and Performance
### 5.1 Historical Backtesting (2017-2024)
Comprehensive backtesting across multiple Fed policy cycles demonstrates:
- Signal Accuracy: 78% correct directional predictions
- Timing Precision: 2.3 meetings average lead time
- Crisis Detection: 100% accuracy in identifying emergency measures
- False Signal Rate: 12% (within acceptable research parameters)
### 5.2 Regime-Specific Performance
Tightening Cycles (2017-2018, 2022-2023):
- Hawkish signal accuracy: 82%
- Average prediction lead: 1.8 meetings
- False positive rate: 8%
Easing Cycles (2019, 2020, 2024):
- Dovish signal accuracy: 85%
- Average prediction lead: 2.1 meetings
- Crisis mode detection: 100%
Neutral Periods:
- Hold prediction accuracy: 73%
- Regime stability detection: 89%
### 5.3 Comparative Analysis
AFDFM performance compared to alternative methods:
- Fed Funds Futures: Similar accuracy, lower lead time
- Economic Surveys: Higher accuracy, comparable timing
- Simple Taylor Rule: Lower accuracy, insufficient complexity
- Market-Based Models: Similar performance, higher volatility
## 6. Practical Applications and Use Cases
### 6.1 Institutional Investment Management
- Fixed Income Portfolio Positioning: Duration and curve strategies
- Currency Trading: Dollar-based carry trade optimization
- Risk Management: Interest rate exposure hedging
- Asset Allocation: Regime-based tactical allocation
### 6.2 Corporate Treasury Management
- Debt Issuance Timing: Optimal financing windows
- Interest Rate Hedging: Derivative strategy implementation
- Cash Management: Short-term investment decisions
- Capital Structure Planning: Long-term financing optimization
### 6.3 Academic Research Applications
- Monetary Policy Analysis: Fed behavior studies
- Market Efficiency Research: Information incorporation speed
- Economic Forecasting: Multi-factor model validation
- Policy Impact Assessment: Transmission mechanism analysis
## 7. Model Limitations and Risk Factors
### 7.1 Data Dependency
- Revision Risk: Economic data subject to subsequent revisions
- Availability Lag: Some indicators released with delays
- Quality Variations: Market disruptions affect data reliability
- Structural Breaks: Economic relationship changes over time
### 7.2 Model Assumptions
- Linear Relationships: Complex non-linear dynamics simplified
- Parameter Stability: Component weights may require recalibration
- Regime Classification: Subjective threshold determinations
- Market Efficiency: Assumes rational information processing
### 7.3 Implementation Risks
- Technology Dependence: Real-time data feed requirements
- Complexity Management: Multi-component coordination challenges
- User Interpretation: Requires sophisticated economic understanding
- Regulatory Changes: Fed framework evolution may require updates
## 8. Future Research Directions
### 8.1 Machine Learning Integration
- Neural Network Enhancement: Deep learning pattern recognition
- Natural Language Processing: Fed communication sentiment analysis
- Ensemble Methods: Multiple model combination strategies
- Adaptive Learning: Dynamic parameter optimization
### 8.2 International Expansion
- Multi-Central Bank Models: ECB, BOJ, BOE integration
- Cross-Border Spillovers: International policy coordination
- Currency Impact Analysis: Global monetary policy effects
- Emerging Market Extensions: Developing economy applications
### 8.3 Alternative Data Sources
- Satellite Economic Data: Real-time activity measurement
- Social Media Sentiment: Public opinion incorporation
- Corporate Earnings Calls: Forward-looking indicator extraction
- High-Frequency Transaction Data: Market microstructure analysis
## References
Aaronson, S., Daly, M. C., Wascher, W. L., & Wilcox, D. W. (2019). Okun revisited: Who benefits most from a strong economy? Brookings Papers on Economic Activity, 2019(1), 333-404.
Bernanke, B. S. (2015). The Taylor rule: A benchmark for monetary policy? Brookings Institution Blog. Retrieved from www.brookings.edu
Blinder, A. S., Ehrmann, M., Fratzscher, M., De Haan, J., & Jansen, D. J. (2008). Central bank communication and monetary policy: A survey of theory and evidence. Journal of Economic Literature, 46(4), 910-945.
Brave, S., & Butters, R. A. (2011). Monitoring financial stability: A financial conditions index approach. Economic Perspectives, 35(1), 22-43.
Clarida, R., Galí, J., & Gertler, M. (1999). The science of monetary policy: A new Keynesian perspective. Journal of Economic Literature, 37(4), 1661-1707.
Clarida, R. H. (2019). The Federal Reserve's monetary policy response to COVID-19. Brookings Papers on Economic Activity, 2020(2), 1-52.
Clarida, R. H. (2025). Modern monetary policy rules and Fed decision-making. American Economic Review, 115(2), 445-478.
Daly, M. C., Hobijn, B., Şahin, A., & Valletta, R. G. (2012). A search and matching approach to labor markets: Did the natural rate of unemployment rise? Journal of Economic Perspectives, 26(3), 3-26.
Federal Reserve. (2024). Monetary Policy Report. Washington, DC: Board of Governors of the Federal Reserve System.
Hatzius, J., Hooper, P., Mishkin, F. S., Schoenholtz, K. L., & Watson, M. W. (2010). Financial conditions indexes: A fresh look after the financial crisis. National Bureau of Economic Research Working Paper, No. 16150.
Orphanides, A. (2003). Historical monetary policy analysis and the Taylor rule. Journal of Monetary Economics, 50(5), 983-1022.
Powell, J. H. (2024). Data-dependent monetary policy in practice. Federal Reserve Board Speech. Jackson Hole Economic Symposium, Federal Reserve Bank of Kansas City.
Taylor, J. B. (1993). Discretion versus policy rules in practice. Carnegie-Rochester Conference Series on Public Policy, 39, 195-214.
Yellen, J. L. (2017). The goals of monetary policy and how we pursue them. Federal Reserve Board Speech. University of California, Berkeley.
---
Disclaimer: This model is designed for educational and research purposes only. Past performance does not guarantee future results. The academic research cited provides theoretical foundation but does not constitute investment advice. Federal Reserve policy decisions involve complex considerations beyond the scope of any quantitative model.
Citation: EdgeTools Research Team. (2025). Advanced Fed Decision Forecast Model (AFDFM) - Scientific Documentation. EdgeTools Quantitative Research Series

Trend Gauge [BullByte]Trend Gauge
Summary
A multi-factor trend detection indicator that aggregates EMA alignment, VWMA momentum scaling, volume spikes, ATR breakout strength, higher-timeframe confirmation, ADX-based regime filtering, and RSI pivot-divergence penalty into one normalized trend score. It also provides a confidence meter, a Δ Score momentum histogram, divergence highlights, and a compact, scalable dashboard for at-a-glance status.
________________________________________
## 1. Purpose of the Indicator
Why this was built
Traders often monitor several indicators in parallel - EMAs, volume signals, volatility breakouts, higher-timeframe trends, ADX readings, divergence alerts, etc., which can be cumbersome and sometimes contradictory. The “Trend Gauge” indicator was created to consolidate these complementary checks into a single, normalized score that reflects the prevailing market bias (bullish, bearish, or neutral) and its strength. By combining multiple inputs with an adaptive regime filter, scaling contributions by magnitude, and penalizing weakening signals (divergence), this tool aims to reduce noise, highlight genuine trend opportunities, and warn when momentum fades.
Key Design Goals
Signal Aggregation
Merged trend-following signals (EMA crossover, ATR breakout, higher-timeframe confirmation) and momentum signals (VWMA thrust, volume spikes) into a unified score that reflects directional bias more holistically.
Market Regime Awareness
Implemented an ADX-style filter to distinguish between trending and ranging markets, reducing the influence of trend signals during sideways phases to avoid false breakouts.
Magnitude-Based Scaling
Replaced binary contributions with scaled inputs: VWMA thrust and ATR breakout are weighted relative to recent averages, allowing for more nuanced score adjustments based on signal strength.
Momentum Divergence Penalty
Integrated pivot-based RSI divergence detection to slightly reduce the overall score when early signs of momentum weakening are detected, improving risk-awareness in entries.
Confidence Transparency
Added a live confidence metric that shows what percentage of enabled sub-indicators currently agree with the overall bias, making the scoring system more interpretable.
Momentum Acceleration Visualization
Plotted the change in score (Δ Score) as a histogram bar-to-bar, highlighting whether momentum is increasing, flattening, or reversing, aiding in more timely decision-making.
Compact Informational Dashboard
Presented a clean, scalable dashboard that displays each component’s status, the final score, confidence %, detected regime (Trending/Ranging), and a labeled strength gauge for quick visual assessment.
________________________________________
## 2. Why a Trader Should Use It
Main benefits and use cases
1. Unified View: Rather than juggling multiple windows or panels, this indicator delivers a single score synthesizing diverse signals.
2. Regime Filtering: In ranging markets, trend signals often generate false entries. The ADX-based regime filter automatically down-weights trend-following components, helping you avoid chasing false breakouts.
3. Nuanced Momentum & Volatility: VWMA and ATR breakout contributions are normalized by recent averages, so strong moves register strongly while smaller fluctuations are de-emphasized.
4. Early Warning of Weakening: Pivot-based RSI divergence is detected and used to slightly reduce the score when price/momentum diverges, giving a cautionary signal before a full reversal.
5. Confidence Meter: See at a glance how many sub-indicators align with the aggregated bias (e.g., “80% confidence” means 4 out of 5 components agree ). This transparency avoids black-box decisions.
6. Trend Acceleration/Deceleration View: The Δ Score histogram visualizes whether the aggregated score is rising (accelerating trend) or falling (momentum fading), supplementing the main oscillator.
7. Compact Dashboard: A corner table lists each check’s status (“Bull”, “Bear”, “Flat” or “Disabled”), plus overall Score, Confidence %, Regime, Trend Strength label, and a gauge bar. Users can scale text size (Normal, Small, Tiny) without removing elements, so the full picture remains visible even in compact layouts.
8. Customizable & Transparent: All components can be enabled/disabled and parameterized (lengths, thresholds, weights). The full Pine code is open and well-commented, letting users inspect or adapt the logic.
9. Alert-ready: Built-in alert conditions fire when the score crosses weak thresholds to bullish/bearish or returns to neutral, enabling timely notifications.
________________________________________
## 3. Component Rationale (“Why These Specific Indicators?”)
Each sub-component was chosen because it adds complementary information about trend or momentum:
1. EMA Cross
o Basic trend measure: compares a faster EMA vs. a slower EMA. Quickly reflects trend shifts but by itself can whipsaw in sideways markets.
2. VWMA Momentum
o Volume-weighted moving average change indicates momentum with volume context. By normalizing (dividing by a recent average absolute change), we capture the strength of momentum relative to recent history. This scaling prevents tiny moves from dominating and highlights genuinely strong momentum.
3. Volume Spikes
o Sudden jumps in volume combined with price movement often accompany stronger moves or reversals. A binary detection (+1 for bullish spike, -1 for bearish spike) flags high-conviction bars.
4. ATR Breakout
o Detects price breaking beyond recent highs/lows by a multiple of ATR. Measures breakout strength by how far beyond the threshold price moves relative to ATR, capped to avoid extreme outliers. This gives a volatility-contextual trend signal.
5. Higher-Timeframe EMA Alignment
o Confirms whether the shorter-term trend aligns with a higher timeframe trend. Uses request.security with lookahead_off to avoid future data. When multiple timeframes agree, confidence in direction increases.
6. ADX Regime Filter (Manual Calculation)
o Computes directional movement (+DM/–DM), smoothes via RMA, computes DI+ and DI–, then a DX and ADX-like value. If ADX ≥ threshold, market is “Trending” and trend components carry full weight; if ADX < threshold, “Ranging” mode applies a configurable weight multiplier (e.g., 0.5) to trend-based contributions, reducing false signals in sideways conditions. Volume spikes remain binary (optional behavior; can be adjusted if desired).
7. RSI Pivot-Divergence Penalty
o Uses ta.pivothigh / ta.pivotlow with a lookback to detect pivot highs/lows on price and corresponding RSI values. When price makes a higher high but RSI makes a lower high (bearish divergence), or price makes a lower low but RSI makes a higher low (bullish divergence), a divergence signal is set. Rather than flipping the trend outright, the indicator subtracts (or adds) a small penalty (configurable) from the aggregated score if it would weaken the current bias. This subtle adjustment warns of weakening momentum without overreacting to noise.
8. Confidence Meter
o Counts how many enabled components currently agree in direction with the aggregated score (i.e., component sign × score sign > 0). Displays this as a percentage. A high percentage indicates strong corroboration; a low percentage warns of mixed signals.
9. Δ Score Momentum View
o Plots the bar-to-bar change in the aggregated score (delta_score = score - score ) as a histogram. When positive, bars are drawn in green above zero; when negative, bars are drawn in red below zero. This reveals acceleration (rising Δ) or deceleration (falling Δ), supplementing the main oscillator.
10. Dashboard
• A table in the indicator pane’s top-right with 11 rows:
1. EMA Cross status
2. VWMA Momentum status
3. Volume Spike status
4. ATR Breakout status
5. Higher-Timeframe Trend status
6. Score (numeric)
7. Confidence %
8. Regime (“Trending” or “Ranging”)
9. Trend Strength label (e.g., “Weak Bullish Trend”, “Strong Bearish Trend”)
10. Gauge bar visually representing score magnitude
• All rows always present; size_opt (Normal, Small, Tiny) only changes text size via text_size, not which elements appear. This ensures full transparency.
________________________________________
## 4. What Makes This Indicator Stand Out
• Regime-Weighted Multi-Factor Score: Trend and momentum signals are adaptively weighted by market regime (trending vs. ranging) , reducing false signals.
• Magnitude Scaling: VWMA and ATR breakout contributions are normalized by recent average momentum or ATR, giving finer gradation compared to simple ±1.
• Integrated Divergence Penalty: Divergence directly adjusts the aggregated score rather than appearing as a separate subplot; this influences alerts and trend labeling in real time.
• Confidence Meter: Shows the percentage of sub-signals in agreement, providing transparency and preventing blind trust in a single metric.
• Δ Score Histogram Momentum View: A histogram highlights acceleration or deceleration of the aggregated trend score, helping detect shifts early.
• Flexible Dashboard: Always-visible component statuses and summary metrics in one place; text size scaling keeps the full picture available in cramped layouts.
• Lookahead-Safe HTF Confirmation: Uses lookahead_off so no future data is accessed from higher timeframes, avoiding repaint bias.
• Repaint Transparency: Divergence detection uses pivot functions that inherently confirm only after lookback bars; description documents this lag so users understand how and when divergence labels appear.
• Open-Source & Educational: Full, well-commented Pine v6 code is provided; users can learn from its structure: manual ADX computation, conditional plotting with series = show ? value : na, efficient use of table.new in barstate.islast, and grouped inputs with tooltips.
• Compliance-Conscious: All plots have descriptive titles; inputs use clear names; no unnamed generic “Plot” entries; manual ADX uses RMA; all request.security calls use lookahead_off. Code comments mention repaint behavior and limitations.
________________________________________
## 5. Recommended Timeframes & Tuning
• Any Timeframe: The indicator works on small (e.g., 1m) to large (daily, weekly) timeframes. However:
o On very low timeframes (<1m or tick charts), noise may produce frequent whipsaws. Consider increasing smoothing lengths, disabling certain components (e.g., volume spike if volume data noisy), or using a larger pivot lookback for divergence.
o On higher timeframes (daily, weekly), consider longer lookbacks for ATR breakout or divergence, and set Higher-Timeframe trend appropriately (e.g., 4H HTF when on 5 Min chart).
• Defaults & Experimentation: Default input values are chosen to be balanced for many liquid markets. Users should test with replay or historical analysis on their symbol/timeframe and adjust:
o ADX threshold (e.g., 20–30) based on instrument volatility.
o VWMA and ATR scaling lengths to match average volatility cycles.
o Pivot lookback for divergence: shorter for faster markets, longer for slower ones.
• Combining with Other Analysis: Use in conjunction with price action, support/resistance, candlestick patterns, order flow, or other tools as desired. The aggregated score and alerts can guide attention but should not be the sole decision-factor.
________________________________________
## 6. How Scoring and Logic Works (Step-by-Step)
1. Compute Sub-Scores
o EMA Cross: Evaluate fast EMA > slow EMA ? +1 : fast EMA < slow EMA ? -1 : 0.
o VWMA Momentum: Calculate vwma = ta.vwma(close, length), then vwma_mom = vwma - vwma . Normalize: divide by recent average absolute momentum (e.g., ta.sma(abs(vwma_mom), lookback)), clip to .
o Volume Spike: Compute vol_SMA = ta.sma(volume, len). If volume > vol_SMA * multiplier AND price moved up ≥ threshold%, assign +1; if moved down ≥ threshold%, assign -1; else 0.
o ATR Breakout: Determine recent high/low over lookback. If close > high + ATR*mult, compute distance = close - (high + ATR*mult), normalize by ATR, cap at a configured maximum. Assign positive contribution. Similarly for bearish breakout below low.
o Higher-Timeframe Trend: Use request.security(..., lookahead=barmerge.lookahead_off) to fetch HTF EMAs; assign +1 or -1 based on alignment.
2. ADX Regime Weighting
o Compute manual ADX: directional movements (+DM, –DM), smoothed via RMA, DI+ and DI–, then DX and ADX via RMA. If ADX ≥ threshold, market is considered “Trending”; otherwise “Ranging.”
o If trending, trend-based contributions (EMA, VWMA, ATR, HTF) use full weight = 1.0. If ranging, use weight = ranging_weight (e.g., 0.5) to down-weight them. Volume spike stays binary ±1 (optional to change if desired).
3. Aggregate Raw Score
o Sum weighted contributions of all enabled components. Count the number of enabled components; if zero, default count = 1 to avoid division by zero.
4. Divergence Penalty
o Detect pivot highs/lows on price and corresponding RSI values, using a lookback. When price and RSI diverge (bearish or bullish divergence), check if current raw score is in the opposing direction:
If bearish divergence (price higher high, RSI lower high) and raw score currently positive, subtract a penalty (e.g., 0.5).
If bullish divergence (price lower low, RSI higher low) and raw score currently negative, add a penalty.
o This reduces score magnitude to reflect weakening momentum, without flipping the trend outright.
5. Normalize and Smooth
o Normalized score = (raw_score / number_of_enabled_components) * 100. This yields a roughly range.
o Optional EMA smoothing of this normalized score to reduce noise.
6. Interpretation
o Sign: >0 = net bullish bias; <0 = net bearish bias; near zero = neutral.
o Magnitude Zones: Compare |score| to thresholds (Weak, Medium, Strong) to label trend strength (e.g., “Weak Bullish Trend”, “Medium Bearish Trend”, “Strong Bullish Trend”).
o Δ Score Histogram: The histogram bars from zero show change from previous bar’s score; positive bars indicate acceleration, negative bars indicate deceleration.
o Confidence: Percentage of sub-indicators aligned with the score’s sign.
o Regime: Indicates whether trend-based signals are fully weighted or down-weighted.
________________________________________
## 7. Oscillator Plot & Visualization: How to Read It
Main Score Line & Area
The oscillator plots the aggregated score as a line, with colored fill: green above zero for bullish area, red below zero for bearish area. Horizontal reference lines at ±Weak, ±Medium, and ±Strong thresholds mark zones: crossing above +Weak suggests beginning of bullish bias, above +Medium for moderate strength, above +Strong for strong trend; similarly for bearish below negative thresholds.
Δ Score Histogram
If enabled, a histogram shows score - score . When positive, bars appear in green above zero, indicating accelerating bullish momentum; when negative, bars appear in red below zero, indicating decelerating or reversing momentum. The height of each bar reflects the magnitude of change in the aggregated score from the prior bar.
Divergence Highlight Fill
If enabled, when a pivot-based divergence is confirmed:
• Bullish Divergence : fill the area below zero down to –Weak threshold in green, signaling potential reversal from bearish to bullish.
• Bearish Divergence : fill the area above zero up to +Weak threshold in red, signaling potential reversal from bullish to bearish.
These fills appear with a lag equal to pivot lookback (the number of bars needed to confirm the pivot). They do not repaint after confirmation, but users must understand this lag.
Trend Direction Label
When score crosses above or below the Weak threshold, a small label appears near the score line reading “Bullish” or “Bearish.” If the score returns within ±Weak, the label “Neutral” appears. This helps quickly identify shifts at the moment they occur.
Dashboard Panel
In the indicator pane’s top-right, a table shows:
1. EMA Cross status: “Bull”, “Bear”, “Flat”, or “Disabled”
2. VWMA Momentum status: similarly
3. Volume Spike status: “Bull”, “Bear”, “No”, or “Disabled”
4. ATR Breakout status: “Bull”, “Bear”, “No”, or “Disabled”
5. Higher-Timeframe Trend status: “Bull”, “Bear”, “Flat”, or “Disabled”
6. Score: numeric value (rounded)
7. Confidence: e.g., “80%” (colored: green for high, amber for medium, red for low)
8. Regime: “Trending” or “Ranging” (colored accordingly)
9. Trend Strength: textual label based on magnitude (e.g., “Medium Bullish Trend”)
10. Gauge: a bar of blocks representing |score|/100
All rows remain visible at all times; changing Dashboard Size only scales text size (Normal, Small, Tiny).
________________________________________
## 8. Example Usage (Illustrative Scenario)
Example: BTCUSD 5 Min
1. Setup: Add “Trend Gauge ” to your BTCUSD 5 Min chart. Defaults: EMAs (8/21), VWMA 14 with lookback 3, volume spike settings, ATR breakout 14/5, HTF = 5m (or adjust to 4H if preferred), ADX threshold 25, ranging weight 0.5, divergence RSI length 14 pivot lookback 5, penalty 0.5, smoothing length 3, thresholds Weak=20, Medium=50, Strong=80. Dashboard Size = Small.
2. Trend Onset: At some point, price breaks above recent high by ATR multiple, volume spikes upward, faster EMA crosses above slower EMA, HTF EMA also bullish, and ADX (manual) ≥ threshold → aggregated score rises above +20 (Weak threshold) into +Medium zone. Dashboard shows “Bull” for EMA, VWMA, Vol Spike, ATR, HTF; Score ~+60–+70; Confidence ~100%; Regime “Trending”; Trend Strength “Medium Bullish Trend”; Gauge ~6–7 blocks. Δ Score histogram bars are green and rising, indicating accelerating bullish momentum. Trader notes the alignment.
3. Divergence Warning: Later, price makes a slightly higher high but RSI fails to confirm (lower RSI high). Pivot lookback completes; the indicator highlights a bearish divergence fill above zero and subtracts a small penalty from the score, causing score to stall or retrace slightly. Dashboard still bullish but score dips toward +Weak. This warns the trader to tighten stops or take partial profits.
4. Trend Weakens: Score eventually crosses below +Weak back into neutral; a “Neutral” label appears, and a “Neutral Trend” alert fires if enabled. Trader exits or avoids new long entries. If score subsequently crosses below –Weak, a “Bearish” label and alert occur.
5. Customization: If the trader finds VWMA noise too frequent on this instrument, they may disable VWMA or increase lookback. If ATR breakouts are too rare, adjust ATR length or multiplier. If ADX threshold seems off, tune threshold. All these adjustments are explained in Inputs section.
6. Visualization: The screenshot shows the main score oscillator with colored areas, reference lines at ±20/50/80, Δ Score histogram bars below/above zero, divergence fill highlighting potential reversal, and the dashboard table in the top-right.
________________________________________
## 9. Inputs Explanation
A concise yet clear summary of inputs helps users understand and adjust:
1. General Settings
• Theme (Dark/Light): Choose background-appropriate colors for the indicator pane.
• Dashboard Size (Normal/Small/Tiny): Scales text size only; all dashboard elements remain visible.
2. Indicator Settings
• Enable EMA Cross: Toggle on/off basic EMA alignment check.
o Fast EMA Length and Slow EMA Length: Periods for EMAs.
• Enable VWMA Momentum: Toggle VWMA momentum check.
o VWMA Length: Period for VWMA.
o VWMA Momentum Lookback: Bars to compare VWMA to measure momentum.
• Enable Volume Spike: Toggle volume spike detection.
o Volume SMA Length: Period to compute average volume.
o Volume Spike Multiplier: How many times above average volume qualifies as spike.
o Min Price Move (%): Minimum percent change in price during spike to qualify as bullish or bearish.
• Enable ATR Breakout: Toggle ATR breakout detection.
o ATR Length: Period for ATR.
o Breakout Lookback: Bars to look back for recent highs/lows.
o ATR Multiplier: Multiplier for breakout threshold.
• Enable Higher Timeframe Trend: Toggle HTF EMA alignment.
o Higher Timeframe: E.g., “5” for 5-minute when on 1-minute chart, or “60” for 5 Min when on 15m, etc. Uses lookahead_off.
• Enable ADX Regime Filter: Toggles regime-based weighting.
o ADX Length: Period for manual ADX calculation.
o ADX Threshold: Value above which market considered trending.
o Ranging Weight Multiplier: Weight applied to trend components when ADX < threshold (e.g., 0.5).
• Scale VWMA Momentum: Toggle normalization of VWMA momentum magnitude.
o VWMA Mom Scale Lookback: Period for average absolute VWMA momentum.
• Scale ATR Breakout Strength: Toggle normalization of breakout distance by ATR.
o ATR Scale Cap: Maximum multiple of ATR used for breakout strength.
• Enable Price-RSI Divergence: Toggle divergence detection.
o RSI Length for Divergence: Period for RSI.
o Pivot Lookback for Divergence: Bars on each side to identify pivot high/low.
o Divergence Penalty: Amount to subtract/add to score when divergence detected (e.g., 0.5).
3. Score Settings
• Smooth Score: Toggle EMA smoothing of normalized score.
• Score Smoothing Length: Period for smoothing EMA.
• Weak Threshold: Absolute score value under which trend is considered weak or neutral.
• Medium Threshold: Score above Weak but below Medium is moderate.
• Strong Threshold: Score above this indicates strong trend.
4. Visualization Settings
• Show Δ Score Histogram: Toggle display of the bar-to-bar change in score as a histogram. Default true.
• Show Divergence Fill: Toggle background fill highlighting confirmed divergences. Default true.
Each input has a tooltip in the code.
________________________________________
## 10. Limitations, Repaint Notes, and Disclaimers
10.1. Repaint & Lag Considerations
• Pivot-Based Divergence Lag: The divergence detection uses ta.pivothigh / ta.pivotlow with a specified lookback. By design, a pivot is only confirmed after the lookback number of bars. As a result:
o Divergence labels or fills appear with a delay equal to the pivot lookback.
o Once the pivot is confirmed and the divergence is detected, the fill/label does not repaint thereafter, but you must understand and accept this lag.
o Users should not treat divergence highlights as predictive signals without additional confirmation, because they appear after the pivot has fully formed.
• Higher-Timeframe EMA Alignment: Uses request.security(..., lookahead=barmerge.lookahead_off), so no future data from the higher timeframe is used. This avoids lookahead bias and ensures signals are based only on completed higher-timeframe bars.
• No Future Data: All calculations are designed to avoid using future information. For example, manual ADX uses RMA on past data; security calls use lookahead_off.
10.2. Market & Noise Considerations
• In very choppy or low-liquidity markets, some components (e.g., volume spikes or VWMA momentum) may be noisy. Users can disable or adjust those components’ parameters.
• On extremely low timeframes, noise may dominate; consider smoothing lengths or disabling certain features.
• On very high timeframes, pivots and breakouts occur less frequently; adjust lookbacks accordingly to avoid sparse signals.
10.3. Not a Standalone Trading System
• This is an indicator, not a complete trading strategy. It provides signals and context but does not manage entries, exits, position sizing, or risk management.
• Users must combine it with their own analysis, money management, and confirmations (e.g., price patterns, support/resistance, fundamental context).
• No guarantees: past behavior does not guarantee future performance.
10.4. Disclaimers
• Educational Purposes Only: The script is provided as-is for educational and informational purposes. It does not constitute financial, investment, or trading advice.
• Use at Your Own Risk: Trading involves risk of loss. Users should thoroughly test and use proper risk management.
• No Guarantees: The author is not responsible for trading outcomes based on this indicator.
• License: Published under Mozilla Public License 2.0; code is open for viewing and modification under MPL terms.
________________________________________
## 11. Alerts
• The indicator defines three alert conditions:
1. Bullish Trend: when the aggregated score crosses above the Weak threshold.
2. Bearish Trend: when the score crosses below the negative Weak threshold.
3. Neutral Trend: when the score returns within ±Weak after being outside.
Good luck
– BullByte
