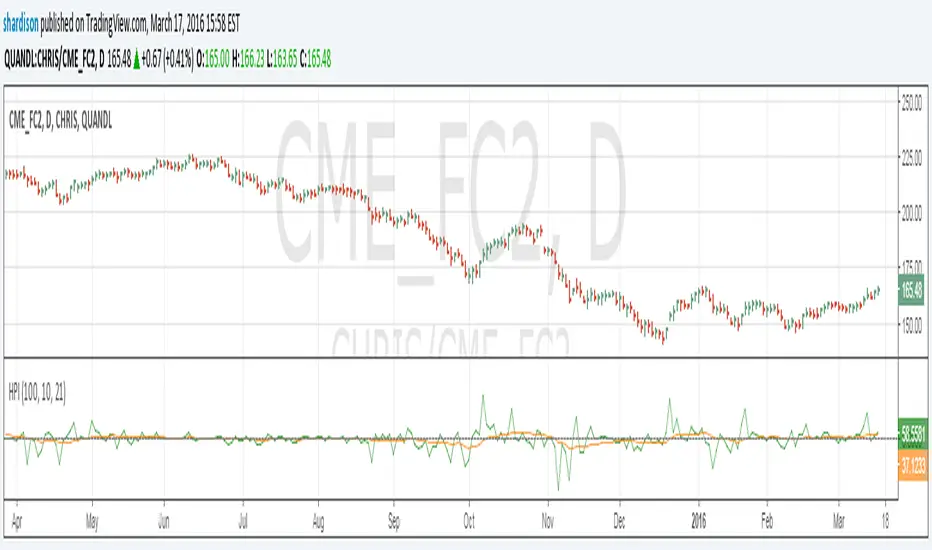
Herrick Payoff Index for Quandl DataUpdate to my previous Herrick Payoff Index script. This script pulls Quandl futures data with daily open interest. The prior version only used the weekly Commitment of Traders open interest data so could only be used on weekly bars. Note: Must use Quandl Symbol methodology in chart (i.e. enter symbol as QUANDL:CHRIS/CME_FC2, QUANDL:CME/FCX2016, ect.). Unfortunately, I haven't been able to program this to pull from the embedded futures data.
"index" için komut dosyalarını ara

BTC Volume Index 1.1 beta [Dia]Indicator calculates total volume across multiple bitcoin exchanges. The influence of each exchange can be adjusted seperately.
0 fee exchanges default to 50%
0 fee futures default to 10%
Define custom lookback periods for price breakout detection.
Look for low-volume price reversals in those candles immediately following high volume peaks. The lower the volume and the greater the open/close price difference of that 2nd candle is compared to the previous one, the higher the likelihood of a local top/bottom being in.
Note:
Bar highlighting is still experimental, future versions will include better filtering options.
Use for confirmation only, not as standalone trading system.

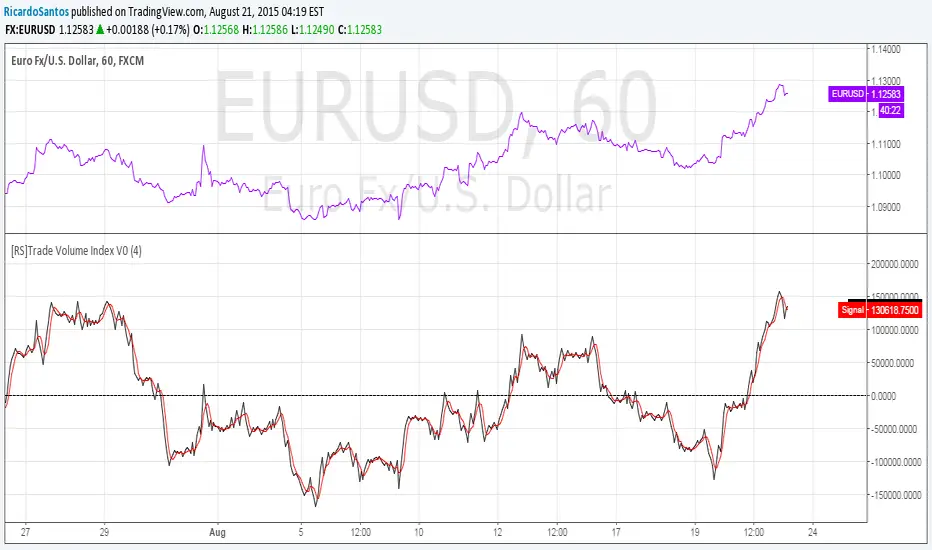
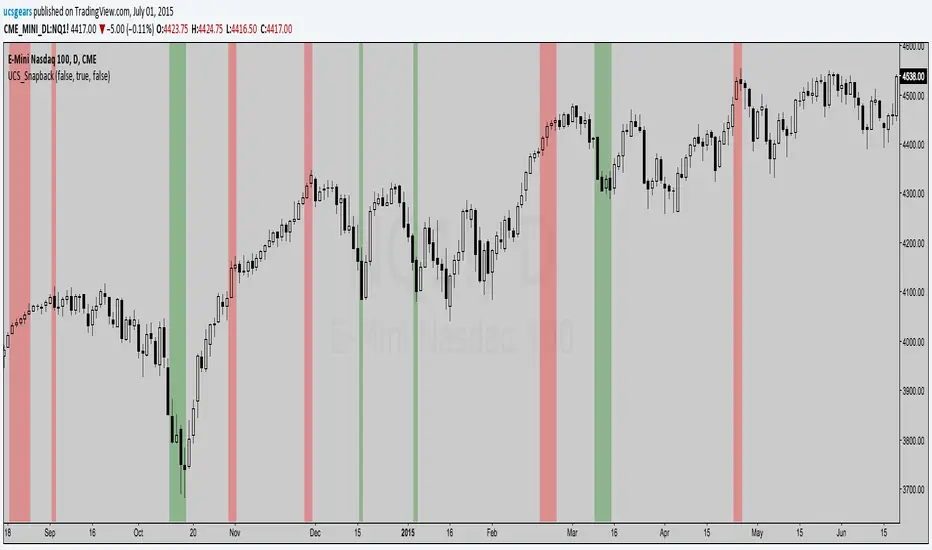
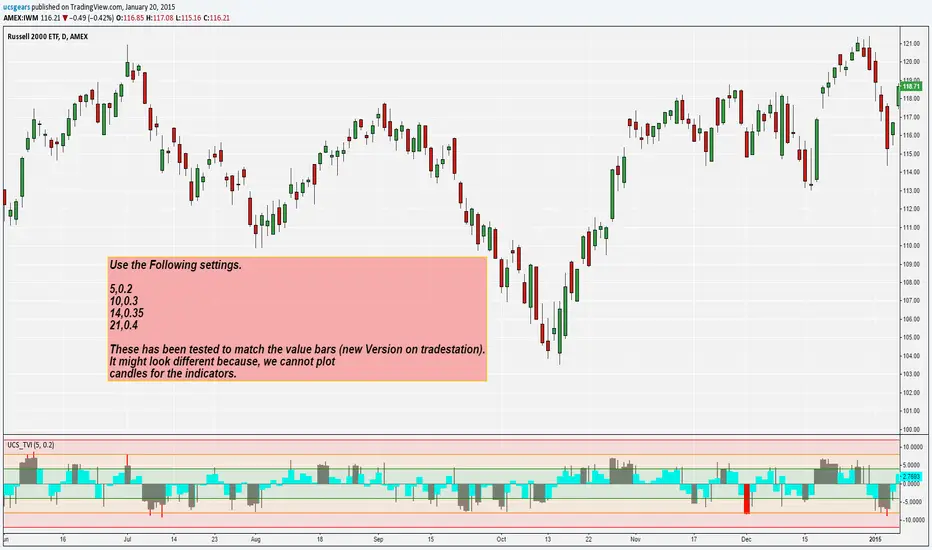
UCS_Extreme Snap Back (TVI)I am calling it a SNAP BACK indicator.
Utilizing the TVI (Transactional Value Index - Link below for indicator / setups)
You can pretty much guess when any instrument could slow down, last stand in a pullback and the last few candles before losing its strong trend.
It varies per person, a short term trader can use this, Long term traders can hedge with options.
A great tool for my trading. Thought I will share this.
This utilizes TVI indicator, currently the TVI is manipulated manually, I have automated a version for future release.
Embrace trading - keep the money flowing.
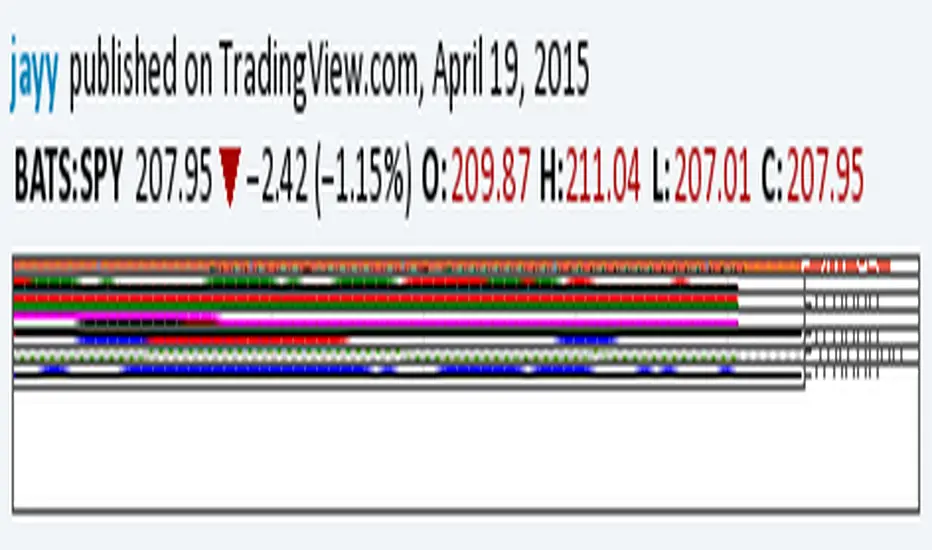
Composite Momentum Index [LazyBear]This is a composite oscillator derived from modified 5/10/20 Chande's Dynamic Momentum Index values.
Volatility is factored in, by design. Look for OB/OS extremes and divergences.
I added the green/red ribbon look to make it easy to read :)
More info:
www.investopedia.com
List of my public indicators: bit.ly
List of my app-store indicators: blog.tradingview.com

Relative strength to Index set up as per Leaf_WestRelative Strength to index as used by Leaf_West. If you follow his methods be aware of the different moving averages for the different time periods. From Leaf_West: "on my weekly and monthly R/S charts, I include a 13 EMA of the R/S (brown dash line) and an 8 SMA of the 13 EMA (pink solid line). The indicator on the bottom of the weekly/monthly charts is an 8 period momentum indicator of the R/S line. The red horizontal line is drawn at the zero line.
For daily or 130-minute time periods (or shorter), my R/S charts are slightly different - the moving averages of the R/S line include a 20EMA (brown dash line), a 50 EMA (blue dash line) and an 8 SMA of the20 EMA (pink solid line). The momentum indicator is also slightly different from the weekly/monthly charts – here I use a 12 period calculation (vs 8 SMA period for the weekly/monthly charts)." Leaf's methods do evolve and so watch for any changes to the preferred MAs etc..
Bitcoin Index vs. Futures OKCoin WeeklySimple adaptation to lastbattles script to add calculation for index price: calculation can be seen here: www.okcoin.com
I recommend setting it to columns, and setting price at 0, 0 to see divergence of sell/buy.

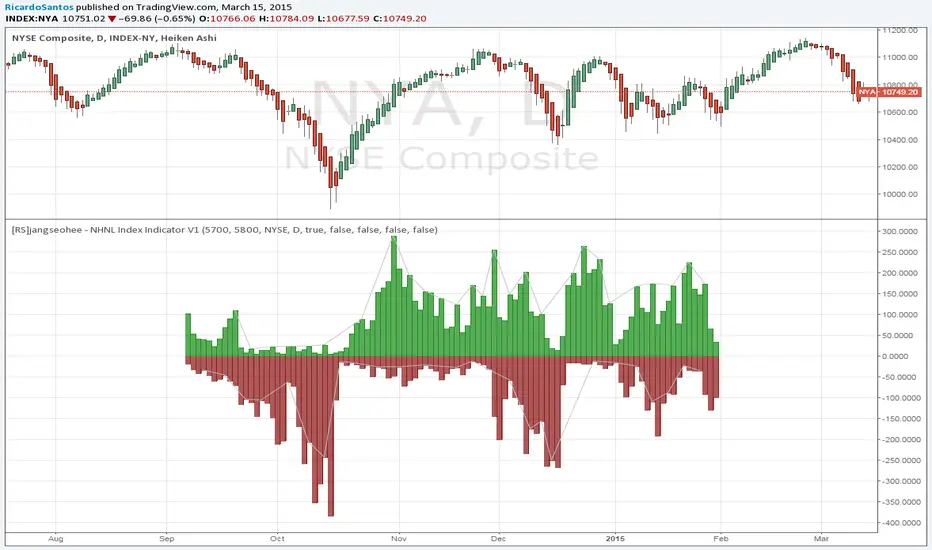
[RS]jangseohee - NHNL Index Indicator V1request for jangseohee: added option for different exchanges, added option to remove data before X point and after Y point in time using candle numbers.
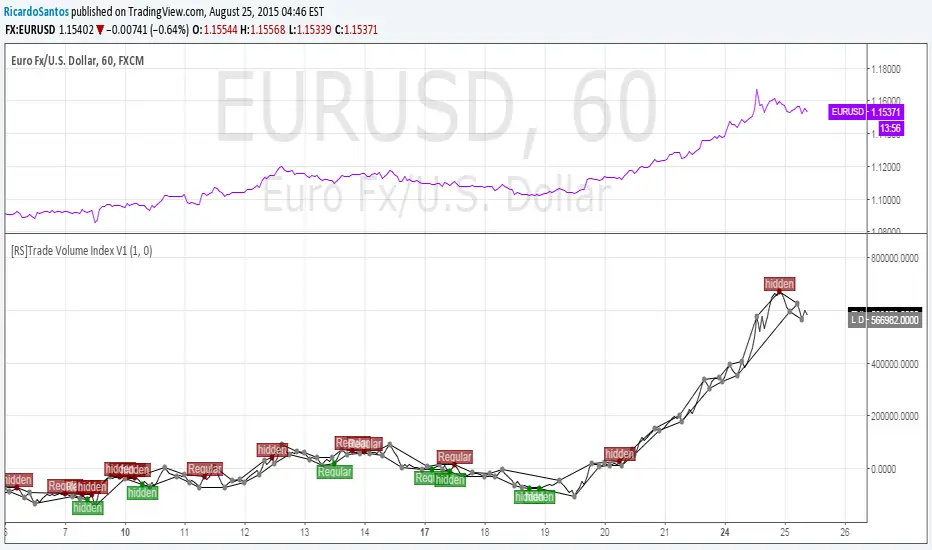
UCS_Transactional Valuation Index-Version 2Version 1 -
Updates include
Better Optimization on the levels.
Plotting only the important Highs and Lows
The extremes can be an important pivot levels.
Over and Undervalue - Gray (Column - close) (Histogram - High/Low)
Extreme conditions - Red
Extreme Alerts and Overlay will be added later.


Enhanced Index [LazyBear]The Enhanced Index (EIDX) is a modified William %R that behaves much like the original, to indicate overbought and oversold market conditions.
EIDX has the advantage of
- Reacting more quickly to changes in buying power.
- Predicting market turning points better than other oscillators. Divergences are more pronounced.
List of my other indicators:

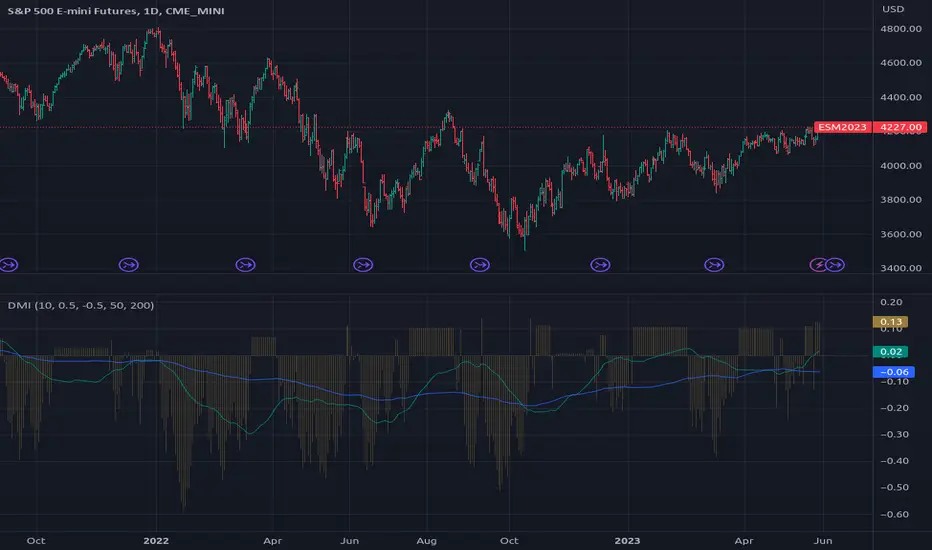
TheLark: Directional Movement Index OscillatorA modified DMI, This turns the standard DMI into an Oscillator. The DMI cross signal is the same, but as an OSC you get the added benefits or finding divergences, etc. The added WIlder's Average Line (blue) can help you see if a short term trend is getting less interesting.

The Lark: Directional Movement IndexAn open source version of the DMI. Mostly published for other scripters to modify.
Typical useage: www.investopedia.com

Indicator: Intrady Momentum IndexThe Intraday Momentum Index (IMI), developed by Tushar Chande, is a cross-breed between RSI and candlestick analysis. IMI determines the candle type that dominated the recent price action, using that to pinpoint the extremes in intraday momentum.
As the market tries to bottom after a sell off, there are gradually more candles with green bodies, even though prices remain in a narrow range. IMI can be used to detect this shift, because its values will increase towards 70. Similarly, as the market begins to top, there will be more red candles, causing IMI to decline towards 20. When the market is in trading range, IMI values will be in the neutral range of 40 to 60.
Usually intraday momentum leads interday momentum. QStick can show interday momentum, it complements IMI. You will find it in my published indicators.
I have added volatility bands based OB/OS, in addition to static OB/OS levels. You can also turn on IMI Ehlers smoothing. BTW, all parameters are configurable, so do check out the options page.
List of my other indicators:
-
- Google doc: docs.google.com

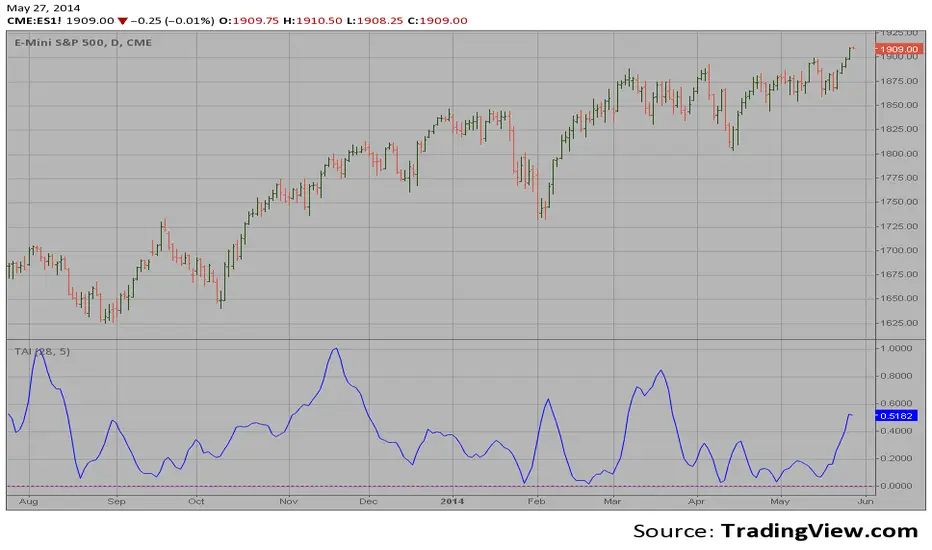
Trend Analysis Index In essence, it is simply the standard deviation of the last x bars of a
y-bar moving average. Thus, the TAI is a simple trend indicator when prices
trend with authority, the slope of the moving average increases, and when
prices meander in a trendless range, the slope of the moving average decreases.
Force IndexHi,
This Indicator plots the Force Index as described by Dr. Alexander
Elder in "Trading For a Living." The ForceIndex indicator relates
price to volume by multiplying net change and volume. ForceIndex is
calculated using the following equation:
ForceIndex = Volume(today) * (Close(this period) - Close(last period))
ForceIndex is typically presented as two smoothed averages (slow and fast)
to avoid false signals.

FREE INDICATOR: CHOPPINESS INDEX "TREND DETECTION FROM CHAOS"About:
The Choppiness Index was created by E.W. Dreiss out of chaos theory, and attempts to gauge the current market's trendiness.
I've seen a few versions of this floating around, but this was built off the true version as described in the original 1993 release, you can read more about it here: www.edwards-magee.com
Usage:
Values above 61.8 are considered very choppy, values below 38.2 are considered very trendy, but values along the entire scale can help you determine position sizing, or even weather you should be getting into this trade or not.
If you are looking for a new way to know weather the market is trending, about to trend, or just going sideways, this very handy indicator for algorithmic trading may be your answer.
Grab the source code here: pastebin.com
Installation video by @ChrisMoody here : blog.tradingview.com
░░░░░░░░░░░░░░░ Feel free to follow me to keep up with my latest scripts! ░░░░░░░░░░░░░░░
░░░░░░░░░░░░ PLEASE THUMB UP OR STAR IF YOU LIKE THIS INDICATOR! ░░░░░░░░░░░░
I'd like as many people as possible to get it :)

Indicator: Market Facilitation Index [MFIndex]
***** NOTE: You may see all GREEN circles (it is due to a recent TV update). To work around this issue, change the "Circles" to "Cross" via Format -> Style *****
Market Facilitation Index, by Bill Williams, plots the effectiveness of price movement by computing the price movement per volume unit.
4 possible combinations of MFIndex and Volume are:
Green :
---------------------------------
MFIndex increases and the volume increases. This means that the amount of participants entering the market increases, therefore the volume increases and the fresh incoming players align their positions in the direction of candlestick growth.
Fade :
------------------------------
MFIndex falls and volume falls. It means that the market participants are indifferent and the price movement is small on small volumes. This usually happens at the end of a trend.
Fake :
------------------------------
MFIndex increases, but the volume falls. It is highly likely that the market is being supported by broker speculation and not any significant client volume.
Squat :
--------------------------------
MFIndex falls, but the volume increases. In this particular situation bulls and bears are fighting between themselves to see who will dominate the next trend. These battles are noticeable by the large sell and buy volumes. However, the price does not change appreciably since the strengths are equal. One of the competing parties either the buyers or the sellers will ultimately triumph in the battle. Usually, the fracture of such a candle indicates if this particular candle determines the continuation of the trend, or terminates the trend.
More info: en.wikipedia.org
Code: pastebin.com
