OPEN-SOURCE SCRIPT
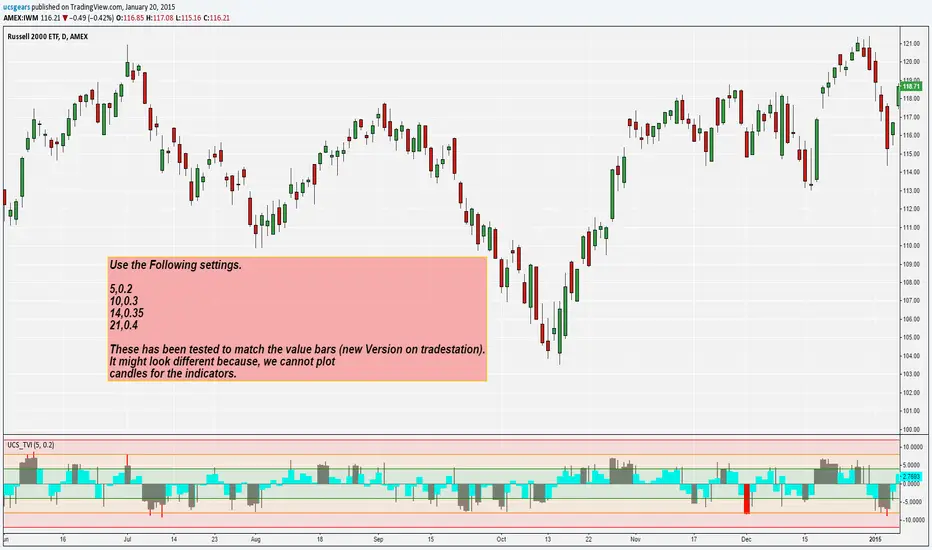
UCS_Transactional Valuation Index-Version 2
Version 1 - tradingview.com/v/BRrxp5vv/
Updates include
Better Optimization on the levels.
Plotting only the important Highs and Lows
The extremes can be an important pivot levels.
Over and Undervalue - Gray (Column - close) (Histogram - High/Low)
Extreme conditions - Red
Extreme Alerts and Overlay will be added later.
Updates include
Better Optimization on the levels.
Plotting only the important Highs and Lows
The extremes can be an important pivot levels.
Over and Undervalue - Gray (Column - close) (Histogram - High/Low)
Extreme conditions - Red
Extreme Alerts and Overlay will be added later.
Açık kaynak kodlu komut dosyası
Gerçek TradingView ruhuna uygun olarak, bu komut dosyasının oluşturucusu bunu açık kaynaklı hale getirmiştir, böylece yatırımcılar betiğin işlevselliğini inceleyip doğrulayabilir. Yazara saygı! Ücretsiz olarak kullanabilirsiniz, ancak kodu yeniden yayınlamanın Site Kurallarımıza tabi olduğunu unutmayın.
Uday C Santhakumar
Feragatname
Bilgiler ve yayınlar, TradingView tarafından sağlanan veya onaylanan finansal, yatırım, işlem veya diğer türden tavsiye veya tavsiyeler anlamına gelmez ve teşkil etmez. Kullanım Şartları'nda daha fazlasını okuyun.