OPEN-SOURCE SCRIPT
UCS_Extreme Snap Back (TVI)
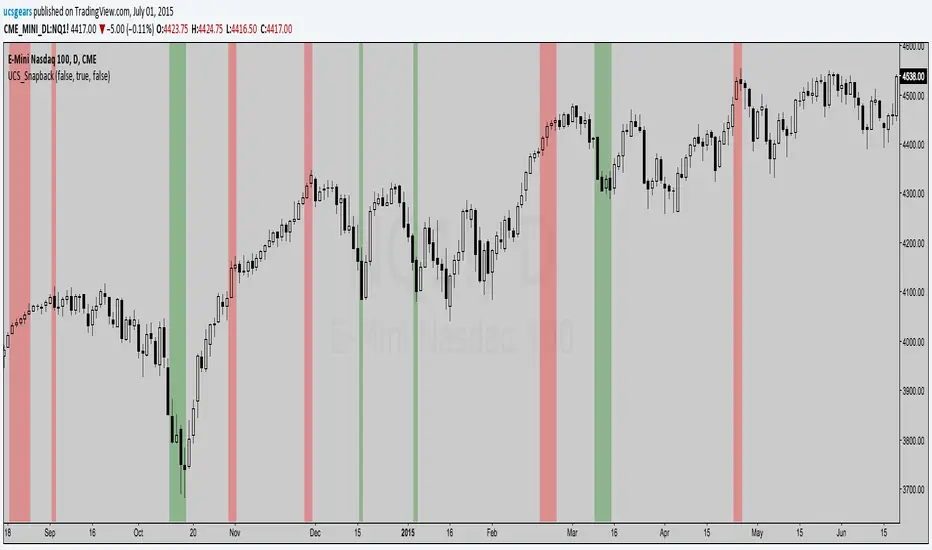
I am calling it a SNAP BACK indicator.
Utilizing the TVI (Transactional Value Index - Link below for indicator / setups)
You can pretty much guess when any instrument could slow down, last stand in a pullback and the last few candles before losing its strong trend.
It varies per person, a short term trader can use this, Long term traders can hedge with options.
A great tool for my trading. Thought I will share this.

This utilizes TVI indicator, currently the TVI is manipulated manually, I have automated a version for future release.
Embrace trading - keep the money flowing.
Utilizing the TVI (Transactional Value Index - Link below for indicator / setups)
You can pretty much guess when any instrument could slow down, last stand in a pullback and the last few candles before losing its strong trend.
It varies per person, a short term trader can use this, Long term traders can hedge with options.
A great tool for my trading. Thought I will share this.
This utilizes TVI indicator, currently the TVI is manipulated manually, I have automated a version for future release.
Embrace trading - keep the money flowing.
Açık kaynak kodlu komut dosyası
Gerçek TradingView ruhuna uygun olarak, bu komut dosyasının oluşturucusu bunu açık kaynaklı hale getirmiştir, böylece yatırımcılar betiğin işlevselliğini inceleyip doğrulayabilir. Yazara saygı! Ücretsiz olarak kullanabilirsiniz, ancak kodu yeniden yayınlamanın Site Kurallarımıza tabi olduğunu unutmayın.
Uday C Santhakumar
Feragatname
Bilgiler ve yayınlar, TradingView tarafından sağlanan veya onaylanan finansal, yatırım, işlem veya diğer türden tavsiye veya tavsiyeler anlamına gelmez ve teşkil etmez. Kullanım Şartları'nda daha fazlasını okuyun.