2xIchimoku Cloud + 4xEMA + Williams FractalCopy+Pasted/edited the code from :
Moku
www.tradingview.com
EMA
www.tradingview.com
Fractal
www.tradingview.com
"ichimoku" için komut dosyalarını ara

vdub Atlasvdub Atlas, Multiple strategy combined indicator
ichmoku,
inside bollinger bands,
Multiple ma's,
Strength indicator MA's
Hull ma,
vdub binaryPro,
Session background colours.
Switch out any indicator you don't want.

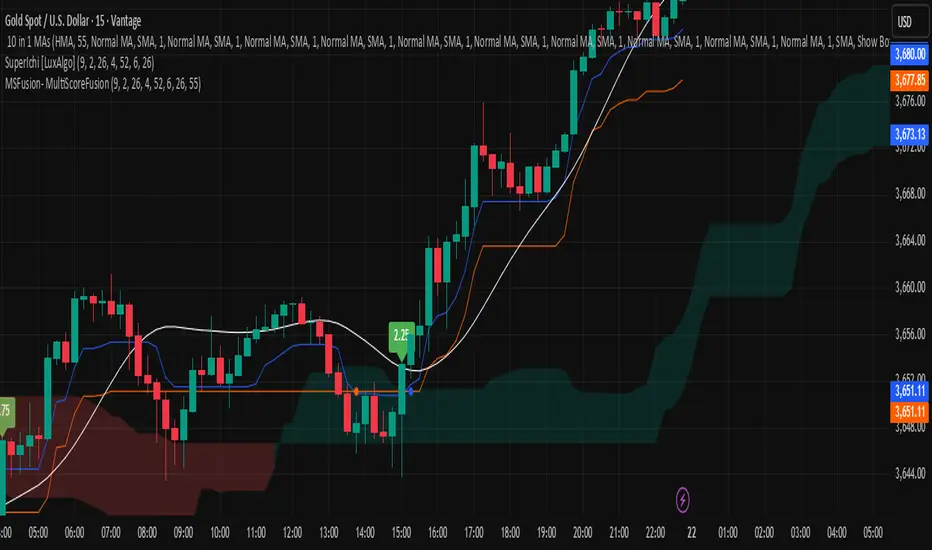
MSFusion- MultiScoreFusionThis Pine Script strategy, MSFusion - MultiScoreFusion, combines Ichimoku components and Hull Moving Average (HMA) signals to generate a composite score for each bar.
It evaluates several conditions—such as price crossing above HMA55, Tenkan and Kijun lines, and price position relative to the Ichimoku cloud—and assigns scores to each.
The script displays a label with the total score and a tooltip listing the contributing conditions when a strong bullish signal is detected. This approach helps traders quickly assess market momentum and trend strength using multiple technical criteria.
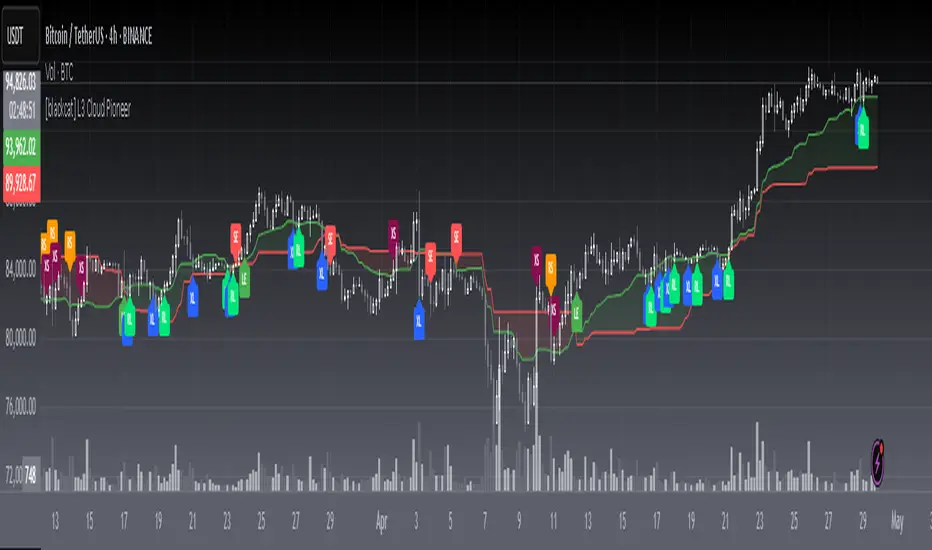
[blackcat] L3 Cloud PioneerOVERVIEW
The L3 Cloud Pioneer indicator combines elements of the Ichimoku Kinko Hyo system with Donchian Channels to provide a robust trend-following tool. This enhanced version includes detailed trade signal labels and alerts, helping traders identify potential entry and exit points more clearly. By plotting dynamic cloud areas and providing visual cues, this indicator aids in making informed trading decisions 📊📉↗️.
FEATURES
Calculates key Ichimoku components using custom Donchian Channel logic:
Conversion Line (based on highest/highest values over specified periods).
Base Line.
Leading Spans.
Lagging Span 2.
Plots a dynamic cloud area between Leading Span 1 and Leading Span 2, colored based on trend direction 🎨.
Identifies trend changes and provides clear entry/exit signals:
LE: Long Entry (when trend turns bullish).
SE: Short Entry (when trend turns bearish).
XL: Exit Long (price crosses below Leading Span 1 during an uptrend).
RL: Re-enter Long (price crosses above Leading Span 1 during an uptrend).
XS: Exit Short (price crosses above Leading Span 1 during a downtrend).
RS: Re-enter Short (price crosses below Leading Span 1 during a downtrend).
Displays corresponding labels on the chart for easy visualization, complete with tooltips for additional information 🏷️.
Generates alerts for each signal event to keep users informed about potential trades 🔔.
Supports customizable input parameters for conversion line, base line, and lagging span periods ⚙️.
HOW TO USE
Add the indicator to your TradingView chart by selecting it from the indicators list.
Adjust the input parameters (Conversion Line Periods, Base Line Periods, Lagging Span 2 Periods) to fit your preferences.
Observe the plotted cloud and labels for trend direction and potential trade opportunities.
Set up alerts based on the generated signals to receive notifications when conditions are met 📲.
Combine this indicator with other tools for confirmation before making trading decisions.
DETAILED SIGNAL LOGIC
Trend Determination:
The script determines the trend direction by comparing leading_line1 and leading_line2.
If leading_line1 is above leading_line2, the trend is considered bullish (isBullish). Otherwise, it's bearish (isBearish).
Signal Conditions:
Long Entry (LE): Triggered when the trend turns bullish from bearish.
Short Entry (SE): Triggered when the trend turns bearish from bullish.
Exit Long (XL): Triggered when the price crosses below leading_line1 during an uptrend.
Re-enter Long (RL): Triggered when the price crosses above leading_line1 during an uptrend.
Exit Short (XS): Triggered when the price crosses above leading_line1 during a downtrend.
Re-enter Short (RS): Triggered when the price crosses below leading_line1 during a downtrend.
Label Styling:
Labels are color-coded for quick identification:
Green for long entries and re-entries.
Red for short entries and exits.
Blue for exiting long positions.
Orange for re-entering short positions.
Tooltips provide additional context for each label.
Alert Configuration:
Alerts are generated for each signal condition, ensuring traders are notified promptly.
Users can set up these alerts within TradingView by creating new alerts and selecting the appropriate conditions.
LIMITATIONS
The indicator may lag behind price action due to its use of moving averages and channel calculations 🕒.
False signals can occur in choppy or sideways markets 🌪️.
Users should always confirm signals with other forms of analysis.
NOTES
Ensure that you have sufficient historical data available for accurate calculations.
Test the indicator thoroughly on demo accounts before applying it to live trading 🔍.
Customize the appearance and parameters as needed to fit your trading strategy.
For better risk management, consider integrating stop-loss and take-profit levels into your trading plan.
To optimize performance, manage old labels by deleting them after a certain period to avoid clutter on the chart.
Hosoda Time Cycles (Forward + Backward)Hosoda Time Cycles
Market Timing Projection Tool
The Hosoda Time Cycles indicator is inspired by the legendary Japanese trader Ichimoku Hosoda, who emphasized the power of time in forecasting market behavior. This tool visualizes forward and backward time cycles based on significant price pivots, enabling traders to anticipate potential trend shifts, consolidations, or continuations with high precision.
Key Features:
Forward & Backward Cycles: Projects future and past time intervals based on selected pivots to reveal cyclical patterns.
Manual & Auto Pivot Selection: Choose between automatic detection or manually selected swing highs/lows.
Cycle Ratios: Includes traditional Hosoda counts such as 9, 17, 26, 33, 42, and 65 — key numbers in Ichimoku time theory.
Multi-Timeframe Utility: Effective across intraday, swing, and long-term charts.
Minimalist Overlay: Clean design to avoid clutter while providing powerful cycle insights.
Customizable Visuals: Adjustable line styles, colors, and cycle projection lengths for clarity and personalization.
Ideal For:
Traders focused on time-based confluence, cycle forecasting, and market rhythm detection, especially those who blend price action with Japanese trading techniques.

TrendMasterPro_FekonomiTrend Change and Start Signals with Weighted Conditions
The Trend Change and Start Signals with Weighted Conditions indicator leverages various technical analysis tools to generate reliable buy and sell signals. This indicator helps investors more accurately identify trend changes and start signals in the market.
Features:
Utilizes popular technical analysis tools such as MACD, RSI, EMA, and Ichimoku Cloud.
Enhances signal accuracy with additional indicators like ADX and Volume Increase.
Allows users to adjust the weights of each condition to set their importance.
The Confidence Level parameter lets you adjust the accuracy rate of the signals.
Visual Signals make it easy to track buy and sell points directly on the chart.
How It Works:
Condition Weights: Users assign weights to indicators like MACD, RSI, EMA, and Ichimoku Cloud. If you have no idea, use default settings.
Condition Fulfillment: Checks if the conditions for each indicator are met.
Confidence Level: The total weight of the fulfilled conditions must exceed the user-defined confidence level.
Signal Generation: When these conditions are met, a buy or sell signal is generated and visually displayed on the chart.
Customization:
Personalize Signals: By adjusting the weights of the indicators used, you can personalize the signals to match your trading strategy and preferences.
Use Cases:
Short-Term Investments: Identify quick trend changes for short-term trading decisions.
Long-Term Investments: Detect long-term trend starts and changes for strategic investment decisions.
Technical Analysis: Combine different technical analysis tools for more comprehensive and reliable analyses.
With this indicator, you can better understand market movements and make more informed investment decisions. Try it now and enhance your trading strategy!
by Fekonomi

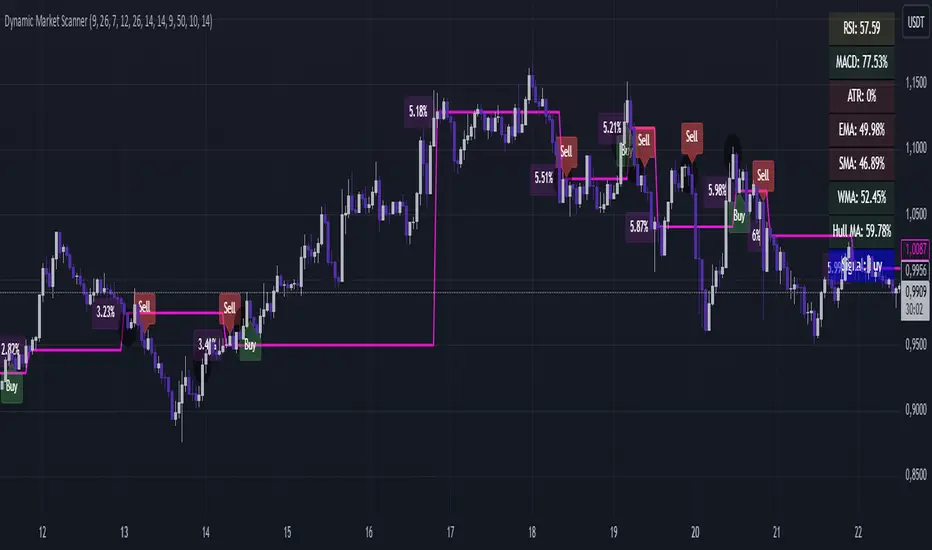
Dynamic Market ScannerDynamic Market Scanner is a powerful tool for analyzing financial markets, combining a variety of indicators to provide clear and understandable signals.
Key Features:
- Signal Generation:
The main signals "Buy", "Sell", and "Hold" are formed based on the analysis of indicators:
- MACD
- RSI
- SMA
- EMA
- WMA
- Hull MA
Additional Analytical Tools:
- ATR is used to assess volatility and helps to understand the risk of the current market situation.
- SMA Ichimoku does not generate signals but is used to assess their accuracy.
- If the price is above the SMA, "Buy" signals are more likely, as this confirms the strength of the upward movement.
- If the price is below the SMA, "Buy" signals require additional confirmations.
Dashboard:
Displays the current price position relative to the indicators, helping the trader understand how strong or weak the current signals are.
Advantages of Using:
1. Signal Filtering:
The price position relative to the SMA Ichimoku helps to assess the likelihood of successful trades.
2. Volatility Analysis:
ATR provides additional information about risks and market fluctuations.
3. Comprehensive Approach:
Signal generation is based on a combination of key indicators, offering a multifaceted view of the market.
Explanation of Percent Calculation in the Table:
- The table shows the values of indicators such as MACD, ATR, EMA, SMA, WMA, and Hull MA in percentages. Percentages are calculated based on the current value of the indicator relative to its maximum and minimum.
- Percentages are displayed for each indicator, allowing traders to assess market conditions based on their current values.
Dynamic Market Scanner will become a reliable assistant in your technical analysis toolkit, providing a comprehensive overview of market conditions and helping to make informed trading decisions.
S&R Precision Cloud by Dr. Abiram Sivprasad -4 directional biasDescription of the Script
**Script Name:** S&R Precision Cloud by Dr. Abhiram Sivprasad
**Overview:**
This script is designed to identify key support and resistance levels using the Central Pivot Range (CPR) methodology along with daily, weekly, and monthly pivots. It incorporates the Lagging Span from the Ichimoku Cloud to enhance decision-making in trading strategies for intraday, swing, and long-term positions mainly for directional bias.
---
### Key Components:
1. **Central Pivot Range (CPR):**
- **Central Pivot (CP):** Calculated as the average of the high, low, and close prices. This serves as a reference point for price action.
- **Below Central Pivot (BC) and Top Central Pivot (TC):** Derived to create a range that aids in identifying support and resistance levels.
2. **Support and Resistance Levels:**
- The script computes three support (S1, S2, S3) and resistance (R1, R2, R3) levels based on the Central Pivot.
- These levels are plotted for daily, weekly, and monthly time frames, providing traders with multiple reference points.
3. **Lagging Span:**
- The Lagging Span is plotted as the closing price shifted backward by 26 periods (as per Ichimoku settings).
- This serves as a filter for trade entries, where positions should only be taken in the direction opposite to where the price is relative to this line.
4. **User Inputs:**
- The script allows customization through checkboxes to plot daily, weekly, and monthly support and resistance levels as needed.
- Users can choose whether to display CPR and various support/resistance levels for better visual clarity.
5. **Color Coding:**
- The support and resistance lines are color-coded to distinguish between different levels (green for support, red for resistance, and blue for pivots).
---
### Trading Strategies:
- **Intraday Trading:**
- Utilize price movements around the Lagging Span and support/resistance levels for quick trades.
- **Swing Trading:**
- Identify potential reversal points at S2 and R2 levels, confirmed by divergences in price movement.
- **Long-Term Trading:**
- Monitor price behavior against the Lagging Span and significant pivot levels to capture longer trends.
---
### Summary:
This script equips traders with essential tools for technical analysis by clearly defining critical price levels and incorporating the Lagging Span for directional bias. It is suitable for various trading styles, including intraday, swing, and long-term strategies, making it a versatile addition to any trader’s toolkit.

Swiss Knife [MERT]Introduction
The Swiss Knife indicator is a comprehensive trading tool designed to provide a multi-dimensional analysis of the market. By integrating a wide array of technical indicators across multiple timeframes, it offers traders a holistic view of market sentiment, momentum, and potential reversal points. This indicator is particularly useful for traders looking to combine trend analysis, momentum indicators, volume data, and price action into a single, easy-to-read format.
---
Key Features
Multi-Timeframe Analysis : Evaluates indicators on Daily , 4-Hour , 1-Hour , and 15-Minute timeframes.
Comprehensive Indicator Suite : Incorporates MACD , Awesome Oscillator (AO) , Parabolic SAR , SuperTrend , DPO , RSI , Stochastic Oscillator , Bollinger Bands , Ichimoku Cloud , Chande Momentum Oscillator (CMO) , Donchian Channels , ADX , volume-based momentum indicators, Fractals , and divergence detection.
Market Sentiment Scoring : Aggregates signals from multiple indicators to provide an overall sentiment score.
Visual Aids : Displays EMA lines, trendlines, divergence signals, and a sentiment table directly on the chart.
Super Trend Reversal Signals : Identifies potential market reversal points by assessing the momentum of automated trading bots.
---
Explanation of Each Indicator
Moving Average Convergence Divergence (MACD)
- Purpose : Measures the relationship between two moving averages of price.
- Interpretation : A positive histogram suggests bullish momentum; a negative histogram indicates bearish momentum.
Awesome Oscillator (AO)
- Purpose : Gauges market momentum by comparing recent market movements to historic ones.
- Interpretation : Above zero indicates bullish momentum; below zero indicates bearish momentum.
Parabolic SAR (SAR)
- Purpose : Identifies potential reversal points in price direction.
- Interpretation : Dots below price suggest an uptrend; dots above price suggest a downtrend.
SuperTrend
- Purpose : Determines the prevailing market trend.
- Interpretation : Provides buy or sell signals based on price movements relative to the SuperTrend line.
Detrended Price Oscillator (DPO)
- Purpose : Removes trend from price to identify cycles.
- Interpretation : Values above zero suggest price is above the moving average; values below zero indicate it is below.
Relative Strength Index (RSI)
- Purpose : Measures the speed and change of price movements.
- Interpretation : Values above 50 indicate bullish momentum; values below 50 indicate bearish momentum.
Stochastic Oscillator
- Purpose : Compares a particular closing price to a range of its prices over a certain period.
- Interpretation : Values above 50 indicate bullish conditions; values below 50 indicate bearish conditions.
Bollinger Bands (BB)
- Purpose : Measures market volatility and provides relative price levels.
- Interpretation : Price above the middle band suggests bullishness; below the middle band suggests bearishness.
Ichimoku Cloud
- Purpose : Provides support and resistance levels, trend direction, and momentum.
- Interpretation : Bullish signals when price is above the cloud; bearish signals when price is below the cloud.
Chande Momentum Oscillator (CMO)
- Purpose : Measures momentum on both up and down days.
- Interpretation : Values above 50 indicate strong upward momentum; values below -50 indicate strong downward momentum.
Donchian Channels
- Purpose : Identifies volatility and potential breakouts.
- Interpretation : Price above the upper band suggests bullish breakout; below the lower band suggests bearish breakout.
Average Directional Index (ADX)
- Purpose : Measures the strength of a trend.
- Interpretation : DI+ above DI- indicates bullish trend; DI- above DI+ indicates bearish trend.
Volume Momentum Indicators (VolMom, CumVolMom, POCMom)
- Purpose : Analyze volume to assess buying and selling pressure.
- Interpretation : Positive values suggest bullish volume momentum; negative values indicate bearish volume momentum.
Fractals
- Purpose : Identify potential reversal points in the market.
- Interpretation : Up fractals may indicate a future downtrend; down fractals may indicate a future uptrend.
Divergence Detection
- Purpose : Identifies divergences between price and various indicators (RSI, MACD, Stochastic, OBV, MFI, A/D Line).
- Interpretation : Bullish divergences suggest potential upward reversal; bearish divergences suggest potential downward reversal.
- Note : This functionality utilizes the library from Divergence Indicator .
---
Coloring Scheme
Background Color
- Purpose : Reflects the overall market sentiment by combining sentiment scores from all indicators across different timeframes.
- Interpretation :
- Green Shades : Indicate bullish market sentiment.
- Red Shades : Indicate bearish market sentiment.
- Intensity : The strength of the color corresponds to the strength of the sentiment score.
Sentiment Table
- Purpose : Displays the status of each indicator across different timeframes.
- Interpretation :
- Green Cell : The indicator suggests a bullish signal.
- Red Cell : The indicator suggests a bearish signal.
- Percentage Score : Indicates the overall bullish or bearish sentiment on that timeframe.
Exponential Moving Averages (EMAs)
- Purpose : Provide dynamic support and resistance levels.
- Colors :
- EMA 10 : Lime
- EMA 20 : Yellow
- EMA 50 : Orange
- EMA 100 : Red
- EMA 200 : Purple
Trendlines
- Purpose : Visual representation of support and resistance levels based on pivot points.
- Interpretation :
- Upward Trendlines : Colored green , indicating support levels.
- Downward Trendlines : Colored red , indicating resistance levels.
- Note : Trendlines are drawn using the library from Simple Trendlines .
---
Utility of Market Sentiment
The indicator aggregates signals from multiple technical indicators across various timeframes to compute an overall market sentiment score . This comprehensive approach helps traders understand the prevailing market conditions by:
Confirming Trends : Multiple indicators pointing in the same direction can confirm the strength of a trend.
Identifying Reversals : Divergences and fractals can signal potential turning points.
Timeframe Alignment : Aligning signals across different timeframes can enhance the probability of successful trades.
---
Divergences
Divergence occurs when the price of an asset moves in the opposite direction of a technical indicator, suggesting a potential reversal.
- Bullish Divergence : Price makes a lower low, but the indicator makes a higher low.
- Bearish Divergence : Price makes a higher high, but the indicator makes a lower high.
The indicator detects divergences for:
RSI
MACD
Stochastic Oscillator
On-Balance Volume (OBV)
Money Flow Index (MFI)
Accumulation/Distribution Line (A/D Line)
By identifying these divergences, traders can spot early signs of trend reversals and adjust their strategies accordingly.
---
Trendlines
Trendlines are essential tools for identifying support and resistance levels. The indicator automatically draws trendlines based on pivot points:
- Upward Trendlines (Support) : Connect higher lows, indicating an uptrend.
- Downward Trendlines (Resistance) : Connect lower highs, indicating a downtrend.
These trendlines help traders visualize the trend direction and potential breakout or reversal points.
---
Super Trend Reversals (ST Reversal)
The core idea behind the Super Trend Reversals indicator is to assess the momentum of automated trading bots (often referred to as 'Supertrend bots') that enter the market during critical turning points. Specifically, the indicator is tuned to identify when the market is nearing bottoms or peaks, just before it shifts direction based on the triggered Supertrend signals. This approach helps traders:
Engage Early : Enter the market as reversal momentum builds up.
Optimize Entries and Exits : Enter under favorable conditions and exit before momentum wanes.
By capturing these reversal points, traders can enhance their trading performance.
---
Conclusion
The Swiss Knife indicator serves as a versatile tool that combines multiple technical analysis methods into a single, comprehensive indicator. By assessing various aspects of the market—including trend direction, momentum, volume, and price action—it provides traders with valuable insights to make informed trading decisions.
---
Citations
- Divergence Detection Library : Divergence Indicator by DevLucem
- Trendline Drawing Library : Simple Trendlines by HoanGhetti
---
Note : This indicator is intended for informational purposes and should be used in conjunction with other analysis techniques. Always perform due diligence before making trading decisions.
---

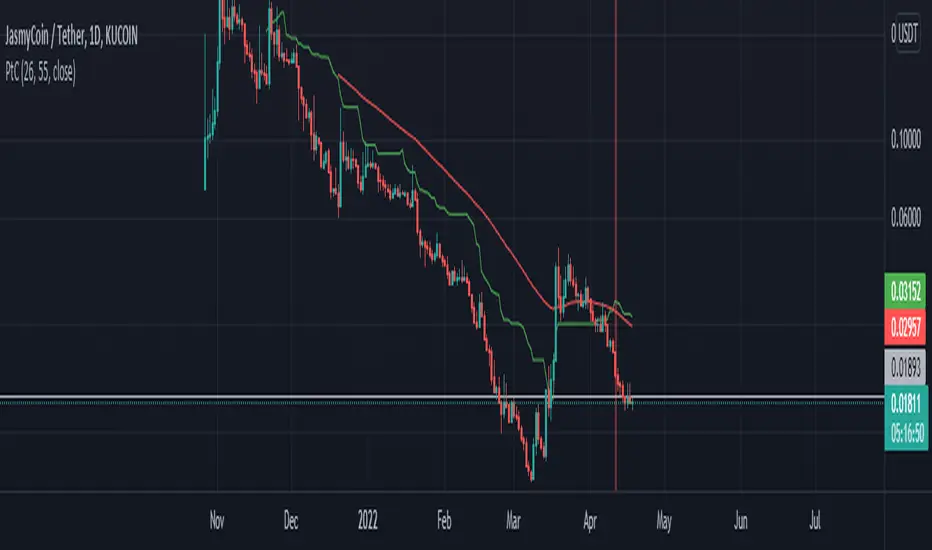
Playing the crossFor this script i used Kijun-sen from Ichimoku Cloud and Moving Average.
Kijun-sen is the base line of the Ichimoku Cloud or the midpoint price of the last 26 period.
Moving Average is a constantly updated average price of a given range.
In this script i used the standard Kijun-sen settings and the Moving Average, 55 length.
You will get an red or green signal when the lines cross each other.
Try the indicator yourself to see, why it could be useful.
A special thanks to @norok and @happyCloud1537 for teaching me!
This will lead to more scripts from my side, since i really like to code and trade.
Momentum CloudThis is a modified Ichimoku Cloud:
-The default Lookback-Length and Displacement settings have been modified to operate optimally on 24/7 markets - which is popular among Crypto analysts.
-The Lagging Span, Base Line, and Conversion Line have been removed - leaving just the bare cloud.
-Additionally, the Cloud's color will shift blue when it is compressed. (More specifically - when Leading Span A retreats to Leading Span B, the color changes.)
This allows the user to easily identify when the Cloud is "thinning", either to the upside, or the downside.
Being that the "spread" or "width" of an Ichimoku Cloud generally gauges it's efficacy as potential Support or Resistance, this tool is particularly useful for highlighting when momentum is weakening.
*This script will be updated in the future to allow the user to view the Momentum Cloud of alternate time-frames! (e.g, Viewing the 1D Momentum Cloud on the 1H timeframe)

1 Indicator to rule them allThe best combination indicator consisting of 4 SMA's, 4 EMA's, Donchian Channels, Parabolic SAR, Bollinger Bands, Ichimoku Cloud, a trend strength highlight for the bollinger bands background according to the ADX, labels on the chart to draw in when the Directional Index plus and minus cross, and a background highlight for low and high volatility according to the Historical Volatility Percentile.
The Indicators and placed and group intentionally, with the SMA and EMA's next to the Donchian Channels to draw in areas of support and resistance, with the parabolic SAR afterwards for confirmation on entries and exits.
Next are the Bollinger Bands and the Ichimoku cloud, which when used in combination by an experienced trader allows one to see the trend and spot any developing opportunities at a glance. These can be used in combination with the ADX background in the bolls to point out when trends start and end.
The Directional Indexes crossing implies a equilibrium point has been reached between the buy and selling pressure. Finally the background highlight according to low and high periods of volatility does well to ensure you're entering into the best trades at the best times.
These indicators used together in combo with momentum oscillators will lead to a full and complete picture of the trend and the most likely places for future price to come, allowing a holistic view and confluence between different, noncollinear indicators to paint occam's razor onto the charts.

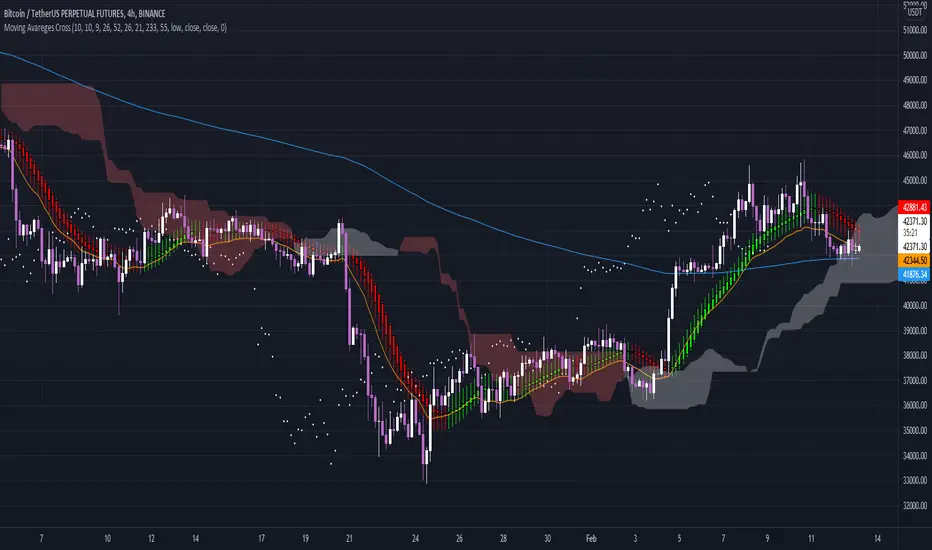
Moving Avareges CrossIn this script I have combined 3 indicators Ichimoku, Heiken Ashi and Moving Average Exponential.
In this strategy, you should first look for the current market trend in low time frames.
Then look at the higher time frames to decide if you are in the right place to enter the trade.
For example, in 1 minute time frame, we first look at whether the two averages 21 and 233 had a cross or not.
If the moving average of 21 crosses the moving average of 233 from the bottom up and the end of the line moves the moving average of 233 upwards, it can be concluded
The market trend in time frame has changed for 1 minute and is up.
Then we refer to the time frames of 3, 5 and 15 minutes and check the same conditions there.
If 3 of the 4 time frames have the same conditions, we use Heiken Ashi to check the strength of the wave that is formed.
And also by looking at Ichimoku we will see where this Kumo cloud formed this wave.
If these conditions are met, a serious decision can be made to enter the position.
Higher time frames such as 30 minutes or 1 hour and 4 hours can also be used to find important resistance and support pivots.
In this way, the average of 233 and 21 and the formation of the current candlestick give us an acceptable range for fluctuation.
Chikou Support and Resistance by TheSocialCryptoClubName: Chikou Supports and Resistances
Category: Indicator
Timeframe: Any Timeframe.
Description: Chikou Support and Resistance is an indicator which allows to represent on the chart the price structures identified by the cusps formed by the Ichimoku Kinko Hyo Chikou, Chikou is the line chart of close price projected in the past as per Kijun periods.
Suggested usage: Use on any timeframe. It is possible to calculate cusp only in a certain period and in a different time frame, and select those calculated by specific lines.
Technical Details: Internally it uses an Array to store the levels of when the Chikou bounces using the Zig-Zag indicator. At the last bar it prints the various lines on the screen.
Credits:
- Techniques has been explained by Corrado Rondelli in "Strategie di trading con l’indicatore Ichimoku Kinko Hyo"
- It is based on the Zig-Zag indicator of TradingView to calculate the Zig-Zag.

Kijun Trend IndicatorName: Kijun Trend Indicator
Category: Trend Analysis
Timeframe: All timeframes
Suggested usage: In a trending market, to understand when it is good to enter short (red line) and when to enter long (blue line).
Technical Analysis: The original idea was taken from Larry Williams: an uptrend is identified when the price is above an 18-period simple moving average (SMA) and when at least two candles do not touch the simple moving average with their lows. The opposite is true for a downtrend.
Corrado Rondelli has therefore reinterpreted with Ichimoku aka "ichimokized" replacing the 18-period Simple Moving Average with the 26-period Kijun - as per the original Ichimoku settings.
In order to make the indicator more flexible an Exponential Moving Average (EMA) has also been added.
The indicator plots the chosen line that becomes red when it is good to enter short and blue when it is good to enter long.
Configuration:
- Length: period to be used to calculate the line.
- Type: the line type that can be the Kijun (26-period) or SMA/EMA (18-period)

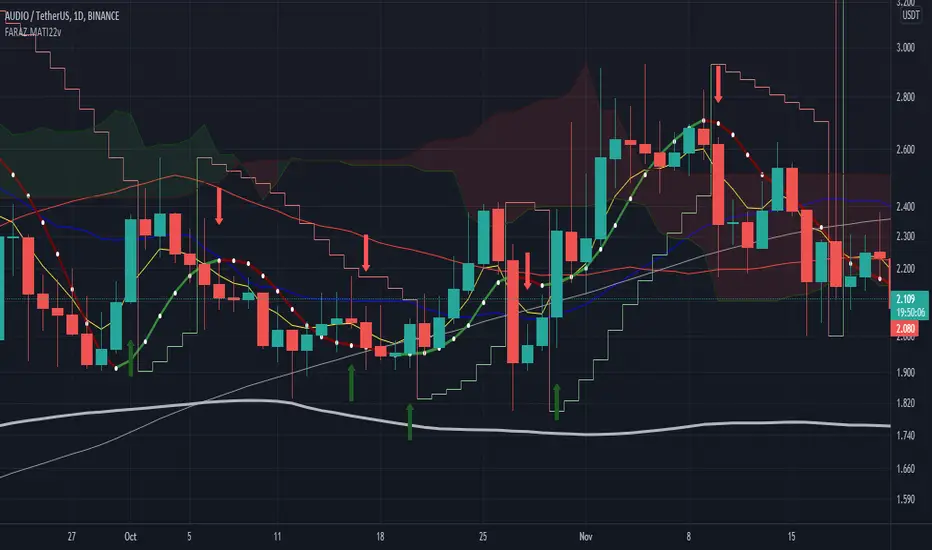
FARAZ.MATI20vA personal indicator.
This indicator has the following features :
Thanks to the managers and administrators of TradingView site for the appropriate space with wide facilities for optimal use. All (indicators) were available on the site and I only defined certain settings for them.
FARAZ.MATI20v
EMA: 5
SMA : 20
SMA : 50
Collision and interruption of Moving 20 by Moving 5 can be the beginning of an upward trend. Provided that the Moving 5 is placed under the candles. (The best signal for the Moving 5 is to collide with the Moving 20 under the candles). Also, the collision of the Moing 5 with the Moing 20 on top of the candles can be a sign of falling. Especially if this collision occurs above the candles.The cut of the Moving 20 and the Moving 50 indicate the intensity of the wave. If Moving 20 is above Moving 50 in this collision, it shows the intensity of the uptrend and if it is below Moving 50, it shows the intensity of the downtrend.
SMA : 100
SMA : 200
Both (resistance and support) are very strong, which is very effective in larger timeframes (such as 1 day).
HMA : 20
To determine the entry point. In such a way that whenever the seeds (HMA) are below the candlesticks. 3 seeds are in ascending position. The body of the candle and the shadow should not touch them. It can be a good signal to enter. Also if the seeds are placed on top of the candlesticks. Show the descending direction of 3 seeds. Provided that the body of the candle and the shadow have not hit them. It is a signal for the short position.
SAR : With the applied settings, it is a kind (trending view) that can evaluate the volume of input to any currency much sooner and determine the probability of rising or falling. If our wave lines (stairs) are at the bottom of the candles, it means an upward trend, and if they are at the top of the candles, it means a downward trend. As the volume of inputs increases, the trend increases, and as the volume of inputs decreases, the trend will also decrease.
Ichimoku Cloud : To determine the lines (support and resistance) the peaks formed by the cloud can represent a resistance area. Price To cross the area marked by the Ichimoku cloud must have a strong candle. This can be very effective in determining the point of entry and purchase.
zig zag : For better diagnosis of the process. Using it to determine areas of support and resistance can be useful. Determining the points of the Fibonacci table is also very effective.
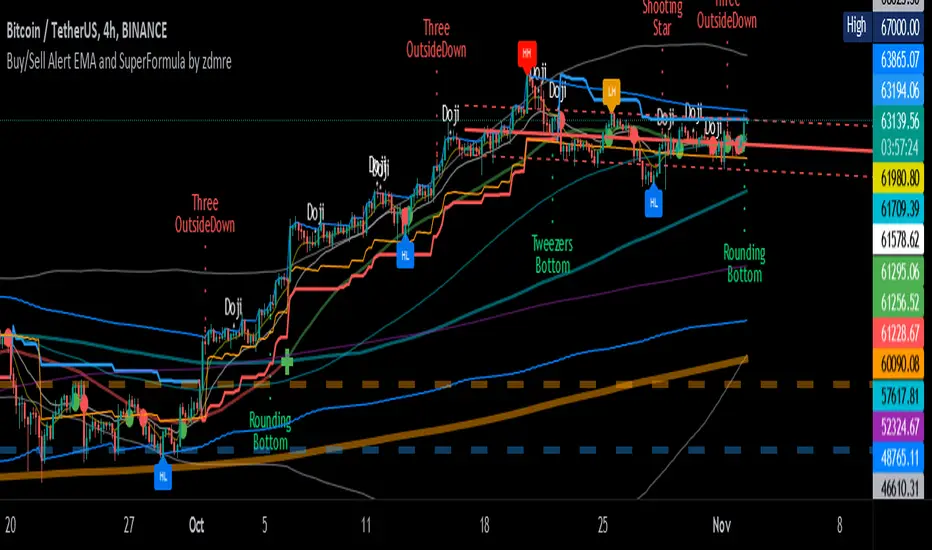
Buy/Sell Alert EMA with SuperFormula by zdmre*** Use it at your own risk
This indicator has 3 indicators and gives a buy/sell signal depending on the EMA.
3 indicators:
- Ichimoku
- Bollinger Band
- EMA
It also shows the value on the candle as a warning in the Buy and Sell signals. This value is calculated with a special formula I have created.
On the other hand Bollinger Band and Ichimoku Cloud are also included to check the accuracy of the signals.
For this indicator, I recommend a minimum of 4 hours chart.
Trend Indicators CollectionAnalyses MACD crosses with Ichimoku cloud direction and state
General idea:
- MACD crosses usually point to a change in trend direction and Kumo state and direction often act as a confirmation as well as a trend strength indicator. Using this, the script points out where there were was or can be a point where the trend change may have the strength to carry on.
Buy warnings:
- This warning will be triggered in two ways, both of them only if MACD is above EMA and the current close price is over Kumo:
- Senku span A crosses over Senku B (Kumo turns positive) when MACD is already positive
- MACD turns positive when Kumo is already positive
Sell warnings
- Triggered in two ways:
- Kumo turns negative when the current close price is bellow EMA
- The inverse of the above, the current close price falls bellow EMA when the Kumo is already negative
Trend Indicators Collection (TIC) contains:
- MACD, EMA, ADX, Mass index, Ichimoku Cloud, and Pivot points
- Best suited for monthly charts with 30m bars

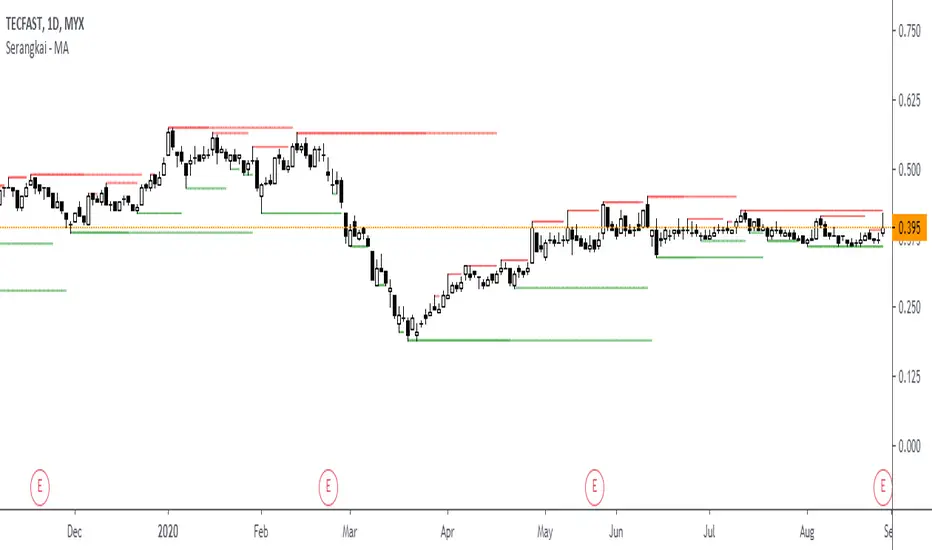
7-EMA 3-SMA BB_FiboR Icnimoke and SNRContains of:-
7 EMA
3 SMA
Bollinger Bands
Fibonacci Retracement
Ichimoku
Support and resistance
The idea is, my technique required to use EMA and SMA and bollinger band to monitor trend whether strong or not, then I use Fibonacci retracement to monitor how far it will drop or how far it will go up.
On the other method, I'm using EMA and SMA and Ichimoku to monitor counter that have midterm potential.
The SNR is to calculate my support and resistance which is when to EP, TP and CL. RBS signal is when the price break the resistance, which the price exceed the top of latest length of bar you set. SBR signal indicate where we need to cutloss, when the price lower than bottom of latest of bar you set
All in one indicator. Saves all number of indicator you need. Convenience for free user

MA 10,20,50,200Indicator consist of moving averages (MA).
This indicator make it easier for me to switch between few MA lines.
1. MA10
- used for intraday.
2. MA50 and Ichimoku
- to analyze swing trend
- display only MA50 and ichimoku cloud
3. MA20, MA50 and MA200
- to analyze the trend
- for swing trade
4. Lines 52 Week High / Low
- display both lines as guide when trading
IKAKOver2(LITE雲なし)
change point
I tried to make the operation lighter by removing the display of the Ichimoku balance table.
We have set a period such as EMA to use 5 minute bars and the first band is period 60 and 100 EMA . The color of the belt changes according to the position of the period 5EMA-25EMA-50EMA. The second sash is based on a 60- and 100-EMA period of 15 minutes. The change in the color of the obi is also a 15-minute specification.
Since the above period can be changed, I think that there are customs such as 1 hour and 4 hours.
Buying and selling signs are shown in green for buying and red for selling. (More frequent)
For the time being, it is also possible to display the Ichimoku balance table.
As for my usage method, when both the 15-minute and 5-minute bars have an uptrend (downtrend ), when each trading sign is confirmed, spread the limit just below the price. . (Because there is a commission in the market)
If the color of the obi becomes yellow, the trend may be over, so wait for the signature to reach the bundle of 15 minutes instead of 5 minutes, and after the signature is confirmed, it is the same as 5 minutes.
The loss cut line is often the latest low. Or when the obi is broken. .
I am still studying about profitability. Sometimes we use indicators, sometimes we reach the target horizon. I think each way is good.
It is a discretionary aid, and the head and tail are cut off, and the image is about 10 to 100 $.