Ichimoku Green BG by Pranojit DeyThis indicator shows ichimoku bulliush trend background so that the option buyers can understand bullish trend easily.
"ichimoku" için komut dosyalarını ara

Ichimoku Strict exit indicatorIndicator for ichimoku with exit
entry - when all cond meet
exit on base line

Ichimoku SentinelThis version of the Ichimoku Cloud features an alarm system helping you to catch entry and exit points and get warnings when you have to act to secure your profit.
Only relevant alerts will be triggered. For instance, if you're in a uptrend there will be alerts only when the Price crosses down Tenkan, not when crossing up.
Also, the frequent Tenkan-Kijun-Price-crossovers which occur when the price is hovering in the cloud will also not trigger alerts.
There is a warning alert when the price is approaching the cloud which is an early sign that the end of the trend is near.
You can define this warning distance to the cloud in the settings.
Conditions for long entry are the traditional triple:
- Price and Chikou-Sen above Cloud
- Chikou-Sen above Price
- Tenkan-Sen above Kijun-Sen
For Short Entries accordingly.
For Exit alerts you can chose between these options:
a) Price crosses Kijun (default)
b) Tenkan crosses Kijun
c) Price crosses Tenkan
Barcoloring : Green candles when above cloud (considered an uptrend), red when below (downtrend) and orange when within the warning distance from the cloud (consolidation)

Ichimoku Cloud OscillatorThe script looks at how far the price is below or above the ichimoku cloud, and publishes an oscillator.
Low or high oscillator values are indicative of reversals, to assist with long or short entry decisions.

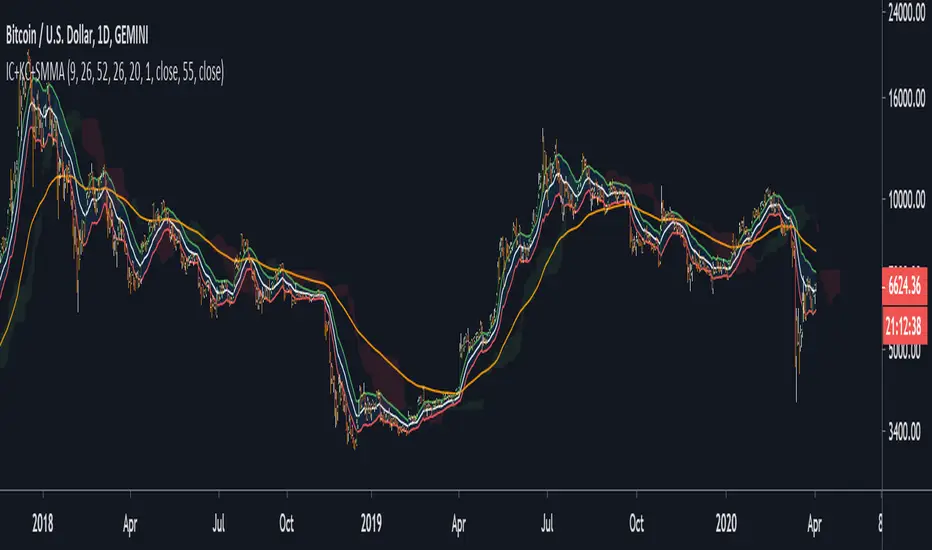
Ichimoku Cloud + keltner channel + SMMAa combo of
Ichimoku Cloud + keltner channel + SMMA
have fun, come up with your strategy
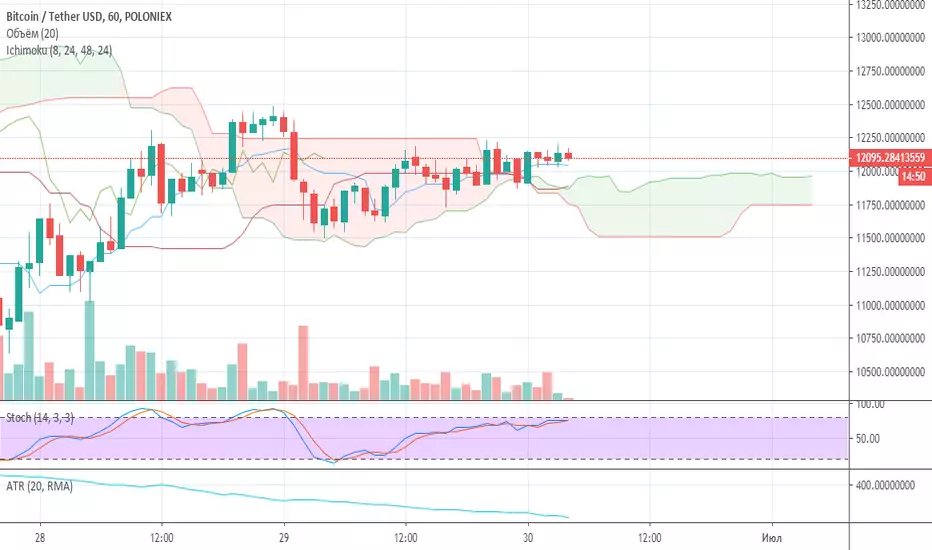
Ichimoku Cloud (for 1 hour period)Simple modification of standart Ichimoku Cloud indicator. Special for 1 hour period.
Ichimoku OverlaysHello!
Here is a script I wrote awhile ago. Basically the Ichmoku Overlays script takes the Ichimoku Cloud indicator and adds 4 timeframes to it.
Timeframes include multiples of 1, 3, 5, 10, 15. So basically if your interval timeframe is set to 1D you will see 1D, 3D, 5D, 10D, and 15D clouds. If you TF is set to 1m you will see 1m, 3m, 5m, 10m, 15m, etc.
The specific timeframe visibility can be set on/off in settings.
The purpose of this script is to show support/resistance zones in areas you might not see if you don't have the correct timeframe on.
Please feel free to PM me if you have any questions or suggestions!
Tips are welcome and can be sent to:
- BTC : 34dGv2EAxJ7HVpoAZHXg8RDKaX7KGCVUUW
- EOS : jwlondon1234
Enjoy!


Ichimoku Signal + Candle Color + Candle Pattern1. Ichimoku Signal:
Bullish Signal:
- UP-S: A strong bullish signal occurs when the Tenkan Sen crosses from below to above the Kijun Sen and the cross is above the Kumo.
- UP: An neutral bullish signal occurs when the Tenkan Sen crosses from below to above the Kijun Sen and the cross is in the Kumo.
- UP-W: A weak bullish signal occurs when the Tenkan Sen crosses from below to above the Kijun Sen and the cross is bellow the Kumo.
- Fly: A strong bullish signal when Chikou Span raise above the Kumo.
Bearish Signal:
- DN-S: A strong bearish signal occurs when the Tenkan Sen crosses from above to bellow the Kijun Sen and the cross is bellow the Kumo.
- DN: An neutral bearish signal occurs when the Tenkan Sen crosses from above to bellow the Kijun Sen and the cross is in the Kumo.
- DN-W: A weak bearish signal occurs when the Tenkan Sen crosses from above to bellow the Kijun Sen and the cross is above the Kumo.
- Dig: A strong bearish signal when Chikou Span fall bellow the Kumo.
2. Candle Color based on RSI (from NazcaProjections)
- Yellow represents Super OverBought
- Lime Green represents OverBought
- Green represents Slightly OverBought
- Red represents Slightly OverSold
- Dark Red represents OverSold
- Gray White represents Super OverSold
3. Candlestick Patterns Identified: Doji , Evening Star , Morning Star , Shooting Star , Hammer , Inverted Hammer , Bearish Harami, Bullish Harami, Bearish Engulfing , Bullish Engulfing


Ichimoku Cloud with Josh Olszewicz Crpyto Adjusted SettingsThis Ichimoku Cloud has the settings adjusted as described in Josh Olszewicz's Video here: www.youtube.com

SUPERTREND MIXED ICHI-DMI-DONCHIAN-VOL-GAP-HLBox@RLSUPERTREND MIXED ICHI-DMI-VOL-GAP-HLBox@RL
by RegisL76
This script is based on several trend indicators.
* ICHIMOKU (KINKO HYO)
* DMI (Directional Movement Index)
* SUPERTREND ICHIMOKU + SUPERTREND DMI
* DONCHIAN CANAL Optimized with Colored Bars
* HMA Hull
* Fair Value GAP
* VOLUME/ MA Volume
* PRICE / MA Price
* HHLL BOXES
All these indications are visible simultaneously on a single graph. A data table summarizes all the important information to make a good trade decision.
ICHIMOKU Indicator:
The ICHIMOKU indicator is visualized in the traditional way.
ICHIMOKU standard setting values are respected but modifiable. (Traditional defaults = .
An oriented visual symbol, near the last value, indicates the progression (Ascending, Descending or neutral) of the TENKAN-SEN and the KIJUN-SEN as well as the period used.
The CLOUD (KUMO) and the CHIKOU-SPAN are present and are essential for the complete analysis of the ICHIMOKU.
At the top of the graph are visually represented the crossings of the TENKAN and the KIJUN.
Vertical lines, accompanied by labels, make it possible to quickly visualize the particularities of the ICHIMOKU.
A line displays the current bar.
A line visualizes the end of the CLOUD (KUMO) which is shifted 25 bars into the future.
A line visualizes the end of the chikou-span, which is shifted 25 bars in the past.
DIRECTIONAL MOVEMENT INDEX (DMI) : Treated conventionally : DI+, DI-, ADX and associated with a SUPERTREND DMI.
A visual symbol at the bottom of the graph indicates DI+ and DI- crossings
A line of oriented and colored symbols (DMI Line) at the top of the chart indicates the direction and strength of the trend.
SUPERTREND ICHIMOKU + SUPERTREND DMI :
Trend following by SUPERTREND calculation.
DONCHIAN CHANNEL: Treated conventionally. (And optimized by colored bars when overshooting either up or down.
The lines, high and low of the last values of the channel are represented to quickly visualize the level of the RANGE.
SUPERTREND HMA (HULL) Treated conventionally.
The HMA line visually indicates, according to color and direction, the market trend.
A visual symbol at the bottom of the chart indicates opportunities to sell and buy.
VOLUME:
Calculation of the MOBILE AVERAGE of the volume with comparison of the volume compared to the moving average of the volume.
The indications are colored and commented according to the comparison.
PRICE: Calculation of the MOBILE AVERAGE of the price with comparison of the price compared to the moving average of the price.
The indications are colored and commented according to the comparison.
HHLL BOXES:
Visualizes in the form of a box, for a given period, the max high and min low values of the price.
The configuration allows taking into account the high and low wicks of the price or the opening and closing values.
FAIR VALUE GAP :
This indicator displays 'GAP' levels over the current time period and an optional higher time period.
The script takes into account the high/low values of the current bar and compares with the 2 previous bars.
The "gap" is generated from the lack of overlap between these bars. Bearish or bullish gaps are determined by whether the gap is above or below HmaPrice, as they tend to fill, and can be used as targets.
NOTE: FAIR VALUE GAP has no values displayed in the table and/or label.
Important information (DATA) relating to each indicator is displayed in real time in a table and/or a label.
Each information is commented and colored according to direction, value, comparison etc.
Each piece of information indicates the values of the current bar and the previous value (in "FULL" mode).
The other possible modes for viewing the table and/or the label allow a more synthetic view of the information ("CONDENSED" and "MINIMAL" modes).
In order not to overload the vision of the chart too much, the visualization box of the RANGE DONCHIAN, the vertical lines of the shifted marks of the ICHIMOKU, as well as the boxes of the HHLL Boxes indicator are only visualized intermittently (managed by an adjustable time delay ).
The "HISTORICAL INFO READING" configuration parameter set to zero (by default) makes it possible to read all the information of the current bar in progress (Bar #0). All other values allow to read the information of a historical bar. The value 1 reads the information of the bar preceding the current bar (-1). The value 10 makes it possible to read the information of the tenth bar behind (-10) compared to the current bar, etc.
At the bottom of the DATAS table and label, lights, red, green or white indicate quickly summarize the trend from the various indicators.
Each light represents the number of indicators with the same trend at a given time.
Green for a bullish trend, red for a bearish trend and white for a neutral trend.
The conditions for determining a trend are for each indicator:
SUPERTREND ICHIMOHU + DMI: the 2 Super trends together are either bullish or bearish.
Otherwise the signal is neutral.
DMI: 2 main conditions:
BULLISH if DI+ >= DI- and ADX >25.
BEARISH if DI+ < DI- and ADX >25.
NEUTRAL if the 2 conditions are not met.
ICHIMOKU: 3 main conditions:
BULLISH if PRICE above the cloud and TENKAN > KIJUN and GREEN CLOUD AHEAD.
BEARISH if PRICE below the cloud and TENKAN < KIJUN and RED CLOUD AHEAD.
The other additional conditions (Data) complete the analysis and are present for informational purposes of the trend and depend on the context.
DONCHIAN CHANNEL: 1 main condition:
BULLISH: the price has crossed above the HIGH DC line.
BEARISH: the price has gone below the LOW DC line.
NEUTRAL if the price is between the HIGH DC and LOW DC lines
The 2 other complementary conditions (Datas) complete the analysis:
HIGH DC and LOW DC are increasing, falling or stable.
SUPERTREND HMA HULL: The script determines several trend levels:
STRONG BUY, BUY, STRONG SELL, SELL AND NEUTRAL.
VOLUME: 3 trend levels:
VOLUME > MOVING AVERAGE,
VOLUME < MOVING AVERAGE,
VOLUME = MOVING AVERAGE.
PRICE: 3 trend levels:
PRICE > MOVING AVERAGE,
PRICE < MOVING AVERAGE,
PRICE = MOVING AVERAGE.
If you are using this indicator/strategy and you are satisfied with the results, you can possibly make a donation (a coffee, a pizza or more...) via paypal to: lebourg.regis@free.fr.
Thanks in advance !!!
Have good winning Trades.
**************************************************************************************************************************
SUPERTREND MIXED ICHI-DMI-VOL-GAP-HLBox@RL
by RegisL76
Ce script est basé sur plusieurs indicateurs de tendance.
* ICHIMOKU (KINKO HYO)
* DMI (Directional Movement Index)
* SUPERTREND ICHIMOKU + SUPERTREND DMI
* DONCHIAN CANAL Optimized with Colored Bars
* HMA Hull
* Fair Value GAP
* VOLUME/ MA Volume
* PRIX / MA Prix
* HHLL BOXES
Toutes ces indications sont visibles simultanément sur un seul et même graphique.
Un tableau de données récapitule toutes les informations importantes pour prendre une bonne décision de Trade.
I- Indicateur ICHIMOKU :
L’indicateur ICHIMOKU est visualisé de manière traditionnelle
Les valeurs de réglage standard ICHIMOKU sont respectées mais modifiables. (Valeurs traditionnelles par défaut =
Un symbole visuel orienté, à proximité de la dernière valeur, indique la progression (Montant, Descendant ou neutre) de la TENKAN-SEN et de la KIJUN-SEN ainsi que la période utilisée.
Le NUAGE (KUMO) et la CHIKOU-SPAN sont bien présents et sont primordiaux pour l'analyse complète de l'ICHIMOKU.
En haut du graphique sont représentés visuellement les croisements de la TENKAN et de la KIJUN.
Des lignes verticales, accompagnées d'étiquettes, permettent de visualiser rapidement les particularités de l'ICHIMOKU.
Une ligne visualise la barre en cours.
Une ligne visualise l'extrémité du NUAGE (KUMO) qui est décalé de 25 barres dans le futur.
Une ligne visualise l'extrémité de la chikou-span, qui est décalée de 25 barres dans le passé.
II-DIRECTIONAL MOVEMENT INDEX (DMI)
Traité de manière conventionnelle : DI+, DI-, ADX et associé à un SUPERTREND DMI
Un symbole visuel en bas du graphique indique les croisements DI+ et DI-
Une ligne de symboles orientés et colorés (DMI Line) en haut du graphique, indique la direction et la puissance de la tendance.
III SUPERTREND ICHIMOKU + SUPERTREND DMI
Suivi de tendance par calcul SUPERTREND
IV- DONCHIAN CANAL :
Traité de manière conventionnelle.
(Et optimisé par des barres colorées en cas de dépassement soit vers le haut, soit vers le bas.
Les lignes, haute et basse des dernières valeurs du canal sont représentées pour visualiser rapidement la fourchette du RANGE.
V- SUPERTREND HMA (HULL)
Traité de manière conventionnelle.
La ligne HMA indique visuellement, selon la couleur et l'orientation, la tendance du marché.
Un symbole visuel en bas du graphique indique les opportunités de vente et d'achat.
*VI VOLUME :
Calcul de la MOYENNE MOBILE du volume avec comparaison du volume par rapport à la moyenne mobile du volume.
Les indications sont colorées et commentées en fonction de la comparaison.
*VII PRIX :
Calcul de la MOYENNE MOBILE du prix avec comparaison du prix par rapport à la moyenne mobile du prix.
Les indications sont colorées et commentées en fonction de la comparaison.
*VIII HHLL BOXES :
Visualise sous forme de boite, pour une période donnée, les valeurs max hautes et min basses du prix.
La configuration permet de prendre en compte les mèches hautes et basses du prix ou bien les valeurs d'ouverture et de fermeture.
IX - FAIR VALUE GAP
Cet indicateur affiche les niveaux de 'GAP' sur la période temporelle actuelle ET une période temporelle facultative supérieure.
Le script prend en compte les valeurs haut/bas de la barre actuelle et compare avec les 2 barres précédentes.
Le "gap" est généré à partir du manque de recouvrement entre ces barres.
Les écarts baissiers ou haussiers sont déterminés selon que l'écart est supérieurs ou inférieur à HmaPrice, car ils ont tendance à être comblés, et peuvent être utilisés comme cibles.
NOTA : FAIR VALUE GAP n'a pas de valeurs affichées dans la table et/ou l'étiquette.
Les informations importantes (DATAS) relatives à chaque indicateur sont visualisées en temps réel dans une table et/ou une étiquette.
Chaque information est commentée et colorée en fonction de la direction, de la valeur, de la comparaison etc.
Chaque information indique la valeurs de la barre en cours et la valeur précédente ( en mode "COMPLET").
Les autres modes possibles pour visualiser la table et/ou l'étiquette, permettent une vue plus synthétique des informations (modes "CONDENSÉ" et "MINIMAL").
Afin de ne pas trop surcharger la vision du graphique, la boite de visualisation du RANGE DONCHIAN, les lignes verticales des marques décalées de l'ICHIMOKU, ainsi que les boites de l'indicateur HHLL Boxes ne sont visualisées que de manière intermittente (géré par une temporisation réglable ).
Le paramètre de configuration "HISTORICAL INFO READING" réglé sur zéro (par défaut) permet de lire toutes les informations de la barre actuelle en cours (Barre #0).
Toutes autres valeurs permet de lire les informations d'une barre historique. La valeur 1 permet de lire les informations de la barre précédant la barre en cours (-1).
La valeur 10 permet de lire les information de la dixième barre en arrière (-10) par rapport à la barre en cours, etc.
Dans le bas de la table et de l'étiquette de DATAS, des voyants, rouge, vert ou blanc indique de manière rapide la synthèse de la tendance issue des différents indicateurs.
Chaque voyant représente le nombre d'indicateur ayant la même tendance à un instant donné. Vert pour une tendance Bullish, rouge pour une tendance Bearish et blanc pour une tendance neutre.
Les conditions pour déterminer une tendance sont pour chaque indicateur :
SUPERTREND ICHIMOHU + DMI : les 2 Super trends sont ensemble soit bullish soit Bearish. Sinon le signal est neutre.
DMI : 2 conditions principales :
BULLISH si DI+ >= DI- et ADX >25.
BEARISH si DI+ < DI- et ADX >25.
NEUTRE si les 2 conditions ne sont pas remplies.
ICHIMOKU : 3 conditions principales :
BULLISH si PRIX au dessus du nuage et TENKAN > KIJUN et NUAGE VERT DEVANT.
BEARISH si PRIX en dessous du nuage et TENKAN < KIJUN et NUAGE ROUGE DEVANT.
Les autres conditions complémentaires (Datas) complètent l'analyse et sont présents à titre informatif de la tendance et dépendent du contexte.
CANAL DONCHIAN : 1 condition principale :
BULLISH : le prix est passé au dessus de la ligne HIGH DC.
BEARISH : le prix est passé au dessous de la ligne LOW DC.
NEUTRE si le prix se situe entre les lignes HIGH DC et LOW DC
Les 2 autres conditions complémentaires (Datas) complètent l'analyse : HIGH DC et LOW DC sont croissants, descendants ou stables.
SUPERTREND HMA HULL :
Le script détermine plusieurs niveaux de tendance :
STRONG BUY, BUY, STRONG SELL, SELL ET NEUTRE.
VOLUME : 3 niveaux de tendance :
VOLUME > MOYENNE MOBILE, VOLUME < MOYENNE MOBILE, VOLUME = MOYENNE MOBILE.
PRIX : 3 niveaux de tendance :
PRIX > MOYENNE MOBILE, PRIX < MOYENNE MOBILE, PRIX = MOYENNE MOBILE.
Si vous utilisez cet indicateur/ stratégie et que vous êtes satisfait des résultats,
vous pouvez éventuellement me faire un don (un café, une pizza ou plus ...) via paypal à : lebourg.regis@free.fr.
Merci d'avance !!!
Ayez de bons Trades gagnants.

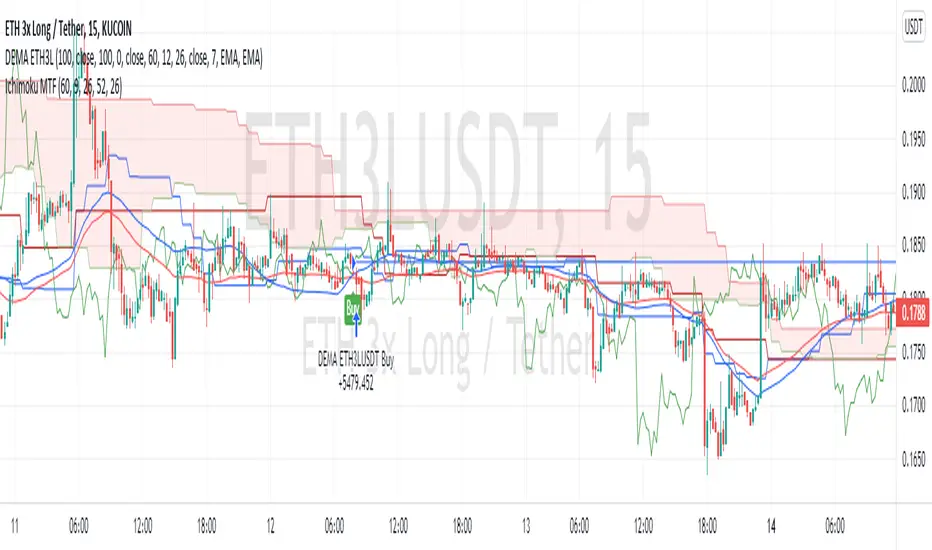
Kijun-sen Colored [aamonkey]I isolated the Kijun-sen from the Ichimoku Cloud and colored it.
You can do major damage by just entering when the price closes above the Kijun-sen and sell when it is the other way around.
Add some other confirmation indicators to filter some false breakouts and you are good to go.

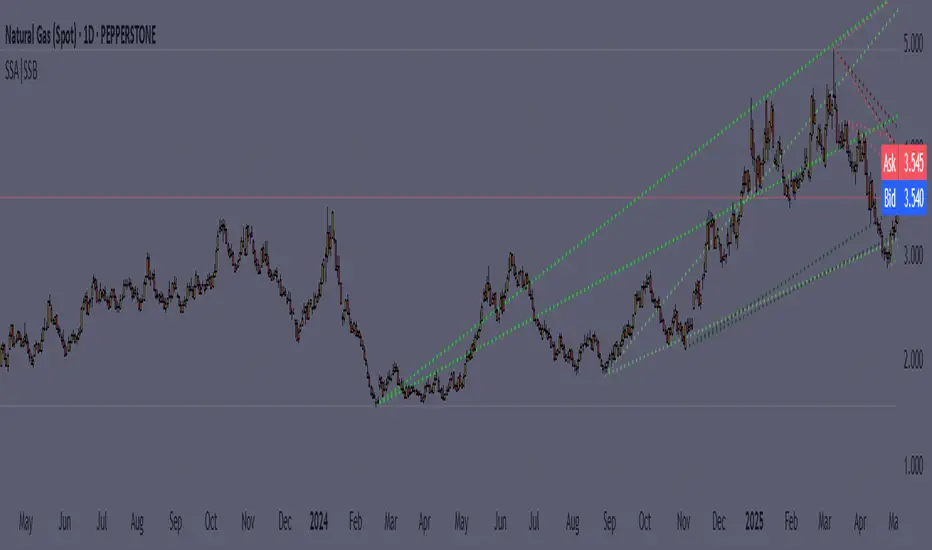
Dynamic Support|Resistance SSA & SSBHello, traders. I offer you an indicator to complement the Ichimoku Kinho Hyo trading system. This indicator determines possible dynamic resistance and support levels based on pivots and end points of the Senkou Span A and Senkou Span B lines.
You determine the pivots yourself, choosing how many bars back to look for HIGH and LOW.
Attention! Unlike the classical theory of Goichi Hosoda: the levels are dynamic, that is, they change values with each new bar!
Also added is the MTF function for displaying levels from different time frames.
Goichi Hosoda TheoryGreetings to traders. I offer you an indicator for trading according to the Ichimoku Kinho Hyo trading system. This indicator determines possible time cycles of price reversal and expected asset price values based on the theory of waves and time cycles by Goichi Hosoda.
The indicator contains classic price levels N, V, E and NT, and is supplemented with intermediate levels V+E, V+N, N+NT and x2, x3, x4 for levels V and E, which are used in cases where the wave does not contain corrections and there is no possibility to update the impulse-corrective wave.
A function for counting bars from points A B and C has also been added.

SuperIchi [LuxAlgo]Using one indicator as the core for another one to improve certain aspects while offering an alternative user interaction can be very interesting in technical analysis.
This indicator is a modification of the popular Ichimoku indicator using the equally popular Supertrend indicator as its core, thus no longer entirely relying on calculations done over a fixed window size but instead relying on the average true range and the trend detection method offered by the Supertrend.
Settings
Tenkan: Atr length (left) and factor (right) used for the Supertrend involved in the calculations of the Tenkan Ichimoku component
Kijun: Atr length (left) and factor (right) used for the Supertrend involved in the calculations of the Kijun Ichimoku component
Senkou Span B: Atr length (left) and factor (right) used for the Supertrend involved in the calculations of the second Senkou Span Ichimoku component
Displacement: Bar offset of the cloud (positive offset) and Chikou (negative offset)
Usage
The SuperIchi indicator can be interpreted similarly to a regular Ichimoku as it retains the components and aspects from this one. Users can make use of the Supertrend Factor to detect shorter or longer-term trends.
Unlike the regular components of the Ichimoku based on rolling maximums/minimums, using the Supertrend here allows smoother components and makes it less prone to whipsaw signals.
Note that the Chikou is disabled by default in the style settings
Details
The original Ichimoku indicator is constructed from the average between the rolling maximum high and minimum low values. The Supertrend indicator also relies on one upper/lower extremity but using the average of these extremities for the modification of the Ichimoku indicator might not provide easy to use results due to the nature of these extremities.
Instead, we compute the average between the Supertrend and trailing maximums/minimums with a value reset when a new trend is detected by the Supertrend. This allows obtaining a result that is closer to the original average used by Ichimoku.

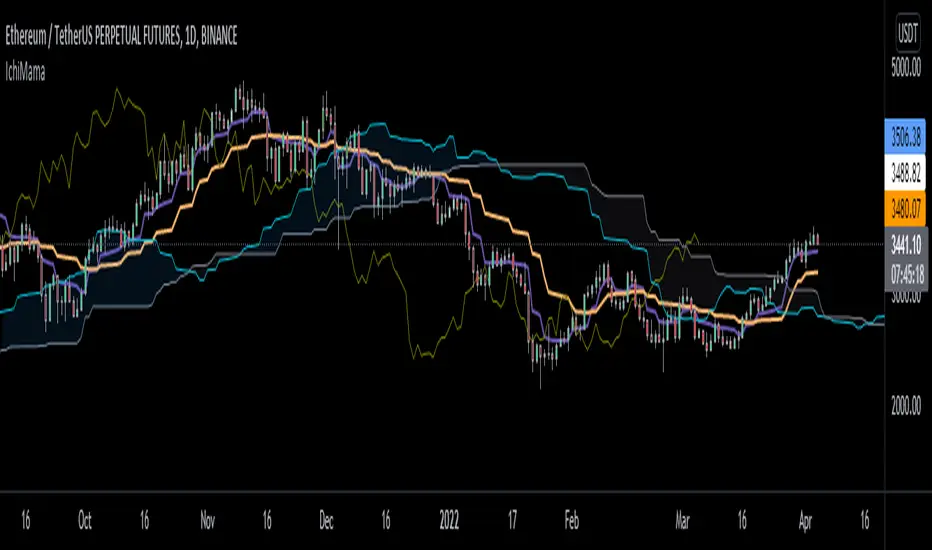
IchiMAMA (Experimental)Goichi Hosoda's "Ichimoku Kinkō Hyō" is a widely used Trend Following indicator and can be defined as a "system" rather than an indicator.
Published in the late 1960's, consisting of 5 lines.
TenkanSen (Conversion Line) = of the last 9 bars
KijunSen (Base Line) = of the last 26 bars
SenkouSpanA (Leading Span A) = Average of Tenkan&KijunSen shifted -> 26 bars
SenkouSpanB (Leading Span B) = of the last 52 bars
ChikouSpan (Lagging Span) = Price shifted <- 26 bars
On the other hand, Mesa Adaptive Moving Average developed by John Ehlers around early 2000's shows similarities with Hosoda's Tenkan and KijunSen using a different calculation method. For futher info: www.mesasoftware.com
I find MAMA superior to TenkanSen and KijunSen in terms of crossing signals.
Ichimoku:
Thus, decided to replace TenkanSen and KijunSen of regular Ichimoku with MAMA&FAMA of Ehlers and calculated SenkouSpanA accordingly. SenkouSpanB and ChikouSpan stays the same as per Ichimoku's logic. (Periods are 30 by default for cryptocurrencies. If stocks then 26)
IchiMAMA:
This is purely experimental and educational. Hope you'll like it :)
I'd like to thank @everget for MAMA&FAMA
and @KivancOzbilgic for Ichimoku Kinkō Hyō and Volume Based Colored Bars
VWAP + EMA9/21/50 + Ichimoku + RSI (M5) - Strict + TPSL//@version=5
indicator("VWAP + EMA9/21/50 + Ichimoku + RSI (M5) - Strict + TPSL", overlay=true, shorttitle="VWAP_EMA_ICH_RSI_TPSL")
// === Inputs ===
emaFastLen = input.int(9, "EMA Fast (9)")
emaMidLen = input.int(21, "EMA Mid (21)")
emaSlowLen = input.int(50, "EMA Slow (50)")
// Ichimoku inputs
tenkanLen = input.int(9, "Tenkan Sen Length")
kijunLen = input.int(26, "Kijun Sen Length")
senkouBLen = input.int(52, "Senkou B Length")
displacement = input.int(26, "Displacement")
// RSI
rsiLen = input.int(14, "RSI Length")
rsiThreshold = input.int(50, "RSI Threshold")
// VWAP option
useSessionVWAP = input.bool(true, "Use Session VWAP (true) / Daily VWAP (false)")
// Volume filter
useVolumeFilter = input.bool(true, "Enable Volume Filter")
volAvgLen = input.int(20, "Volume Avg Length")
volMultiplier = input.float(1.2, "Min Volume > avg *", step=0.1)
// Higher timeframe trend check
useHTF = input.bool(true, "Enable Higher-Timeframe Trend Check")
htfTF = input.string("60", "HTF timeframe (e.g. 60, 240, D)")
// Alerts / webhook
alertOn = input.bool(true, "Enable Alerts")
useWebhook = input.bool(true, "Send webhook on alerts")
webhookURL = input.string("", "Webhook URL (leave blank to set in alert)")
// TP/SL & Trailing inputs
useTP = input.bool(true, "Enable Take Profit (TP)")
tpTypeRR = input.bool(true, "TP as Risk-Reward ratio (true) / Fixed points (false)")
tpRR = input.float(1.5, "TP RR (e.g. 1.5)", step=0.1)
fixedTPpts = input.float(40.0, "Fixed TP (ticks/pips) if not RR")
useSL = input.bool(true, "Enable Stop Loss (SL)")
slTypeATR = input.bool(true, "SL as ATR-based (true) / Fixed points (false)")
atrLen = input.int(14, "ATR Length")
atrMult = input.float(1.5, "ATR Multiplier for SL", step=0.1)
fixedSLpts = input.float(20.0, "Fixed SL (ticks/pips) if not ATR")
useTrailing = input.bool(true, "Enable Trailing Stop")
trailType = input.string("ATR", "Trailing type: ATR or EMA", options= ) // "ATR" or "EMA"
trailATRmult = input.float(1.0, "Trailing ATR Multiplier", step=0.1)
trailEMAlen = input.int(9, "Trailing EMA Length (if EMA chosen)")
trailLockInPts = input.float(5.0, "Trail lock-in (min profit before trail active, pts)")
// Other
showArrows = input.bool(true, "Show Entry Arrows")
// === Calculations ===
ema9 = ta.ema(close, emaFastLen)
ema21 = ta.ema(close, emaMidLen)
ema50 = ta.ema(close, emaSlowLen)
// VWAP
vwapVal = ta.vwap
// Ichimoku
highestHighTenkan = ta.highest(high, tenkanLen)
lowestLowTenkan = ta.lowest(low, tenkanLen)
tenkan = (highestHighTenkan + lowestLowTenkan) / 2
highestHighKijun = ta.highest(high, kijunLen)
lowestLowKijun = ta.lowest(low, kijunLen)
kijun = (highestHighKijun + lowestLowKijun) / 2
highestHighSenkouB = ta.highest(high, senkouBLen)
lowestLowSenkouB = ta.lowest(low, senkouBLen)
senkouB = (highestHighSenkouB + lowestLowSenkouB) / 2
senkouA = (tenkan + kijun) / 2
// RSI
rsi = ta.rsi(close, rsiLen)
// Volume
volAvg = ta.sma(volume, volAvgLen)
volOk = not useVolumeFilter or (volume > volAvg * volMultiplier)
// Higher timeframe trend values
htf_close = request.security(syminfo.tickerid, htfTF, close)
htf_ema50 = request.security(syminfo.tickerid, htfTF, ta.ema(close, emaSlowLen))
htf_rsi = request.security(syminfo.tickerid, htfTF, ta.rsi(close, rsiLen))
htf_bull = htf_close > htf_ema50
htf_bear = htf_close < htf_ema50
htf_ok = not useHTF or (htf_bull and close > ema50) or (htf_bear and close < ema50)
// Trend filters (on current timeframe)
priceAboveVWAP = close > vwapVal
priceAboveEMA50 = close > ema50
priceAboveCloud = close > senkouA and close > senkouB
bullTrend = priceAboveVWAP and priceAboveEMA50 and priceAboveCloud
bearTrend = not priceAboveVWAP and not priceAboveEMA50 and not priceAboveCloud
// Pullback detection (price near EMA21 within tolerance)
tolPerc = input.float(0.35, "Pullback tolerance (%)", step=0.05) / 100.0
nearEMA21 = math.abs(close - ema21) <= ema21 * tolPerc
// Entry conditions
emaCrossUp = ta.crossover(ema9, ema21)
emaCrossDown = ta.crossunder(ema9, ema21)
longConditionBasic = bullTrend and (nearEMA21 or close >= vwapVal) and emaCrossUp and rsi > rsiThreshold
shortConditionBasic = bearTrend and (nearEMA21 or close <= vwapVal) and emaCrossDown and rsi < rsiThreshold
longCondition = longConditionBasic and volOk and htf_ok and (not useHTF or htf_bull) and (rsi > rsiThreshold)
shortCondition = shortConditionBasic and volOk and htf_ok and (not useHTF or htf_bear) and (rsi < rsiThreshold)
// More strict: require Tenkan > Kijun for bull and Tenkan < Kijun for bear
ichimokuAlign = (tenkan > kijun) ? 1 : (tenkan < kijun ? -1 : 0)
longCondition := longCondition and (ichimokuAlign == 1)
shortCondition := shortCondition and (ichimokuAlign == -1)
// ATR for SL / trailing
atr = ta.atr(atrLen)
// --- Trade management state variables ---
var float activeLongEntry = na
var float activeShortEntry = na
var float activeLongSL = na
var float activeShortSL = na
var float activeLongTP = na
var float activeShortTP = na
var float activeLongTrail = na
var float activeShortTrail = na
// Function to convert fixed points to price (assumes chart in points as price units)
fixedToPriceLong(p) => p
fixedToPriceShort(p) => p
// On signal, set entry, SL and TP
if longCondition
activeLongEntry := close
// SL
if useSL
if slTypeATR
activeLongSL := close - atr * atrMult
else
activeLongSL := close - fixedToPriceLong(fixedSLpts)
else
activeLongSL := na
// TP
if useTP
if tpTypeRR and useSL and not na(activeLongSL)
risk = activeLongEntry - activeLongSL
activeLongTP := activeLongEntry + risk * tpRR
else
activeLongTP := activeLongEntry + fixedToPriceLong(fixedTPpts)
else
activeLongTP := na
// reset short
activeShortEntry := na
activeShortSL := na
activeShortTP := na
// init trailing
activeLongTrail := activeLongSL
if shortCondition
activeShortEntry := close
if useSL
if slTypeATR
activeShortSL := close + atr * atrMult
else
activeShortSL := close + fixedToPriceShort(fixedSLpts)
else
activeShortSL := na
if useTP
if tpTypeRR and useSL and not na(activeShortSL)
riskS = activeShortSL - activeShortEntry
activeShortTP := activeShortEntry - riskS * tpRR
else
activeShortTP := activeShortEntry - fixedToPriceShort(fixedTPpts)
else
activeShortTP := na
// reset long
activeLongEntry := na
activeLongSL := na
activeLongTP := na
// init trailing
activeShortTrail := activeShortSL
// Trailing logic (update only when in profit beyond 'lock-in')
if not na(activeLongEntry) and useTrailing
// current unrealized profit in points
currProfitPts = close - activeLongEntry
if currProfitPts >= trailLockInPts
// declare candidate before use to avoid undeclared identifier errors
float candidate = na
if trailType == "ATR"
candidate := close - atr * trailATRmult
else
candidate := close - ta.ema(close, trailEMAlen)
// move trail stop up but never below initial SL
activeLongTrail := math.max(nz(activeLongTrail, activeLongSL), candidate)
// ensure trail never goes below initial SL if SL exists
if useSL and not na(activeLongSL)
activeLongTrail := math.max(activeLongTrail, activeLongSL)
// update SL to trailing
activeLongSL := activeLongTrail
if not na(activeShortEntry) and useTrailing
currProfitPtsS = activeShortEntry - close
if currProfitPtsS >= trailLockInPts
// declare candidateS before use
float candidateS = na
if trailType == "ATR"
candidateS := close + atr * trailATRmult
else
candidateS := close + ta.ema(close, trailEMAlen)
activeShortTrail := math.min(nz(activeShortTrail, activeShortSL), candidateS)
if useSL and not na(activeShortSL)
activeShortTrail := math.min(activeShortTrail, activeShortSL)
activeShortSL := activeShortTrail
// Detect TP/SL hits (for plotting & alerts)
longTPHit = not na(activeLongTP) and close >= activeLongTP
longSLHit = not na(activeLongSL) and close <= activeLongSL
shortTPHit = not na(activeShortTP) and close <= activeShortTP
shortSLHit = not na(activeShortSL) and close >= activeShortSL
if longTPHit or longSLHit
// reset long state after hit
activeLongEntry := na
activeLongSL := na
activeLongTP := na
activeLongTrail := na
if shortTPHit or shortSLHit
activeShortEntry := na
activeShortSL := na
activeShortTP := na
activeShortTrail := na
// Plot EMAs
p_ema9 = plot(ema9, title="EMA9", linewidth=1)
plot(ema21, title="EMA21", linewidth=1)
plot(ema50, title="EMA50", linewidth=2)
// Plot VWAP
plot(vwapVal, title="VWAP", linewidth=2, style=plot.style_line)
// Plot Ichimoku lines (Tenkan & Kijun)
plot(tenkan, title="Tenkan", linewidth=1)
plot(kijun, title="Kijun", linewidth=1)
// Plot cloud (senkouA & senkouB shifted forward)
plot(senkouA, title="Senkou A", offset=displacement, transp=60)
plot(senkouB, title="Senkou B", offset=displacement, transp=60)
fill(plot(senkouA, offset=displacement), plot(senkouB, offset=displacement), color = senkouA > senkouB ? color.new(color.green, 80) : color.new(color.red, 80))
// Plot active trade lines
plotshape(not na(activeLongEntry), title="Active Long", location=location.belowbar, color=color.new(color.green, 0), style=shape.circle, size=size.tiny)
plotshape(not na(activeShortEntry), title="Active Short", location=location.abovebar, color=color.new(color.red, 0), style=shape.circle, size=size.tiny)
plot(activeLongSL, title="Long SL", color=color.red, linewidth=2)
plot(activeLongTP, title="Long TP", color=color.green, linewidth=2)
plot(activeShortSL, title="Short SL", color=color.red, linewidth=2)
plot(activeShortTP, title="Short TP", color=color.green, linewidth=2)
// Arrows / labels
if showArrows
if longCondition
label.new(bar_index, low, "BUY", style=label.style_label_up, color=color.green, textcolor=color.white, size=size.small)
if shortCondition
label.new(bar_index, high, "SELL", style=label.style_label_down, color=color.red, textcolor=color.white, size=size.small)
// Alerts
// alertcondition must be declared in global scope so TradingView can create alerts from them
alertcondition(longCondition, "VWAP+EMA+Ichimoku+RSI — BUY (STRICT)", "BUY signal from VWAP+EMA+Ichimoku+RSI (STRICT)")
alertcondition(shortCondition, "VWAP+EMA+Ichimoku+RSI — SELL (STRICT)", "SELL signal from VWAP+EMA+Ichimoku+RSI (STRICT)")
// Runtime alerts (still use alert() to trigger immediate alerts; webhook is added in TradingView Alert dialog)
if alertOn
if longCondition
alert("VWAP+EMA+Ichimoku+RSI — BUY (STRICT)", alert.freq_once_per_bar_close)
if shortCondition
alert("VWAP+EMA+Ichimoku+RSI — SELL (STRICT)", alert.freq_once_per_bar_close)
// Alerts for TP/SL hits
if longTPHit
alert("LONG TP HIT", alert.freq_once_per_bar_close)
if longSLHit
alert("LONG SL HIT", alert.freq_once_per_bar_close)
if shortTPHit
alert("SHORT TP HIT", alert.freq_once_per_bar_close)
if shortSLHit
alert("SHORT SL HIT", alert.freq_once_per_bar_close)
// Info table
var table info = table.new(position.top_right, 1, 8)
if barstate.islast
table.cell(info, 0, 0, text = 'Trend: ' + (bullTrend ? 'Bull' : bearTrend ? 'Bear' : 'Neutral'))
table.cell(info, 0, 1, text = 'EMA9/21/50: ' + str.tostring(ema9, format.mintick) + ' / ' + str.tostring(ema21, format.mintick) + ' / ' + str.tostring(ema50, format.mintick))
table.cell(info, 0, 2, text = 'VWAP: ' + str.tostring(vwapVal, format.mintick))
table.cell(info, 0, 3, text = 'RSI: ' + str.tostring(rsi, format.mintick))
table.cell(info, 0, 4, text = 'Vol OK: ' + (volOk ? 'Yes' : 'No'))
table.cell(info, 0, 5, text = 'HTF: ' + htfTF + ' ' + (htf_bull ? 'Bull' : htf_bear ? 'Bear' : 'Neutral'))
table.cell(info, 0, 6, text = 'ActiveLong: ' + (not na(activeLongEntry) ? 'Yes' : 'No'))
table.cell(info, 0, 7, text = 'ActiveShort: ' + (not na(activeShortEntry) ? 'Yes' : 'No'))
// End of script

Chiko-Span Momentum_PineScript_Version5This is Momentum indicator based on "Chiko-span" of Ichimoku Kinko-Hyo.
Differ from normal momentum indicator, this indicator is using "close" and "open" as default parameter which is based on 9 week-candle chart Invented by Ichimoku-Sanjin. And, It is located 26 period before to match chiko-span.
(Parameters can change as you like)
The usage is same as normal momentum indicator so please check momentum indicator usage. However, due to use this indicator, it may support to compare momentum of chiko-span movement and to predict effect 5 lines of ichimoku.
For example, when price break out tenkan-sen, you can measure slope or period of chiko-span momentum and compare previously chiko-span momentum. If momentum is stronger than previously price, we can think that price try to out kijun- sen, touch cloud or break out cloud.
I wish, this indicator helps ichimoku users.
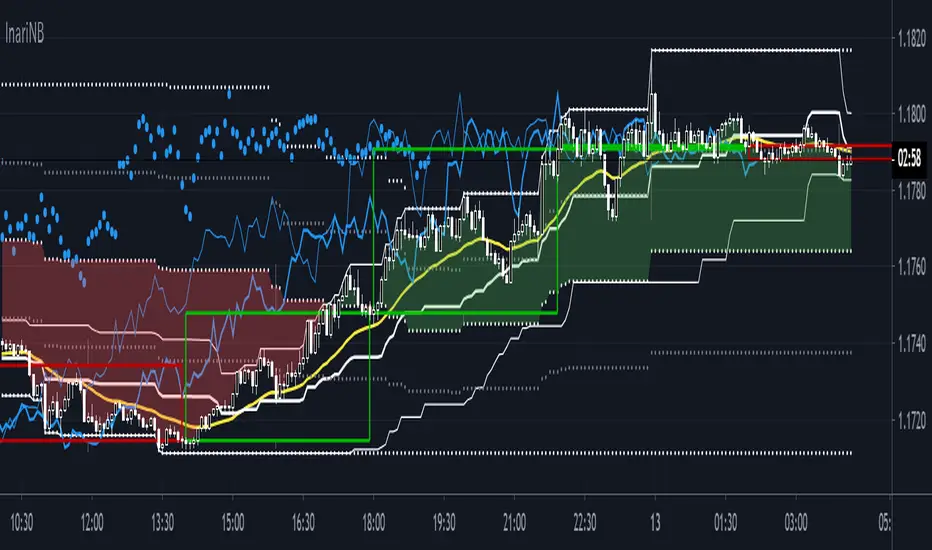
InariN BasicInariN is original work by N jijii.
I think InariN is modern interpretation of Ichimoku Cloud.
Please read script "InariN simple" for basic usage.
Multi time flame candles in this script is great work Candlestick Plot MTF by mortdiggiddy.
Supplementary explanation :
N jijii decided basic numbers as Ichimoku.
"I" first swing is 9. Only first swing is 9 because all numbers is consisted of nine numbers except start point 0 (his philosophy).
The second and subsequent is 8 because tangent point of previous swing is not counted (his philosophy).
"V" second swing is 9 + 8 = 17. "N" third swing is 9 + 8 + 8 = 25.
"N N = N2" is 25 +24 = 49. "N4" is 97. "N9"is 217.
He used basic numbers for parameters.
I think his idea is unique but the important point is this basic numbers are about popular numbers traders usually use and we can use as the same.
N2 and N9 spans is slightly difficult to use (Ichimoku lagging span).
Basically N span is used to measure Time Retracement and momentum.
If you want to practice Time Retracement , please check script "Ichimoku Time Retracement".
Enjoy!!