"daily" için komut dosyalarını ara
Daily Levels [cryptalent]Daily High / Low / Mid / Open Levels is a session-based reference indicator designed to visualize key daily price levels directly on the chart.
This indicator automatically plots the Daily High, Daily Low, Daily Midpoint (High + Low / 2), and Daily Open as horizontal lines for each trading day. These levels help traders quickly identify important structural prices where liquidity, reactions, or acceptance often occur.
Key Features
Automatic Daily Levels
Plots Daily High (H), Low (L), Mid (M), and Open (O) using higher-timeframe daily data.
Levels update in real time as the current day develops.
Multi-Day History
Displays daily levels for a configurable number of past days.
Older levels are automatically removed to keep the chart clean.
Line Extension
Current day levels can be extended forward by a user-defined number of bars.
Useful for projecting intraday reaction zones and liquidity targets.
Visual Customization
Independent line width and color settings for each level.
Mid level is shown as a dashed line for quick visual distinction.
Labels & Price Tags
Optional letter labels (H / L / M / O) displayed near the extended levels.
Optional price labels showing the exact level values on the right side of the chart.
Labels update dynamically and only display for the active trading day.
Performance-Oriented Design
Efficient line and label management using arrays.
Automatically cleans up unused objects to stay within TradingView limits.
Use Cases
Identifying intraday support and resistance
Tracking daily range behavior
Monitoring mean reversion vs. range expansion
Aligning intraday execution with higher-timeframe structure
This indicator is particularly useful for traders who rely on market structure, session behavior, and objective price references rather than subjective trend lines.

Daily Weekly Monthly Highs & Lows [Dova Lazarus]Daily Weekly Monthly Highs & Lows
📊 Overview
This Pine Script indicator displays key support and resistance levels by plotting the highs and lows from Daily, Weekly, and Monthly timeframes on your current chart. It's designed as an educational tool to help traders understand multi-timeframe analysis and identify significant price levels.
🎯 Key Features
Multi-Timeframe Support & Resistance
- Daily Levels: Shows previous daily highs and lows
- Weekly Levels: Displays weekly highs and lows
- Monthly Levels: Plots monthly highs and lows
- Smart Display: Only shows relevant timeframes based on your current chart timeframe
Fully Customizable Appearance
- Individual Colors: Set unique colors for each timeframe
- Line Styles: Choose between Solid, Dashed, or Dotted lines
- Line Width: Adjust thickness from 1-4 pixels
- Lookback Periods: Control how many historical levels to display
User-Friendly Options
- Enable/Disable: Toggle any timeframe on/off
- Line Extension: Option to extend lines into the future
- Clean Interface: Organized settings groups for easy configuration
🔧 Settings
Timeframes Group
- Show Daily/Weekly/Monthly Levels: Enable or disable each timeframe
- Lookback Periods: Number of historical levels to display (1-10)
Line Settings Group
- Color: Choose custom colors for each timeframe
- Style: Select line appearance (Solid/Dashed/Dotted)
- Width: Set line thickness (1-4 pixels)
Display Options Group
- Extend Lines Forward: Project lines 20 bars into the future
📈 How to Use
1. Add to Chart: Apply the indicator to any timeframe chart
2. Configure Timeframes: Enable the timeframes you want to see
3. Customize Appearance: Set colors and line styles for easy identification
4. Identify Levels: Use the plotted levels as potential support/resistance zones
5. Plan Trades: Look for price reactions at these key levels
💡 Trading Applications
- Support & Resistance: Identify key price levels where reversals may occur
- Entry Points: Look for bounces or breaks at these levels
- Stop Loss Placement: Use levels to set logical stop losses
- Target Setting: Previous highs/lows can serve as profit targets
- Multi-Timeframe Analysis: Understand the bigger picture context
🎓 Educational Value
This indicator is perfect for:
- Learning Pine Script: Clean, well-commented code structure
- Understanding Multi-Timeframe Analysis: See how different timeframes interact
- Practicing Technical Analysis: Identify key support/resistance concepts
- Code Study: Full variable names and detailed comments for learning
⚙️ Technical Details
- Version: Pine Script v6
- Overlay: True (plots directly on price chart)
- Max Lines: 500 (handles multiple timeframes efficiently)
- Compatibility: Works on all timeframes (shows relevant levels only)
🔍 What Makes This Different
- Educational Focus: Designed for learning with clear code structure
- Simplified Interface: Easy-to-use settings without overwhelming options
- Visual Clarity: Clean line display with customizable appearance
- Practical Application: Real trading tool, not just a demonstration
📋 Requirements
- TradingView account (any plan)
- Basic understanding of support/resistance concepts
- Any chart timeframe (indicator adapts automatically)
🚀 Quick Start
1. Add indicator to your chart
2. Default settings work great out of the box
3. Customize colors if desired (Green=Daily, Orange=Weekly, Red=Monthly)
4. Watch for price reactions at the plotted levels
5. Use as part of your technical analysis toolkit
---
*This indicator is designed as an educational tool and should be used in conjunction with other forms of analysis. Past performance does not guarantee future results.*

Daily/Weekly/Monthly LevelsDaily/Weekly/Monthly Levels
TLDR
Shows Daily/Weekly/Monthly reversal levels. These can act as support/resistance levels.
Can only see what's in your candle history. I.e. It won't see old monthlies on your 1m chart! Use Daily to see everything with the most history.
Can only see levels higher than or equal to your current time frame. I.e. it will not see daily levels if you're looking at a weekly chart.
Doesn't keep levels that have been closed through. Does keep levels that have been only wicked.
This indicator shows you daily, weekly and monthly horizontal reversal levels to save you the hassle of doing it yourself. It's a little aid to speed up your TA routine.
Usage Details and Limitations
All daily, weekly, and monthly levels will be marked with lines on the chart automatically. Levels will only be visible from that level's TF or lower, i.e. you can't see the daily levels from the weekly chart, but you can see all levels from daily or lower charts. No levels will be displayed if you select a time frame higher than 1 month.
New levels will not be drawn if they are very close to existing levels. You can change the 'closeness' threshold in settings. It is specified as a percentage move from the existing level.
However, higher TF levels will REPLACE lower TF levels if they are too close. If you set the 'closeness' setting to 0, all levels will be drawn.
Levels will only be drawn if they are in your displayed candle range! I.e. the lower you go in timeframe, the less history you can see, and so levels originating from further back might be missed!
One technique you might have is to load up the daily timeframe and use that to mark any nearby levels of interest.
How does it work?
Basically, it looks for reversal candles on the D/W/M Timeframes, and draws a line for you from the open of the reversal candle (of that TF), so long as you are on a TF equal or lower than that level.
New bars on that TF that close through that TF's old levels will clear that level. Wicks do not clear.
Each newly found level will not be drawn if it's within the percentage distance of an existing level of equal or higher time frame.
Each new level also checks for existing levels on lower TFs that it can replace. E.g. if a monthly bar closes and produces a monthly level equal to an existing daily or weekly level, that daily or weekly level will be replaced. Use the settings to specify your 'closeness' allowance.
Please remember, it can only see as far back as your candle history, so you won't see old monthlies on a 1 minute chart! Use the daily TF to see all three levels at once with maximum history.

daily bias @ttrades x joshuuuDaily bias is one of the most powerful tools when it comes to intraday trading.
Ttrades published a youtube video, in which he showcases his mechanical way of determing the daily bias based on ICTs and the MMXM Traders Teachings.
This indicator is based on those concepts.
The rules for this indicator are simple.
scenario 1 - first line of table
Close above previous days high gives a bullish bias.
Close below previous days low gives a bearish bias.
scenario 2 - second line of the table
Wick below previous days low and close within previous days body or above gives a bullish bias.
Wick above previous days high and close within previous days body or below gives a bearish bias.
"Bullish" bias is valid until previous daily high (pdh) is reached.
"Bearish" bias is valid until previous daily low (pdl) is reached.
If none of the above mentioned conditions is met OR the target (pdh/pdl) is reached, the bias is set to "Neutral".
On the daily timeframe, probabilities are visible on the table to reach pdh when the bias is "Bullish" or to reach pdl when the bias is "Bearish".
If the bias is bullish, the ideal buy would be below ny midnights opening price.
If the bias is bearish, the ideal sell would be above the ny midnights opening price.

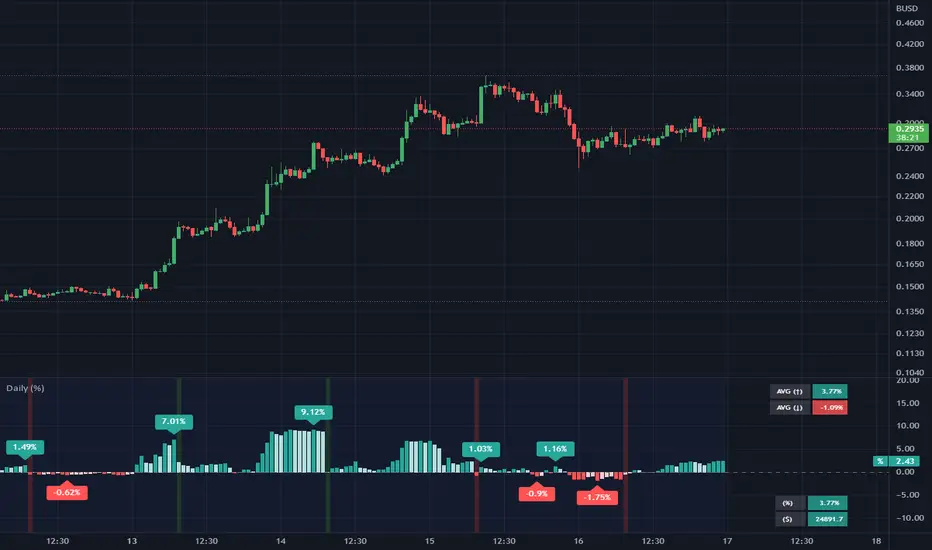
Daily (%) - Percentage Above / Below Daily [HODLER]It is a common observation in the world of cryptocurrency that the prices of most digital currencies tend to follow the price movements of Bitcoin. This means that when the price of Bitcoin increases, the prices of other cryptocurrencies usually increase as well, and when the price of Bitcoin decreases, the prices of other cryptocurrencies also tend to decrease, particularly when Bitcoin is near its daily level.
Of course, this is not unique to Bitcoin but also occurs with stocks. You can use this indicator on any asset you choose. Simply select the asset you want to track in the indicator's settings.
In the example chart, you can see CFXBUSD on a 45-minute timeframe chart with the indicator displayed below that tracks Bitcoin on a daily timeframe, as bitcoin was set as the asset in the settings of the indicator. In the lower right corner of the indicator, it will display the price of the asset "Bitcoin" and the percentage by which it is either above or below the daily price (which is calculated in the same way as on the TradingView watchlist).
This indicator can be very useful when trading other assets to closely monitor Bitcoin's (or any other chosen) activity. You can use it to check if the price is above the daily close and if it closed higher or lower than the last bar. Additionally, you can check if it closed above certain moving averages.
A useful feature of this indicator is that you can set an offset percentage for your visuals to adjust for whether the asset is up or down.
However, it is important to note that not all cryptocurrencies are directly correlated with Bitcoin's price movements, and some may even have unique factors that can cause them to behave differently in the market.
If you have any questions or suggestions regarding this indicator, I would greatly appreciate it if you could let me know in the comments.
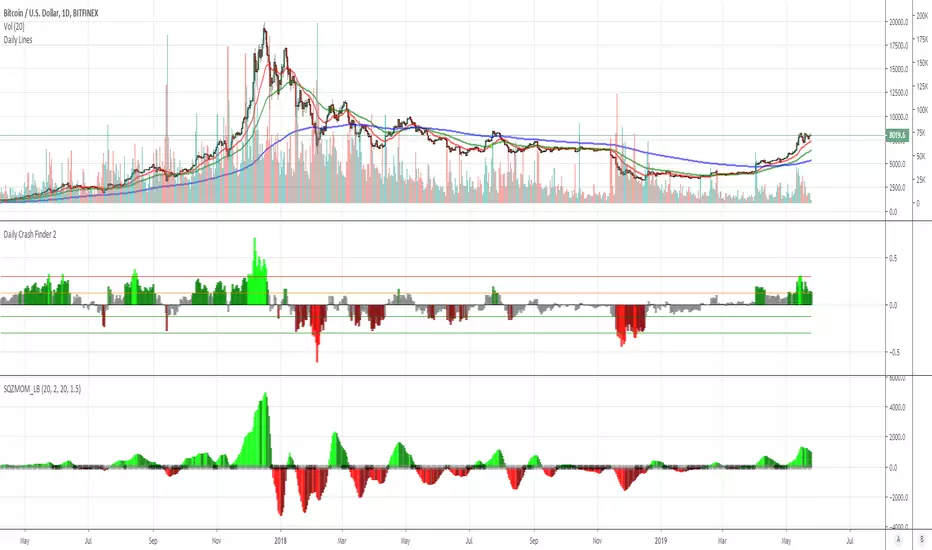
Daily Crash Finder 2this indicator shows buy and sell point for long time and works only daily period.
gray->notr
lime -> sell
green -> sell more
maroon -> buy
red -> buy more
Daily DeviationShows you the normal deviation from the OPEN based upon historical data.
Levels measured:
Normal range (1 standard deviation) of the CLOSE (vs the OPEN).
Normal daily HIGH +1, +2, +3, and +4 standard deviations.
Normal daily LOW -1, -2, -3, and -4 standard deviations.
Configuration:
Always shows you the normal CLOSE vs OPEN range for the current session.
Can display previous day's ranges (extra days) based upon the calendar (not trading days).
Normally displays which levels have been exceeded (to reduce noise and keep auto-scale to a minimum), but can show all the ranges for the current session.
The default number of days to measure (50) will affect the accuracy but outliers are cleaned to avoid dramatic variance.
Note:
These are only statistical representations of what has occurred in the past. You can interpret the current price as oversold or overbought for the day (and only that day) relative to the OPEN. Gaps high or low are not considered in the equation.

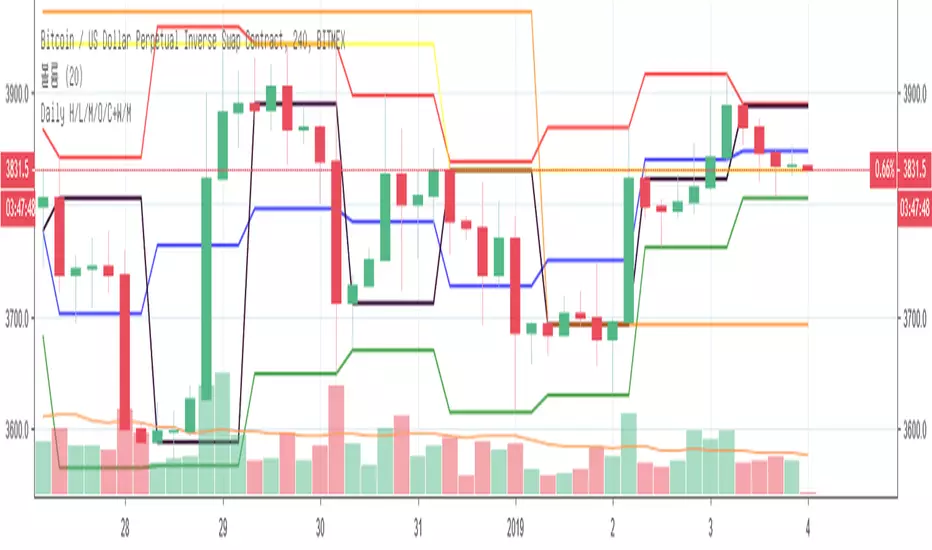
Daily High/Low/Mid/Open/CloseI modify existing scripts about Daily High/Low, Daily Open, Previous Daily Close, etc.
Daily High = red color
Daily Low = green color
Daily Mid = blue color
Daily Open = purple color
Previous Daily Close = black color
Daily Range Zones: PDH/PDL with SL/TPThis indicator automatically plots the previous day's High and Low levels and projects dynamic Stop Loss (SL) and Take Profit (TP) zones based on the daily range percentage.
It is designed for traders focusing on daily range breakouts or mean reversion strategies around the Previous Day High (PDH) and Previous Day Low (PDL).
Key Features:
Level 0 & 1: Visualizes the exact High and Low of the reference timeframe (Daily).
Inner Zone (Orange): Calculated inside the range. Acts as a buffer for Stop Loss placement or entry zones for mean reversion.
Outer Zone (Purple): Calculated outside the range (extension). Acts as a primary Take Profit target for breakout trades.
Settings:
Fully customizable percentages for inner and outer zones.
Option to toggle between current day or previous day data.
Works on any timeframe (intraday charts recommended).

Daily Close Breakout 20/10 + 200 (Signals)Daily Close Breakout 20/10 + 200 (Signals)
A simple “check once per day” breakout signal tool designed for the Daily (1D) chart.
Quickstart:
* Signals are confirmed at the daily candle close.
* If a triangle prints today, the earliest you act is the next day’s open (not the same candle).
* Green triangle = consider entering long.
* Red triangle = consider exiting.
* Long-only (no shorts).
How to use:
* Use on the Daily (1D) timeframe.
* Check the chart once per day after the daily candle closes.
* Do not act intraday on signals.
Rules (default settings 20 / 10 / 200):
* BUY: A green up triangle prints when the daily close is above the prior 20-day high and above the 200-day Simple Moving Average.
* SELL: A red down triangle prints when the daily close is below the prior 10-day low.
Lines and colors:
* Prior 20-day high (entry level): red
* Prior 10-day low (exit level): yellow
* 200-day Simple Moving Average: aqua
Notes:
* Best used on the Daily (1D) timeframe. Other timeframes may behave differently.
* This script plots signals and reference levels only. For performance metrics, use a matching strategy/backtest script.
* Educational use only. Not financial advice.

Daily Level - MEIndicator gives daily levels based on bunch of different stuff that works.
Use on 30m preffered, use Context and Lower tf confirmation before taking trades.

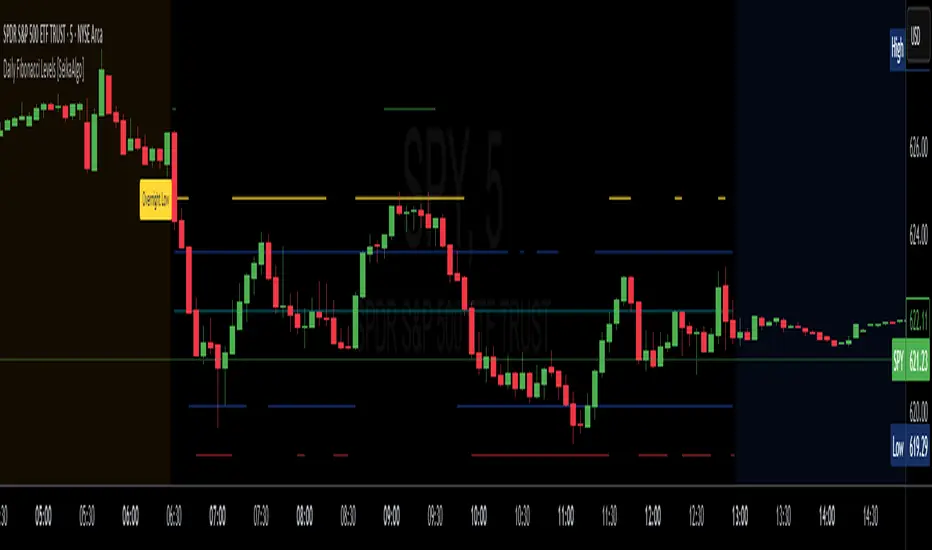
Daily Fibonacci Levels [Asa]This indicator plots dynamic daily Fibonacci levels based on the overnight session high and low, helping traders identify key price zones for potential reversals, breakouts, and pullbacks during the regular trading session.
Key Features:
Overnight Session High/Low Detection: Automatically captures the high and low between user-defined hours (default 16:00–09:30 EST).
Day Session Levels: Fibonacci retracement and extension levels are calculated once the regular session begins (default 09:30–16:00 EST).
Proximity Filter: Only plots levels that are within a customizable threshold of the current price to reduce chart clutter.
Custom Styling: Choose from solid lines, crosses, or circles, and customize the line width for a personalized look.
Mirrored Extensions: Includes both upside and downside Fibonacci extensions beyond the 100% level (up to 300%).
Labels: Clearly marks the overnight high and low with labeled points at session start.
Use Case:
Ideal for intraday and swing traders who rely on overnight price action to map out key Fibonacci levels before and during the trading day. This tool helps quickly identify zones of confluence, potential resistance/support, and continuation levels.
Customization Options:
Session hours and timezone
Line width and style
Proximity threshold for level visibility
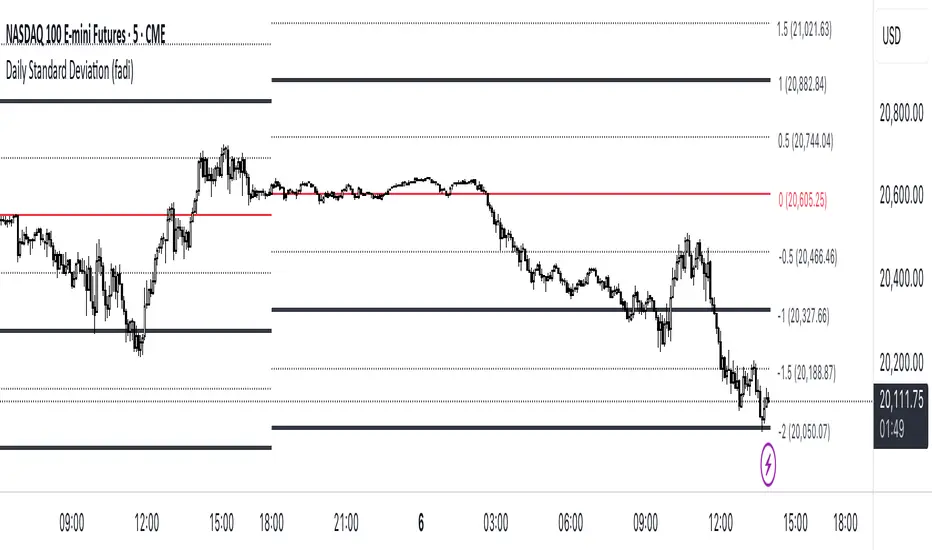
Daily Standard Deviation (fadi)The Daily Standard Deviation indicator uses standard deviation to map out daily price movements. Standard deviation measures how much prices stray from their average—small values mean steady trends, large ones mean wild swings. Drawing from up to 20 years of data, it plots key levels using customizable Fibonacci lines tied to that standard deviation, giving traders a snapshot of typical price behavior.
These levels align with a bell curve: about 68% of price moves stay within 1 standard deviation, 95% within roughly 2, and 99.7% within roughly 3. When prices break past the 1 StDev line, they’re outliers—only 32% of moves go that far. Prices often snap back to these lines or the average, though the reversal might not happen the same day.
How Traders Use It
If prices surge past the 1 StDev line, traders might wait for momentum to fade, then trade the pullback to that line or the average, setting a target and stop.
If prices dip below, they might buy, anticipating a bounce—sometimes a day or two later. It’s a tool to spot overstretched prices likely to revert and/or measure the odds of continuation.
Settings
Open Hour: Sets the trading day’s start (default: 18:00 EST).
Show Levels for the Last X Days: Displays levels for the specified number of days.
Based on X Period: Number of days to calculate standard deviation (e.g., 20 years ≈ 5,040 days). Larger periods smooth out daily level changes.
Mirror Levels on the Other Side: Plots symmetric positive and negative levels around the average.
Fibonacci Levels Settings: Defines which levels and line styles to show. With mirroring, negative values aren’t needed.
Overrides: Lets advanced users input custom standard deviations for specific tickers (e.g., NQ1! at 0.01296).
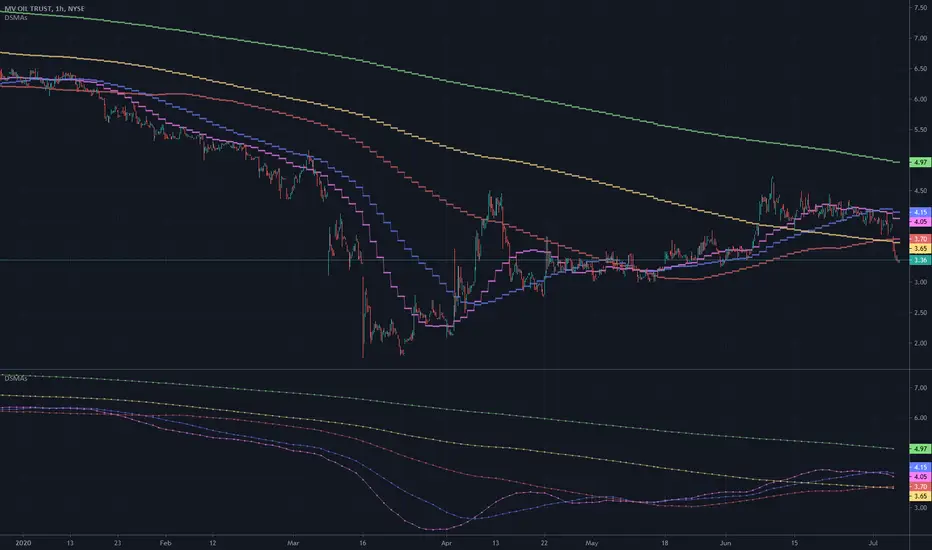
Daily and Weekly Moving Averages on Daily ChartThis script is designed to be used on Swing and Position style approaches.
Based on moving averages that I use with the integration of a weekly moving average that is visible on the daily chart /all timeframes.
The moving averages are:
9EMA;
21EMA;
10 week SMA ;
50EMA;
150EMA;
and 200EMA.
Base script from CaptainBrett with Matt Caruso's chat with Richard Moglen showing me that this can be done on Tradingview. When searching for the script, I couldn't find it within the public library.
Please Enjoy

Daily Close and 5/10 Robinhood TargetsThis script is super simple, just outputs a daily close line and also 5/10% targets higher and lower based on that price.
The reason I made this is somewhat simple which is what, ive noticed (havent statistically backtested) but many popular "robinhood stocks" when they run they tend to almost always tag 5 or 10% up or down.
The theory is something to do with the fact that robinhood alerts at those price levels, so when something like a BYND or RUN or TSLA or (pick a popular stock that runs) it tends to at least tap those levels. I rarely see it go up lets say, 4.33% and then turn around, typically it will at least wick if not pass 5% so using these might POSSIBLY be a level of alpha.
Use it for your own backtests though with something better.

Daily SMA x2 With InputsIdeal for Intraday charts when you want to know the daily SMAs or for daily charts if you want to save on an indicator

Daily Key Levels + VWAPThis indicator is daily price levels and previous day's VWAP for precision intraday trading decisions.

Daily Forex ArrowsArrows that will appear on the candles that follow one or more candle patterns, showing the possible market direction. It's best to enter when the new candle form, after the candle with the arrow appear. Daily chart it's the best on the backtests. Based with Forex markets.

Daily Candle by NatantiaIntroduction to the Daily Candle Indicator
The Daily Candle Indicator is a powerful and customizable tool designed for traders to visualize daily price action on any chart timeframe.
This Pine Script (version 5) indicator, built for platforms like TradingView, overlays a single candle representing the day's open, high, low, and close prices, with options to adjust its appearance and session focus.
Key Features:
Customizable Appearance: Users can set the colors for bullish (default green) and bearish (default white) candles, as well as the wick color (default white). The horizontal offset and candle thickness can also be adjusted to fit the chart layout.
Dynamic Updates: The candle updates on the last bar, with wicks drawn to reflect the daily high and low, providing a clear snapshot of the day's price movement.
This is the same version as before, but we had to republish it because the chart contained other indicators, which violated the publication rules. We apologize for the inconvenience.
Have a nice trades!
-Natantia

Daily 50‑ & 200‑SMA Ceiling Radar — EnhancedDescription:
This custom TradingView indicator, developed by Trader Malik and licensed under Trades Per Minute, is a powerful visual tool for identifying how price behaves relative to major daily moving averages — the 50-SMA and 200-SMA. It helps traders quickly understand key technical dynamics such as trend alignment, MA proximity, and short-term momentum sentiment — all displayed on a clean, minimal overlay with visual alerts and an adjustable data table.
FEATURES
1. Daily 50 & 200 Simple Moving Averages (SMA):**
- Displayed directly on the chart using distinct blue and orange lines.
- These serve as primary trend filters and support/resistance zones.
2. Price Highlighting:
- A red background flashes momentarily when the price crosses either the 50-SMA or 200-SMA.
- A green background fills the chart when price is above both MAs (bullish zone).
- A red background persists if price is below both MAs (bearish zone).
3. MA Gap Analysis Table:
- 50-SMA Row**: Shows % gap between 50-SMA and 200-SMA.
- 200-SMA Row**: Shows % gap between 200-SMA and 50-SMA.
- Sentiment Row**: Displays short-term trend bias based on the slope of the past 7 daily closes — Bullish, Neutral, or Bearish.
USER SETTINGS
Table Location: Choose between **Top Right** or **Bottom Right** of the chart.
Table Size: Select **Small**, **Medium**, or **Large** to suit screen preferences and layout aesthetics.
This script is **intellectual property of Trades Per Minute** and distributed by **Trader Malik** for use under licensing terms. Redistribution or repurposing without authorization is strictly prohibited.

Daily Monday Weekly Monthly Quarterly Yearly High Low Mid This indicator can be useful for traders who are interested in analyzing price movements over different time periods. By displaying the daily, Monday, weekly, monthly, quarterly, and yearly high and low values along with their mid values on a chart, traders can get a better understanding of how prices have behaved over longer periods of time.
For example, a trader might use this information to identify trends or patterns in the market. They might look for occasions when the daily high and low values move outside of an established range or when the weekly or monthly mid values cross certain key levels. This could signal a potential change in the market trend that the trader could act upon.
Additionally, the code can help traders identify key support and resistance levels based on the high and low values of the candles. By plotting these values on a chart, traders can see where prices tend to find support or resistance over different time periods. This information can be used to place stop loss orders or take profit orders at important levels.
Overall, the benefit of using the code you provided is that it offers traders a comprehensive view of price movements over different time periods, which can aid in making more informed trading decisions.
Each level described above has its own unique label, which is abbreviated for convenience. These abbreviations are listed below for quick reference:
For daily levels: DH (Daily High), DM (Daily Mid), and DL (Daily Low)
For Monday levels: MonH (Monday High), MonM (Monday Mid), and MonL (Monday Low)
For monthly levels: MH (Monthly High), MU50 (Monthly 50 percent of Mid and High), MM (Monthly Mid), MD50 (Monthly 50 percent of Mid and Low), and ML (Monthly Low)
For quarterly levels: 3MH (Quarterly High), 3MU50 (Quarterly 50 percent of Mid and High), 3MM (Quarterly Mid), 3MD50 (Quarterly 50 percent of Mid and Low), and 3ML (Quarterly Low)
For yearly levels: YH (Yearly High), YU50 (Yearly 50 percent of Mid and High), YM (Yearly Mid), YD50 (Yearly 50 percent of Mid and Low), and YL (Yearly Low)
These labels can help you quickly identify the different levels and keep track of important price points.
If the chosen timeframe does not fall under the category of intraday, daily and Monday level will not be displayed.
Please feel free to send your suggestions to @z_mehran.

Daily SMAs 10/20/50/100/200This is one of the oldest and simplest trading tools still utilized today, having an ancillary role with long term trading and analyst's commentary in media/news. It's a multicator employing PSv4.0, freely available to ALL, with numerous simple moving averages(SMAs) that use different historical periods of observation in their formulations to portray trading bias. I have revived this tool to my modern expectations of what it could be, embellished with the "Power of Pine".
I provided these moving averages in pastel colors with dotted step-lines as an attempt to not interfere with other "more important indicators" that may exist in your overlay pane. In "Settings" with the "Time Frame" input() set to "Daily", while inspecting much smaller time frames other than daily candles, you may use the sampling quantization tweak to smooth out those step-lines for a different visual appeal. This is exemplified in the lower indicator pane of the chart demonstration above. Also, the brightness control can be quickly and easily fine tuned to your personal preference of visibility that is not distracting. The moving averages are all independently adjustable if you require more responsive calculations with shorter periods of time, or longer...
Features List Includes:
"Daily" or "Chart" time frames
Brightness control
Line thickness adjustment
Sampling quantization tweak
Adjustable periods for the SMAs
The comments section below is solely just for commenting and other remarks, ideas, compliments, etc... regarding only this indicator, not others. When available time provides itself, I will consider your inquiries, thoughts, and concepts presented below in the comments section if you do have any questions or comments regarding this indicator. When my indicators achieve more prevalent use by TV members, I may implement more ideas when they present themselves as worthy additions. As always, "Like" it if you simply just like it with a proper thumbs up, and also return to my scripts list occasionally for additional postings. Have a profitable future everyone!