PROTECTED SOURCE SCRIPT
Güncellendi Daily (%) - Percentage Above / Below Daily [HODLER]
It is a common observation in the world of cryptocurrency that the prices of most digital currencies tend to follow the price movements of Bitcoin. This means that when the price of Bitcoin increases, the prices of other cryptocurrencies usually increase as well, and when the price of Bitcoin decreases, the prices of other cryptocurrencies also tend to decrease, particularly when Bitcoin is near its daily level.
Of course, this is not unique to Bitcoin but also occurs with stocks. You can use this indicator on any asset you choose. Simply select the asset you want to track in the indicator's settings.
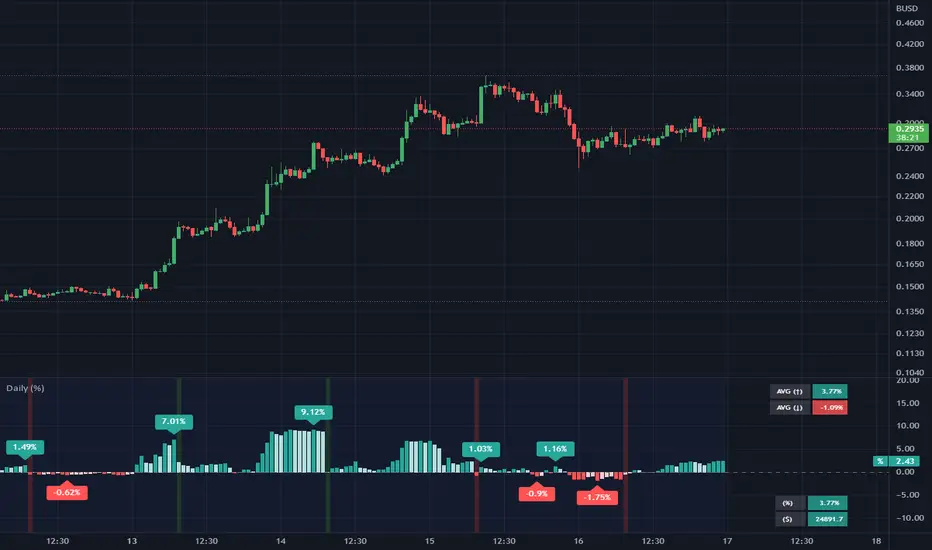
In the example chart, you can see CFXBUSD on a 45-minute timeframe chart with the indicator displayed below that tracks Bitcoin on a daily timeframe, as bitcoin was set as the asset in the settings of the indicator. In the lower right corner of the indicator, it will display the price of the asset "Bitcoin" and the percentage by which it is either above or below the daily price (which is calculated in the same way as on the TradingView watchlist).
This indicator can be very useful when trading other assets to closely monitor Bitcoin's (or any other chosen) activity. You can use it to check if the price is above the daily close and if it closed higher or lower than the last bar. Additionally, you can check if it closed above certain moving averages.
A useful feature of this indicator is that you can set an offset percentage for your visuals to adjust for whether the asset is up or down.
However, it is important to note that not all cryptocurrencies are directly correlated with Bitcoin's price movements, and some may even have unique factors that can cause them to behave differently in the market.
If you have any questions or suggestions regarding this indicator, I would greatly appreciate it if you could let me know in the comments.
Of course, this is not unique to Bitcoin but also occurs with stocks. You can use this indicator on any asset you choose. Simply select the asset you want to track in the indicator's settings.
In the example chart, you can see CFXBUSD on a 45-minute timeframe chart with the indicator displayed below that tracks Bitcoin on a daily timeframe, as bitcoin was set as the asset in the settings of the indicator. In the lower right corner of the indicator, it will display the price of the asset "Bitcoin" and the percentage by which it is either above or below the daily price (which is calculated in the same way as on the TradingView watchlist).
This indicator can be very useful when trading other assets to closely monitor Bitcoin's (or any other chosen) activity. You can use it to check if the price is above the daily close and if it closed higher or lower than the last bar. Additionally, you can check if it closed above certain moving averages.
A useful feature of this indicator is that you can set an offset percentage for your visuals to adjust for whether the asset is up or down.
However, it is important to note that not all cryptocurrencies are directly correlated with Bitcoin's price movements, and some may even have unique factors that can cause them to behave differently in the market.
If you have any questions or suggestions regarding this indicator, I would greatly appreciate it if you could let me know in the comments.
Sürüm Notları
- Corrected some textual errors.- Included calculations for average percentage above and below.
- Introduced new labels for the highest and lowest percentages.
Sürüm Notları
- Increased the amount of historical data available for label count.- Resolved the issue with the current percentage displayed in the table.
Sürüm Notları
- Correlation has been added to the left corner to indicate the level of confidence between the two assets.Korumalı komut dosyası
Bu komut dosyası kapalı kaynak olarak yayınlanmaktadır. Ancak, özgürce ve herhangi bir sınırlama olmaksızın kullanabilirsiniz – daha fazla bilgi burada.
Feragatname
Bilgiler ve yayınlar, TradingView tarafından sağlanan veya onaylanan finansal, yatırım, işlem veya diğer türden tavsiye veya tavsiyeler anlamına gelmez ve teşkil etmez. Kullanım Şartları'nda daha fazlasını okuyun.
Korumalı komut dosyası
Bu komut dosyası kapalı kaynak olarak yayınlanmaktadır. Ancak, özgürce ve herhangi bir sınırlama olmaksızın kullanabilirsiniz – daha fazla bilgi burada.
Feragatname
Bilgiler ve yayınlar, TradingView tarafından sağlanan veya onaylanan finansal, yatırım, işlem veya diğer türden tavsiye veya tavsiyeler anlamına gelmez ve teşkil etmez. Kullanım Şartları'nda daha fazlasını okuyun.