OPEN-SOURCE SCRIPT
Daily Factor Indicator [CC]
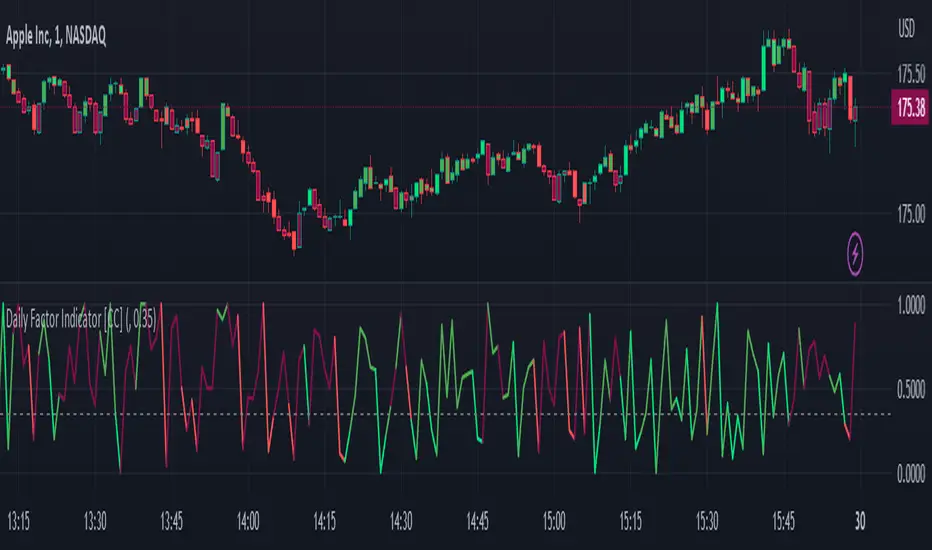
The Daily Factor Indicator was created by Andrea Unger (Stocks and Commodities Jun 2023 pgs 26-31), and this is a new volatility indicator that compares the body, which is the absolute difference between the previous open and previous close, and the range which is the difference between the previous high and previous low. The indicator is calculated by dividing the body and range to determine the volatility for the previous bar. This indicator will range between 0 and 1. Values closer to 1 mean very high volatility, and values closer to 0 mean very low volatility. I have introduced a simple moving average strategy to decide buy or sell signals and colors. Darker colors mean the indicator is above the threshold level, and lighter colors mean the indicator is below the threshold level. Colors are shades of green when the price is above the moving average and shades of red when the price is below the moving average. Feel free to try out your own threshold level and general buy and sell signals.
Let me know if there are any other indicators you would like me to publish!
Let me know if there are any other indicators you would like me to publish!
Açık kaynak kodlu komut dosyası
Gerçek TradingView ruhuna uygun olarak, bu komut dosyasının oluşturucusu bunu açık kaynaklı hale getirmiştir, böylece yatırımcılar betiğin işlevselliğini inceleyip doğrulayabilir. Yazara saygı! Ücretsiz olarak kullanabilirsiniz, ancak kodu yeniden yayınlamanın Site Kurallarımıza tabi olduğunu unutmayın.
I created the largest stock indicator library:
github.com/ooples/
Custom Indicator Requests:
forms.gle/ouMffZR3dQ8bSJQG7
Tips are appreciated:
paypal.me/cheatcountry
patreon.com/cheatcountry
github.com/ooples/
Custom Indicator Requests:
forms.gle/ouMffZR3dQ8bSJQG7
Tips are appreciated:
paypal.me/cheatcountry
patreon.com/cheatcountry
Feragatname
Bilgiler ve yayınlar, TradingView tarafından sağlanan veya onaylanan finansal, yatırım, işlem veya diğer türden tavsiye veya tavsiyeler anlamına gelmez ve teşkil etmez. Kullanım Şartları'nda daha fazlasını okuyun.