Madrid Bull/Bear TerritoryThis study displays a background in four colors, lime, green, red, maroon, lime = Bull Territory, red = Bear Territory, green = possible reversal to Bear Territory, maroon = possible reversal to Bull Territory.
Trading with the basic rule, go long on a Bull Market and short a Bear Market.
This study can be used inside the main window, or by unmerging/merging it can be used as a standalone or in combination with other indicators.
The parameters defined by default reduce choppiness and false signals, but just like any other indicator, there is a trade off between fast response and choppiness. The smaller the parameters the faster response, but the more choppiness.
This indicator is built using three EMA's, two (the bigger ones) are used to define the trend direction, and the fastest one is used as a signal, when the signal breaks out the trend indicators to the downside we're in Bear Market, when the signal breaks out to the upside, we're in Bull Market, any thing in between is either a trend reversal or trend continuation.
Momentum indicators and price pattern analysis are recommended to determine the direction of the trend.
"bear" için komut dosyalarını ara

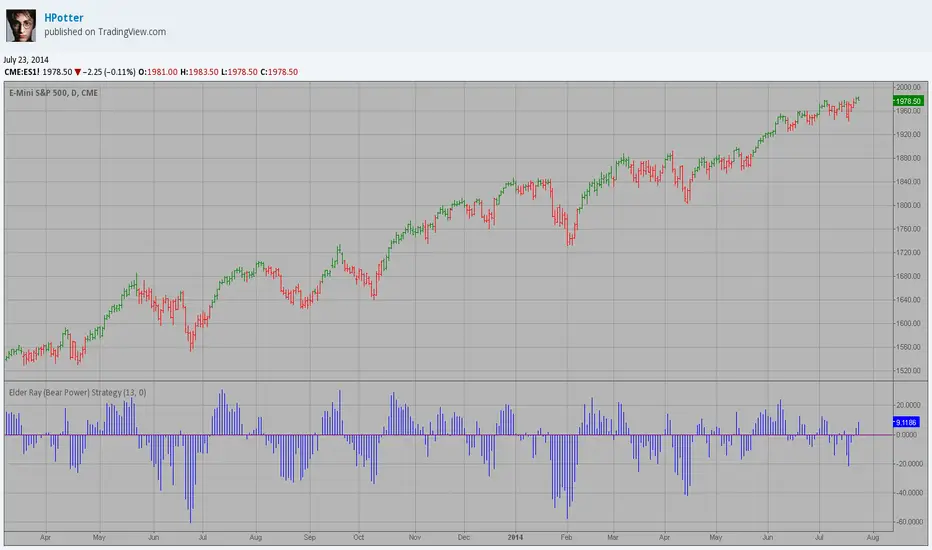
Elder Ray (Bear Power) Strategy Developed by Dr Alexander Elder, the Elder-ray indicator measures buying
and selling pressure in the market. The Elder-ray is often used as part
of the Triple Screen trading system but may also be used on its own.
Dr Elder uses a 13-day exponential moving average (EMA) to indicate the
market consensus of value. Bear Power measures the ability of sellers to
drive prices below the consensus of value. Bear Power reflects the ability
of sellers to drive prices below the average consensus of value.
Bull Power is calculated by subtracting the 13-day EMA from the day's High.
Bear power subtracts the 13-day EMA from the day's Low.
You can use in the xPrice any series: Open, High, Low, Close, HL2, HLC3, OHLC4 and ect...
Elder Ray (Bear Power) Developed by Dr Alexander Elder, the Elder-ray indicator measures buying
and selling pressure in the market. The Elder-ray is often used as part
of the Triple Screen trading system but may also be used on its own.
Dr Elder uses a 13-day exponential moving average (EMA) to indicate the
market consensus of value. Bear Power measures the ability of sellers to
drive prices below the consensus of value. Bear Power reflects the ability
of sellers to drive prices below the average consensus of value.
Bull Power is calculated by subtracting the 13-day EMA from the day's High.
Bear power subtracts the 13-day EMA from the day's Low.
You can use in the xPrice any series: Open, High, Low, Close, HL2, HLC3, OHLC4 and ect...

Bull And Bear Balance Indicator Hi
Let me introduce my Bull And Bear Balance Indicator script.
This new indicator analyzes the balance between bullish and
bearish sentiment.
One can cay that it is an improved analogue of Elder Ray indicator.
To get more information please see "Bull And Bear Balance Indicator"
by Vadim Gimelfarb

Stacked Bullish vs Bearish VolumeThis indicator visually represents buying (bullish) and selling (bearish) pressure within each candle by stacking both portions inside a single volume bar. Unlike traditional volume indicators that use only one color per bar, this script splits each volume bar into two segments:
Green portion (Bullish Volume) → Represents the buying pressure when the price moves up.
Red portion (Bearish Volume) → Represents the selling pressure when the price moves down.
By stacking buy and sell volume inside the same column, traders can easily assess the balance of buying vs selling activity within each trading session.
Stacking the Bars:
The bullish portion (green) is plotted first.
The bearish portion (red) is plotted slightly offset to create a stacked effect.

Average Bullish & Bearish Percentage ChangeAverage Bullish & Bearish Percentage Change
Processes two key aspects of directional market movements relative to price levels. Unlike traditional momentum tools, it separately calculates the average of positive and negative percentage changes in price using user-defined independent counts of actual past bullish and bearish candles. This approach delivers comprehensive and precise view of average percentage changes.
FEATURES:
Count-Based Averages: Separate averaging of bullish and bearish %𝜟 based on their respective number of occurrences ensures reliable and precise momentum calculations.
Customizable Averaging: User-defined number of candle count sets number of past bullish and bearish candles used in independent averaging.
Two Methods of Candle Metrics:
1. Net Move: Focuses on the body range of the candle, emphasizing the net directional movement.
2. Full Capacity: Incorporates wicks and gaps to capture full potential of the bar.
The indicator classifies Doji candles contextually, ensuring they are appropriately factored into the bullish or bearish metrics to avoid mistakes in calculation:
1. Standard Doji - open equals close.
2. Flat Close Doji - Candles where the close matches the previous close.
Timeframe Flexibility:
The indicator can be applied across any desired timeframe, allowing for seamless multi-timeframe analysis.
HOW TO USE
Select Method of Bar Metrics:
Net Move: For analyzing markets where price changes are consistent and bars are close to each other.
Full Capacity: Incorporates wicks and gaps, providing relevant figures for markets like stocks
Set the number of past candles to average:
🟩 Average Past Bullish Candles (Default: 10)
🟥 Average Past Bullish Candles (Default: 10)
Why Percentage Change Is Important
Standardized Measurement Across Assets:
Percentage change normalizes price movements, making it easier to compare different assets with varying price levels. For example, a $1 move in a $10 stock is significant, but the same $1 move in a $1,000 stock is negligible.
Highlights Relative Impact:
By measuring the price change as a percentage of the close, traders can better understand the relative impact of a move on the asset’s overall value.
Volatility Insights:
A high percentage change indicates heightened volatility, which can be a signal of potential opportunities or risks, making it more actionable than raw price changes. Percents directly reflect the strength of buying or selling pressure, providing a clearer view of momentum compared to raw price moves, which may not account for the relative size of the move.
By focusing on percentage change, this indicator provides a normalized, actionable, and insightful measure of market momentum, which is critical for comparing, analyzing, and acting on price movements across various assets and conditions.

RCYC Bullish Bearish Indicator
Summary: The RCYC Bullish Bearish Indicator is a custom trading tool designed to help traders identify potential bullish and bearish conditions in the market using a combination of KDJ and RSI indicators. This indicator uses color-coded candles to visually represent bullish and bearish signals, making it easy to identify trend changes on the chart. The script is particularly useful for traders who prefer visual signals and want to incorporate both trend momentum (KDJ) and relative strength (RSI) in their analysis.
Description:
The RCYC Bullish Bearish Indicator is a unique mashup of the KDJ and RSI indicators, optimized to provide a clear visual representation of market conditions through color-coded candles. This indicator not only identifies the potential trend shifts but also provides alerts for significant crossover points, enhancing a trader's ability to make informed decisions.
How It Works:
KDJ Calculation:
The KDJ is a variation of the Stochastic Oscillator that includes the %J line, which can go beyond the typical 0-100 range of %K and %D.
The KDJ component of this indicator calculates the highest high and lowest low over a specified period (KDJ Length), using these values to derive the %K line.
The %D line is a smoothed version of %K, and the %J line is derived from %K and %D using the formula: J = 3 * %K - 2 * %D.
This indicator focuses on the behavior of the %J line in relation to a mid-point level (50), identifying crossovers and crossunders that signal potential shifts in market sentiment.
RSI Calculation:
The Relative Strength Index (RSI) is a momentum oscillator that measures the speed and change of price movements. It is widely used to identify overbought or oversold conditions.
In this indicator, RSI values are adjusted and plotted to align visually with the KDJ values, providing a complementary momentum analysis.
Crossover Logic and Candle Coloring:
The indicator tracks two main events:
CrossOver50: When the %J line crosses above the 50 level, indicating potential bullish momentum.
CrossUnder50: When the %J line crosses below the 50 level, indicating potential bearish momentum.
Depending on the crossover events, the script changes the color of the candles on the chart:
Red candles on the initial crossover above 50, followed by dark blue candles to maintain bullish sentiment.
Yellow candles on the initial crossover below 50, followed by light blue candles to maintain bearish sentiment.
Alerts:
The indicator includes alert conditions for both bullish and bearish signals:
Red Candle Alert: Notifies the trader when the %J line crosses above 50.
Yellow Candle Alert: Notifies the trader when the %J line crosses below 50.
These alerts allow traders to react promptly to key market signals without continuously monitoring the chart.
Usage and Benefits:
This indicator is designed for traders looking to combine momentum and trend analysis into a single visual tool. It is particularly useful for those trading in trending markets or looking for entry/exit signals based on momentum shifts.
The color-coded candles provide an intuitive way to assess market conditions at a glance, reducing the complexity associated with analyzing multiple indicators separately.
By integrating both KDJ and RSI, the RCYC Bullish Bearish Indicator offers a balanced approach to trend detection and momentum confirmation, making it versatile for various trading styles, including scalping, swing trading, and position trading.
Originality and Usefulness:
While the indicator builds upon the familiar concepts of KDJ and RSI, it uniquely merges them into a cohesive visual tool with distinct crossover-based alerts and candle coloring.
This approach makes the indicator original, as it simplifies the interpretation of complex signals into straightforward visual cues, enhancing the decision-making process for traders who prefer chart-based analysis.

Truly Bullish & Bearish CandleThis Pine Script indicator identifies and highlights truly bullish and bearish candles on your chart. Truly bullish candles are characterized by a strong bullish close significantly above the specific percentage, suggesting strong buying pressure. Conversely, truly bearish candles exhibit a strong bearish close significantly below the specific percentage, indicating strong selling pressure. By identifying these candles, traders can gain insights into potential shifts in market sentiment and make more informed trading decisions.
Key Features:
Identifies truly bullish and bearish candles based on strong open/close differentials.
Highlights these candles on the chart for easy visualization.
Helps traders identify potential reversals or continuations in market trends.
Customizable parameters for fine-tuning to suit individual trading strategies.
Compatible with various timeframes and trading instruments.
Usage Instructions:
Apply the indicator to your chart.
Configure the settings according to your preferences.
Look for highlighted truly bullish and bearish candles as potential entry or exit signals.
Consider additional analysis and risk management strategies to confirm trading decisions.
Disclaimer: This indicator is provided for informational and educational purposes only. It is not intended as financial advice or trading recommendations. Trading involves risks, and it's essential to conduct thorough research and practice proper risk management techniques.

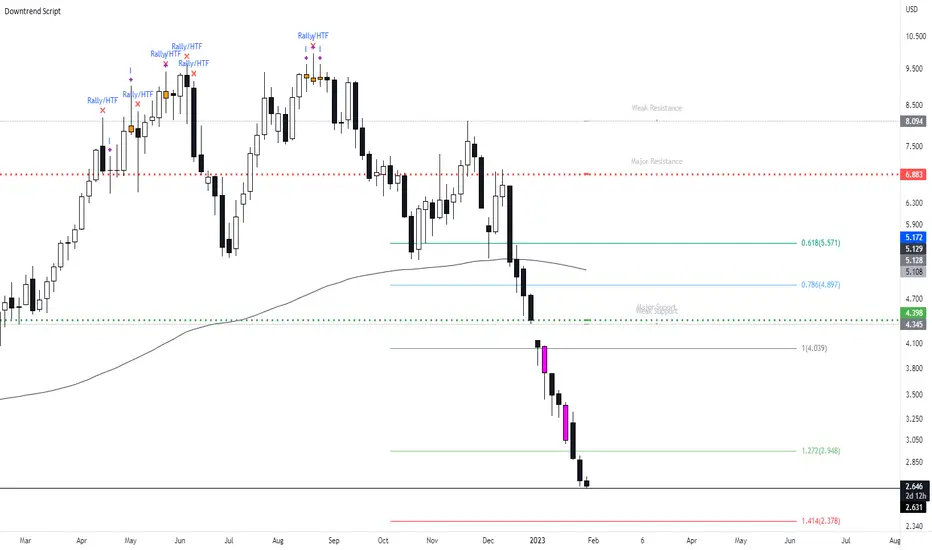
New Bearish Downtrend Script - Perfect for Short SellingIts been a while since i last uploaded a script, what i have for you today is a script which works very efficiently for downtrends and spotting reversals. This is a script i use on a weekly basis when looking to short sell.
This script includes :
Updated** Rally Candles for HTF and LTF ( End of Impulsive move signal) - The psychology of the candle when used with market information can be viewed as a end or near to the end of a big impulsive leg - when this candle occurs in BEARISH CONDITIONS, we can assume price is likely to move away short term.
Major and Minor Support Levels HTF (Areas of interest)
The Psychology on these levels is price will do something at these key levels - it takes in the last quarter price action of High Open Low Close to generate the price levels and when price comes into these areas we are likely to see a bounce or rejection from this area.
Bearish Breakout Volume Candle - This candle will paint a Purple colour bar when volume breaks above the 7day average - this shows strong momentum in the market and will usually be seen when price is in a downtrend with strong momentum.. However when this does occur we can expect a short term bounce or base so don't trade the volume bar alone.
Indecision Candles - Psychology of this candle is to show exhaustion in the trend and ideally what to see this candle appear with Rally Candles at key areas for stronger set up. When the trend is moving up, the bearish doji can appear - i tend to look at this situation as a pause in the trend.
200 EMA
Everything in this script has alert conditions to provide an edge in the markets
This is an example of how the script will look on the HTF I'm using the Daily Timeframe for reference on TSLA
This is an example of how the script looks like on the LTF, price hit the Major Resistance twice and failed to hit the 3rd time and on each leg of the impulse, the chart portrayed the LTF Rally Candles
Heres an example on how to use both Major Resistance ( Area of Interest) Rally Candle and Volume Breakout as a trade set up idea - This setup idea was on Crude Oil last week and into this week.
When added to confluences such as Supply Zones, Mitigation Levels, Quasimodo patterns etc... this will enhance the script.
I will answer any questions if i haven't made the script clear or take any requests to improve the script.
Also will be uploading the Bullish Uptrend Script soon.
Short Swing Bearish MACD Cross (By Coinrule)This strategy is oriented towards shorting during downside moves, whilst ensuring the asset is trading in a higher timeframe downtrend, and exiting after further downside.
This script can work well on coins you are planning to hodl for long-term and works especially well whilst using an automated bot that can execute your trades for you. It allows you to hedge your investment by allocating a % of your coins to trade with, whilst not risking your entire holding. This mitigates unrealised losses from hodling as it provides additional cash from the profits made. You can then choose to hodl this cash, or use it to reinvest when the market reaches attractive buying levels. Alternatively, you can use this when trading contracts on futures markets where there is no need to already own the underlying asset prior to shorting it.
ENTRY
This script utilises the MACD indicator accompanied by the Exponential Moving Average (EMA) 450 to enter trades. The MACD is a trend following momentum indicator and provides identification of short-term trend direction. In this variation it utilises the 11-period as the fast and 26-period as the slow length EMAs, with signal smoothing set at 9.
The EMA 450 is used as additional confirmation to prevent the script from shorting when price is above this long-term moving average. Once price is above the EMA 450 the script will not open any shorts - preventing the rule from attempting to short uptrends. Due to this, this strategy is ideal for setting and forgetting.
The script will enter trades based on two conditions:
1) When the MACD signals a bearish cross. This occurs when the EMA 11 crosses below the EMA 26 within the MACD signalling the start of a potential downtrend.
2) Price has closed below the EMA 450. Price closing below this long-term EMA signals that the asset is in a sustained downtrend. Price breaking above this could indicate a bullish strength in which shorting would not be profitable.
EXIT
This script utilises a set take-profit and stop-loss from the entry of the trade. The take profit is set at 8% and the stop loss of 4%, providing a risk reward ratio of 2. This indicates the script will be profitable if it has a win ratio greater than 33%.
Take-Profit Exit: -8% price decrease from entry price.
OR
Stop-Loss Exit: +4% price increase from entry price.
Based on backtesting results across a selection of assets, the 45-minute and 1-hour timeframes are the best for this strategy.
The strategy assumes each order is using 30% of the available coins to make the results more realistic and to simulate you only ran this strategy on 30% of your holdings. A trading fee of 0.1% is also taken into account and is aligned to the base fee applied on Binance.
The backtesting data was recorded from December 1st 2021, just as the market was beginning its downtrend. We therefore recommend analysing the market conditions prior to utilising this strategy as it operates best on weak coins during downtrends and bearish conditions, however the EMA 450 condition should mitigate entries during bullish market conditions.

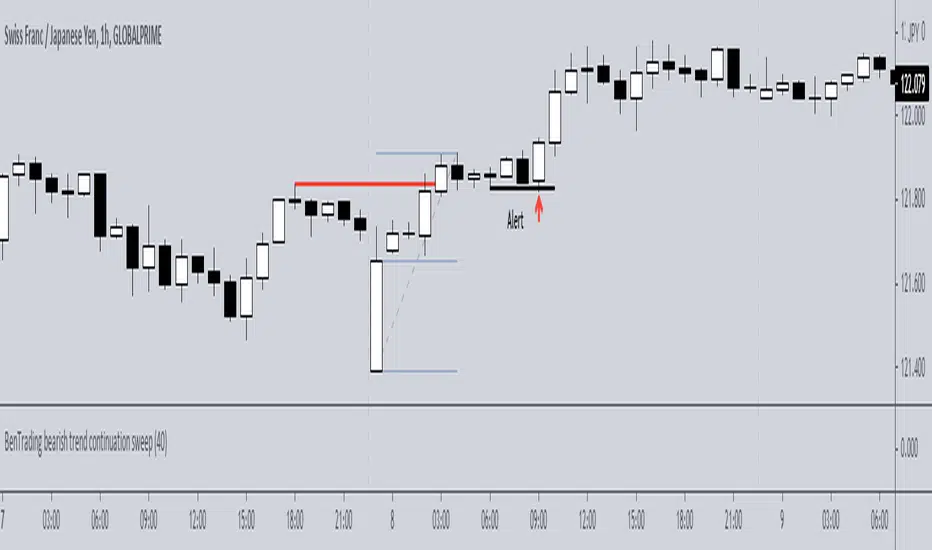
BenTrading bearish trend continuation sweepThis script uses simple features to indicate where a trend may continue.
It uses market structures and monitors breaks of swing highs and swing lows.
If there is a break downwards, the alert will give signal when there is a sweep that forms in the biased direction (see chart - alert will trigger on candle close).
For it to send alerts you must right click the indicator and apply alert - "once per bar".
This indicator only shows bearish signals, while there is another indicator that can be used alongside it to indicate bullish trend continuation with the same features.
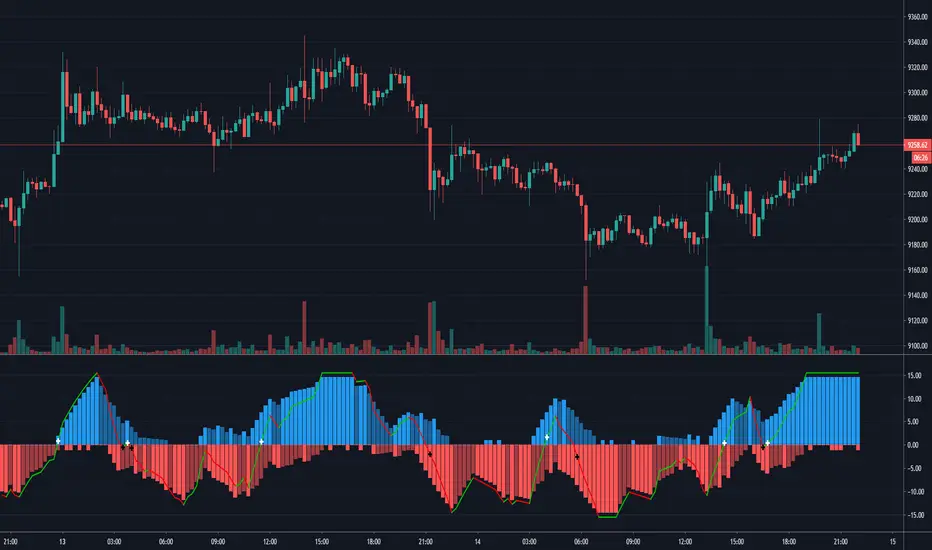
Bullish-Bearish OscillatorThis is my attemption to create oscillator that will show when the market is bullish and when its bearish . Fight between those two forces will be shown on the chart.
It is based on price action versus two moving averages.
* You can choose from 4 different MAs in settings: McGinley , SMA , EMA and VWAP .
* You can set up 2 Moving Averages (fast and slow)
* Amount of bars back from PriceAction versus MAs is calculated
ps. This script is invite-only for the members of our trading group (info in signature, group is free of charge).
Bullish/Bearish Candle Series DistributionThe tool counts the number of consecutive bullish or bearish candles in a row and build a distribution of those series lengths. The entire history of an instrument is used.
Available modes:
Strict Bullish ( close > open )
Bullish ( close >= open )
Strict Bearish ( close <= open )
Bearish ( close < open )
Different chart types have different distributions:
Renko
Line Break

[astropark] Bullish Bearish Divergences for all OscillatorsDear Followers,
today a new great Scalper Tool , which works excellent on all timeframes and charts , both FOREX and Cryptocurrencies!
It alerts you when a new divergence has been spotted on the chart based on your preferred oscillator or set of oscillators ( yes, you can combine them! )
Here the list of currently supported oscillators (more in the future):
RSI (Relative Strength Index)
MACD
MACD Histogram
Stochastic
Stochastic RSI
CCI (Commodity Channel Index)
Momentum
Volume Oscillator
OBV (On Balance Volume)
VWmacd
Bollinger Bands %B
William %R
Chaikin Money Flow
Chaikin Oscillator
AO (Awesome Oscillator)
DPO (Detrended Price Oscillator)
Ultimate Oscillator
RVI (Relative Volatility Index)
Klinger Oscillator
This script will let you set all notifications you may need in order to be alerted on each triggered divergence (both regular and hidden).
This script:
works on all timeframes , starting from 1 minute: so you can enjoy high-frequency trading by using a 24/7 running bot and a proper money and risk management strategy if you like
shows you both bullish and bearish divergences, both regular and hidden , with a triangle up or down respectively
lets you activate more than one oscillator at the same time
lets you choose to be alerted only if all active oscillators agree on spotted divergence , so you will get only stronger and more secure ones (you can set both all or at least a configurable number of enabled oscillators)
lets you edit basic configuration settings of each oscillator
lets you disable or enable hidden divergences on chart
This is a premium indicator , so send me a private message in order to get access to this script.


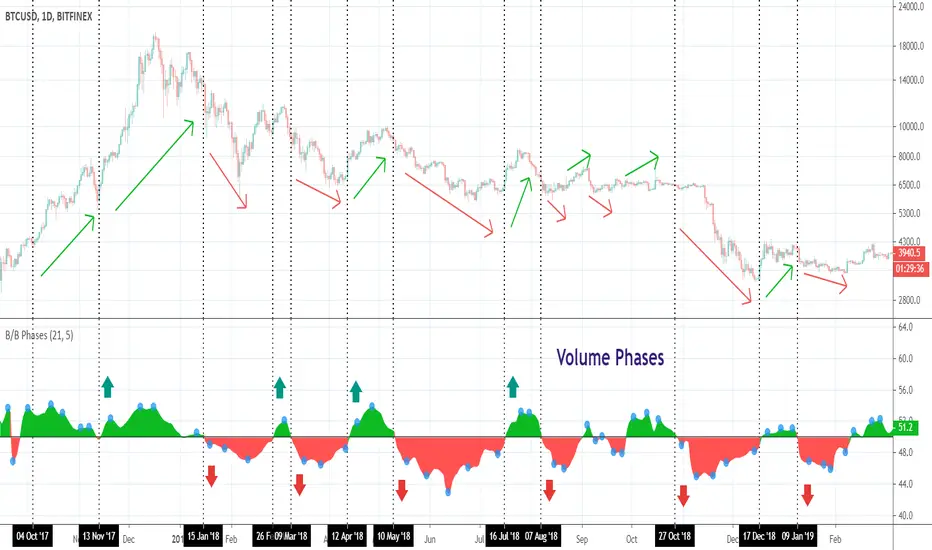
Bullish/Bearish PhasesHello traders!
This indicator shows you bullish or bearish dominance during the specified period and is based on the volume calculations. Why? Volume acts as an excellent confirmation tool of the price movements and is used to determine if an instrument is gaining or losing momentum.
Bullish/Bearish Phases can be used to find out divergences with the price. It will work on ANY instrument that has available volume data.
NOTE : The blue circles appear on the local peaks.
I attached some screenshots to show you how it works with other instruments.
Happy Trading!
Bear Lines: Liquidity Rails & Momentum [Premium]ACCESS: This is a restricted, invite-only institutional toolkit. To purchase a license and unlock this script immediately, visit: whop.com
What is Bear Lines? Bear Lines is a complete "Code Guardian" system designed to automate institutional price analysis. It removes the noise from your charts by plotting high-probability liquidity rails, momentum shifts, and market imbalances (FVGs) in real-time. It is designed to save traders hours of manual charting every day.
Key Features
1. Automated Liquidity Rails (The "Sandwich" Logic) Stop manually drawing lines every morning. Bear Lines automatically identifies and plots the most critical structural levels where price is likely to reverse or sweep:
Outer Shell: Weekly Highs & Lows (Major Structure).
Inner Shell: Daily Highs & Lows (Intraday Targets).
Visual Constitution: The script uses a strict non-overlapping label system to keep your chart clean and readable at all times.
2. Institutional Momentum (Sticky Glow) Visualize the true trend with our "Sticky Glow" technology.
Bullish Trend (Neon Green): Activates when a structural Bullish Divergence (Price Lower Low + RSI Higher Low) is detected. The glow persists until the structure is broken.
Bearish Trend (Neon Red): Activates when a structural Bearish Divergence is detected. The glow persists until the trend is invalidated.
Note: Includes "Bull" and "Bear" icons to signal the exact moment of a momentum shift.
3. Smart FVG Detection Automatically highlights Fair Value Gaps (Imbalances) that act as magnets for price.
Dynamic Cleanup: The system intelligently removes gaps that have been filled or are no longer relevant, ensuring your chart remains performant and clutter-free.
How to Trade This System
Identify the Bias: Use the "Sticky Glow" background to determine if the market is structurally Bullish or Bearish.
Wait for the Sweep: Look for price to interact with the Daily or Weekly Rails. These levels often act as the "Trigger" for a reversal.
Confirm the Entry: Wait for a Bull/Bear icon or an FVG rejection at the Rail to execute your trade.
Get Access This script is protected. To join the community and use Bear Lines on your chart today: Go to: whop.com

Bear Momentum Engine (RSI Regime)Title: Bear Momentum Engine (RSI Regime)
Bear Momentum Engine is a professional-grade analytical tool designed specifically for crypto markets during bearish cycles. Unlike traditional RSI indicators that look for "oversold" levels, this engine focuses on momentum structure and regime expansion phases.
The Philosophy
Most traders lose money by buying "oversold" RSI during a crash. This tool is built on Andrew Cardwell’s range shift theory: in a true bear regime, RSI struggles to break above 60, and its real power is found in how it expands away from its moving average.
Key Features:
Bear Regime Detection: Automatically identifies the bearish market phase. The background turns red only when the structural momentum confirms a downside bias.
Momentum Expansion: A proprietary algorithm tracks the "detachment" of RSI from its MA. When the distance increases, it signals a high-probability bearish thrust.
Iron Exit: A disciplined profit-taking system. It triggers an exit signal as soon as the momentum starts to fade, allowing you to lock in gains before the bounce.
No-Trade Zones: Filters out "market noise." The gray background indicates a sideways market where the risk-to-reward ratio is unfavorable.
Best Use Cases:
Strategy: Short-selling, Futures, and Perpetuals.
Goal: Trading with the trend and avoiding "bull traps."
Recommended Timeframes: 1H, 4H, Daily.

Bear & Bull Builder // visual strategy builderAre you a trend follower?
Trend following systems have been a cornerstone of trading since the first candlestick charts were invented in 18th-century Japan by Munehisa Homma (or Honma), a legendary rice merchant who used them to analyze market sentiment and predict price movements. Since then, legendary traders like Richard Dennis and Dr. David Paul have used technical analysis—the study of turning points and trends of candlestick charts—to develop an edge and strategy for trading equity, commodity, and forex markets.
How to Utilize the Bear & Bull Builder
This script is a way to pick and choose technical methods like SMAs and EMAs to define trend exits and entries. Additionally, you can specify an ATR (Average True Range) calculated stop loss based on your individual strategy and trading plan. Within the settings panel, you can set up this script to display only Long Position values, zones, and levels—or configure it for shorts, or both.
What Makes This Original
Unlike most trend-following indicators that lock you into a single approach, this script lets you combine different indicator types (RSI, WaveTrend, CCI, EMA, SMA) across three separate trend timeframes. The originality comes from the flexibility: you can test whether momentum-based trends (like RSI) work better than moving averages for your timeframe, or experiment with mixing them together. The script also bridges the gap between manual trading and automation by providing visual position values and fill zones that show exactly where signals generate versus where orders execute—critical information most scripts ignore.
Getting Started
For this quick and easy setup example, I built a strategy that is long-only, displays only long positional data and values, and uses a 21 & 55 period exponential moving average for the short and medium-term trend in addition to an 89 period simple moving average for my longer-term outlook. I have set my ATR-based multiplier to 0.75, and have left the fill zone display turned on to help visualize when to set up the built-in alerts for automating my strategy. I have made this the default settings of the script.
Positional Values
GREEN NUMBERS → Entry signal price
YELLOW NUMBERS → Stop loss price
BLUE NUMBERS → Exit signal price
IMPORTANT
I cannot describe how useful it is to use TradingView's built-in Long and Short position tools! The whole reason for this script is that it is as manually friendly as it is automated—especially for backtesting. You can use the long position tool to measure exact profits and losses on individual trades for the strategies you build. This can really help you see clearly if you have built a system with positive expectancy.
Tables
1. Settings Display Table
Displays the trend types that are configurable in the settings panel. Shows if positional values for longs and shorts are currently displayed.
2. Back testing Table
Displays the total amount of long and short entry signals since the first bar of the chart. Additionally, it displays the average amount of bars per trade (time in trade).
Alerts & Automation
There are 4 built-in alerts for automating your strategy to an external server:
1.Long Entries
2.Long Exits
3.Short Entries
4.Short Exits
Since this script uses confirmed bar states for alert generation (to avoid repainting), all alerts and displayed position values (the green, yellow, and blue numbers) will be sent on the closing price. Each alert has a placeholder preset for further customization.
Technical Details
How the trend detection works:
Bullish state triggers when close > all three selected trends
Bearish state triggers when close < all three selected trends
Uses barstate.isconfirmed to prevent repainting
Stop loss calculation:
Long stops: highest_trend - (ATR × multiplier)
Short stops: lowest_trend + (ATR × multiplier)
ATR period is fixed at 20 bars, multiplier is user-adjustable
Entry placement logic:
Long entries execute at the highest value among the three selected trends
Short entries execute at the lowest value among the three selected trends
This ensures entries occur near the support/resistance created by the trend lines
Why calculate all indicators upfront:
The script calculates all five indicator types (EMA, SMA, RSI, CCI, WaveTrend) for all three trend lengths on every bar, then selectively uses the ones you choose in settings. This prevents Pine Script consistency warnings while maintaining flexibility.

Bear Market Defender [QuantraSystems]Bear Market Defender
A system to short Altcoins when BTC is ranging or falling - benefit from Altcoin bleed or collapse .
QuantraSystems guarantees that the information created and published within this document and on the TradingView platform is fully compliant with applicable regulations, does not constitute investment advice, and is not exclusively intended for qualified investors.
Important Note!
The system equity curve presented here has been generated as part of the process of testing and verifying the methodology behind this script.
Crucially, it was developed after the system was conceptualized, designed, and created, which helps to mitigate the risk of overfitting to historical data. In other words, the system was built for robustness, not for simply optimizing past performance.
This ensures that the system is less likely to degrade in performance over time, compared to hyper-optimized systems that are tailored to past data. No tweaks or optimizations were made to this system post-backtest.
Even More Important Note!!
The nature of markets is that they change quickly and unpredictably. Past performance does not guarantee future results - this is a fundamental rule in trading and investing.
While this system is designed with broad, flexible conditions to adapt quickly to a range of market environments, it is essential to understand that no assumptions should be made about future returns based on historical data. Markets are inherently uncertain, and this system - like all trading systems - cannot predict future outcomes.
INTRODUCTION TO THE STAR FRAMEWORK
The STAR Framework – an abbreviation for Strategic Trading with Adaptive Risk - is a bespoke portfolio-level infrastructure for dynamic, multi-asset crypto trading systems. It combines systematic position management, adaptive sizing, and “intra-system” diversification, all built on a rigorous foundation of Risk-based position sizing .
At its core, STAR is designed to facilitate:
Adaptive position sizing based on user-defined maximum portfolio risk
Capital allocation across multiple assets with dynamic weight adjustment
Execution-aware trading with robust fee and slippage adjustment
Realistic equity curve logic based on a compounding realized PnL and additive unrealized PnL
The STAR Framework is intended for use as both a standalone portfolio system or preferred as a modular component within a broader trading “global portfolio” - delivering a balance of robustness and scalability across strategy types, timeframes, and market regimes.
RISK ALLOCATION VIA "R" CALCULATIONS
The foundational concept behind STAR is the use of the R unit - a dynamic representation of risk per trade. R is defined by the distance between a trade's entry and its stoploss, making it an intuitive and universally adaptive sizing unit across any token, timeframe, or market.
Example: Suppose the entry price is $100, and the stoploss is $95. A $5 move against the position represents a 1R loss. A 15% price increase to $115 would equal a +3R gain.
This makes R-based systems highly flexible: the user defines the percentage of capital that is put at risk per R and all positions are scaled accordingly - whether the token is volatile, illiquid, or slow-moving.
R is an advantageous method for determine position sizing - instead of being tied to complex value at risk mechanisms with having layered exit criteria, or continuous volatility-based sizing criteria that need to be adjusted while in an open trade, R allows for very straightforward sizing, invalidation and especially risk control – which is the most fundamental.
REALIZED BALANCE, FEES & SLIPPAGE ACCOUNTING
All position sizing, risk metrics, and the base equity curve within STAR are calculated based on realized balance only .
This means:
No sizing adjustments are made based on unrealized profit and loss ✅
No active positions are included in the system's realized equity until fully closed ✅
Every trade is sized precisely according to current locked-in realized portfolio balance ✅
This creates the safest risk profile - especially when multiple trades are open. Unrealized gains are not used to inflate sizing, ensuring margin safety across all assets.
All calculations also incorporate slippage and fees, based on user-defined estimates – which can and should be based upon user-collected data - and updated frequently forwards in time. These are not cosmetic, or simply applied to the final equity curve - they are fully integrated into the dynamic position sizing and equity performance , ensuring:
Stoploss hits result in exactly a −1R loss, even after slippage and fees ✅
Winners are discounted based on realistic execution costs ✅
No trade is oversized due to unaccounted execution costs ✅
Example - Slippage in R Units:
Let R be defined as the distance from entry to stoploss.
Suppose that distance is $1, and the trade is closed at a win of +$2.
If execution slippage leads to a 50 cent worse entry and a 50 cent worse exit, you’ve lost $1 extra - which is an additional 1R in execution slippage. This makes the effective return 1.0R instead of the intended 2.0R.
This is equivalent to a slippage value of 50%.
Thus, slippage in STAR is tracked and modelled on an R-adjusted basis , enabling more accurate long-term performance modelling.
MULTI-ASSET, LONG/SHORT SUPPORT
STAR supports concurrent long and short positions across multiple tokens. This can sometimes result in partially hedged exposure - for example, being long one asset and short another.
This structure has key benefits:
Diversifies idiosyncratic risk by distributing exposure across multiple tokens
Allows simultaneous exploitation of relative strength and weakness
Reduces portfolio volatility via natural hedging during reduced trending periods
Even in a highly correlated market like crypto, short-term momentum behaviour often varies between tokens - making diversified, multi-directional exposure a strategic advantage .
EQUITY CURVE
The STAR framework only updates the underlying realized equity when a position is closed, and the trade outcome is known. This approach ensures:
True representation of actual capital available for trading
No exposure distortion due to unrealized gains
Risk remains tightly linked to realized results
This trade-to-trade basis for realized equity modelling eliminates the common pitfall of overallocation based on unrealized profits.
The visual equity curve represents an accurate visualization of the Total Equity however, which is equivalent to what would be the realized equity if all trades were closed on the prior bar close.
TIMEFRAME CONSIDERATIONS
Lower timeframes typically yield better performance for STAR due to:
Greater data density per day - more observations = better statistical inference
Faster compounding - more trades per week = faster capital rotation
However, lower timeframes also suffer from increased slippage and fees. STAR's execution-aware structure helps mitigate this, but users must still choose timeframes appropriate to their liquidity, costs, and operational availability.
INPUT OPTIONS
Fees (direct trading costs - the percentage of capital removed from the initial position size)
Slippage (execution delay, as a percentage. In practice, the fill price is often worse than the signal price. This directly affects R and hence position sizing)
Risk % ( Please note : this is the risk level if every position is opened at once. 5% risk for 5 assets is 1% risk per position)
System Start date
Float Precision value of displayed numbers
Table visualization - positioning and table sizes
Adjustable color options
VISUAL SIMPLICITY
To avoid usual unnecessary complexity and empower fast at-a-glance action taking, as well as enable mobile compatibility, only the most relevant information is presented.
This includes all information required to open positions in one table.
As well as a quick and straightforward overview for the system stats
Lastly, there is an optional table that can be enabled
displaying more detailed information if desired:
USAGE GUIDELINES
To use STAR effectively:
Input your average slippage and fees %
Input your maximum portfolio risk % (this controls overall leverage and is equivalent to the maximum loss that the allocation to STAR would bring if ALL positions are allocated AND hit their stop loss at the same time)
Wait for signal alerts with entry, stop, and size details
STAR will dynamically calculate sizing, risk exposure, and portfolio allocation on your behalf. Position multipliers, stop placement, and asset-specific risk are all embedded in the system logic.
Note: Leverage must be manually set to ISOLATED on your exchange platform to prevent unwanted position linking.
ABOUT THE BEAR MARKET DEFENDER STRATEGY
The first strategy to launch on the STAR Framework is the BEAR MARKET DEFENDER (BMD) - a fast-acting, trend following system based upon the Trend Titan NEUTRONSTAR. For the details of the logic behind NEUTRONSTAR, please refer to the methodology and trend aggregation section of the following indicator:
The BMD ’s short side exit calculation methodology is slightly improved compared to NEUTRONSTAR, to capture downtrends more consistently and also cut positions faster – which is crucial when considering general jump risk in the Crypto space.
Accordingly, the only focus of the BMD is to capture trends to the short side, providing the benefit of being in a spectrum from no correlation to being negatively correlated in risk and return behavior to classical Crypto long exposure.
More precisely, Crypto behavior showcases that when Bitcoin is in a ranging/mean reverting environment, most tokens that don’t fall into the “Blue-Chip” category tend to find themselves in a trend towards 0.
Typically during this period most Crypto portfolios suffer heavily due to a “Crypto-long” biased exposure.
The Bear Market Defender thrives in these chaotic, high volatility markets where most coins trend towards zero while the traditional Crypto long exposure is either flat or in a drawdown, therefore the BMD adds a source of uncorrelated risk and returns to hedge typical long exposure and bolster portfolio volatility.
Because of the BMD's short-only exposure, it will often suffer small losses during strong uptrends. During these periods, long exposure performs the best and the goal is to outperform the temporary underperformance in the BMD .
To take advantage of the abovementioned behavior of most tokens trending to zero, assets traded in the BMD are systematically updated on a quarterly basis with available liquidity being an important consideration for the tokens to be eligible for selection.
FINAL SUMMARY
The STAR Framework represents a new generation of portfolio grade trading infrastructure, built around disciplined execution, realized equity, and adaptive position sizing. It is designed to support any number of future methodologies - beginning with BMD .
The Bear Market Defender is here to hedge out commonly long biased portfolio allocations in the Crypto market, specializing in bringing uncorrelated returns during periods of sideways price action on Bitcoin, or whole-market downturns.
Together, STAR + BMD deliver a scalable, volatility tuned system that prioritizes capital preservation, signal accuracy, and adaptive risk allocation. Whether deployed standalone or within a broader portfolio, this framework is engineered for high performance, longevity, and adaptability in the ever-evolving crypto landscape.

Bearish Cassiopeia C Harmonic Patterns [theEccentricTrader]█ OVERVIEW
This indicator automatically detects and draws bearish Cassiopeia C harmonic patterns and price projections derived from the ranges that constitute the patterns.
Cassiopeia A, B and C harmonic patterns are patterns that I created/discovered myself. They are all inspired by the Cassiopeia constellation and each one is based on different rotations of the constellation as it moves through the sky. The range ratios are also based on the constellation's right ascension and declination listed on Wikipedia:
Right ascension 22h 57m 04.5897s–03h 41m 14.0997s
Declination 77.6923447°–48.6632690°
en.wikipedia.org
I actually developed this idea quite a while ago now but have not felt audacious enough to introduce a new harmonic pattern, let alone 3 at the same time! But I have since been able to run backtests on tick data going back to 2002 across a variety of market and timeframe combinations and have learned that the Cassiopeia patterns can certainly hold their own against the currently known harmonic patterns.
I would also point out that the Cassiopeia constellation does actually look like a harmonic pattern and the Cassiopeia A star is literally the 'strongest source of radio emission in the sky beyond the solar system', so its arguably more of a real harmonic phenomenon than the current patterns.
www.britannica.com
chandra.si.edu
█ CONCEPTS
Green and Red Candles
• A green candle is one that closes with a close price equal to or above the price it opened.
• A red candle is one that closes with a close price that is lower than the price it opened.
Swing Highs and Swing Lows
• A swing high is a green candle or series of consecutive green candles followed by a single red candle to complete the swing and form the peak.
• A swing low is a red candle or series of consecutive red candles followed by a single green candle to complete the swing and form the trough.
Peak and Trough Prices (Basic)
• The peak price of a complete swing high is the high price of either the red candle that completes the swing high or the high price of the preceding green candle, depending on which is higher.
• The trough price of a complete swing low is the low price of either the green candle that completes the swing low or the low price of the preceding red candle, depending on which is lower.
Historic Peaks and Troughs
The current, or most recent, peak and trough occurrences are referred to as occurrence zero. Previous peak and trough occurrences are referred to as historic and ordered numerically from right to left, with the most recent historic peak and trough occurrences being occurrence one.
Range
The range is simply the difference between the current peak and current trough prices, generally expressed in terms of points or pips.
Upper Trends
• A return line uptrend is formed when the current peak price is higher than the preceding peak price.
• A downtrend is formed when the current peak price is lower than the preceding peak price.
• A double-top is formed when the current peak price is equal to the preceding peak price.
Lower Trends
• An uptrend is formed when the current trough price is higher than the preceding trough price.
• A return line downtrend is formed when the current trough price is lower than the preceding trough price.
• A double-bottom is formed when the current trough price is equal to the preceding trough price.
Muti-Part Upper and Lower Trends
• A multi-part return line uptrend begins with the formation of a new return line uptrend and continues until a new downtrend ends the trend.
• A multi-part downtrend begins with the formation of a new downtrend and continues until a new return line uptrend ends the trend.
• A multi-part uptrend begins with the formation of a new uptrend and continues until a new return line downtrend ends the trend.
• A multi-part return line downtrend begins with the formation of a new return line downtrend and continues until a new uptrend ends the trend.
Double Trends
• A double uptrend is formed when the current trough price is higher than the preceding trough price and the current peak price is higher than the preceding peak price.
• A double downtrend is formed when the current peak price is lower than the preceding peak price and the current trough price is lower than the preceding trough price.
Muti-Part Double Trends
• A multi-part double uptrend begins with the formation of a new uptrend that proceeds a new return line uptrend, and continues until a new downtrend or return line downtrend ends the trend.
• A multi-part double downtrend begins with the formation of a new downtrend that proceeds a new return line downtrend, and continues until a new uptrend or return line uptrend ends the trend.
Wave Cycles
A wave cycle is here defined as a complete two-part move between a swing high and a swing low, or a swing low and a swing high. The first swing high or swing low will set the course for the sequence of wave cycles that follow; for example a chart that begins with a swing low will form its first complete wave cycle upon the formation of the first complete swing high and vice versa.
Figure 1.
Retracement and Extension Ratios
Retracement and extension ratios are calculated by dividing the current range by the preceding range and multiplying the answer by 100. Retracement ratios are those that are equal to or below 100% of the preceding range and extension ratios are those that are above 100% of the preceding range.
Fibonacci Retracement and Extension Ratios
The Fibonacci sequence is a series of numbers in which each number is the sum of the two preceding numbers, starting with 0 and 1. For example 0 + 1 = 1, 1 + 1 = 2, 1 + 2 = 3, and so on. Ultimately, we could go on forever but the first few numbers in the sequence are as follows: 0 , 1, 1, 2, 3, 5, 8, 13, 21, 34, 55, 89, 144.
The extension ratios are calculated by dividing each number in the sequence by the number preceding it. For example 0/1 = 0, 1/1 = 1, 2/1 = 2, 3/2 = 1.5, 5/3 = 1.6666..., 8/5 = 1.6, 13/8 = 1.625, 21/13 = 1.6153..., 34/21 = 1.6190..., 55/34 = 1.6176..., 89/55 = 1.6181..., 144/89 = 1.6179..., and so on. The retracement ratios are calculated by inverting this process and dividing each number in the sequence by the number proceeding it. For example 0/1 = 0, 1/1 = 1, 1/2 = 0.5, 2/3 = 0.666..., 3/5 = 0.6, 5/8 = 0.625, 8/13 = 0.6153..., 13/21 = 0.6190..., 21/34 = 0.6176..., 34/55 = 0.6181..., 55/89 = 0.6179..., 89/144 = 0.6180..., and so on.
1.618 is considered to be the 'golden ratio', found in many natural phenomena such as the growth of seashells and the branching of trees. Some now speculate the universe oscillates at a frequency of 0,618 Hz, which could help to explain such phenomena, but this theory has yet to be proven.
Traders and analysts use Fibonacci retracement and extension indicators, consisting of horizontal lines representing different Fibonacci ratios, for identifying potential levels of support and resistance. Fibonacci ranges are typically drawn from left to right, with retracement levels representing ratios inside of the current range and extension levels representing ratios extended outside of the current range. If the current wave cycle ends on a swing low, the Fibonacci range is drawn from peak to trough. If the current wave cycle ends on a swing high the Fibonacci range is drawn from trough to peak.
Harmonic Patterns
The concept of harmonic patterns in trading was first introduced by H.M. Gartley in his book "Profits in the Stock Market", published in 1935. Gartley observed that markets have a tendency to move in repetitive patterns, and he identified several specific patterns that he believed could be used to predict future price movements.
Since then, many other traders and analysts have built upon Gartley's work and developed their own variations of harmonic patterns. One such contributor is Larry Pesavento, who developed his own methods for measuring harmonic patterns using Fibonacci ratios. Pesavento has written several books on the subject of harmonic patterns and Fibonacci ratios in trading. Another notable contributor to harmonic patterns is Scott Carney, who developed his own approach to harmonic trading in the late 1990s and also popularised the use of Fibonacci ratios to measure harmonic patterns. Carney expanded on Gartley's work and also introduced several new harmonic patterns, such as the Shark pattern and the 5-0 pattern.
The bullish and bearish Gartley patterns are the oldest recognized harmonic patterns in trading and all the other harmonic patterns are ultimately modifications of the original Gartley patterns. Gartley patterns are fundamentally composed of 5 points, or 4 waves.
Bullish and Bearish Cassiopeia C Harmonic Patterns
• Bullish Cassiopeia C patterns are fundamentally composed of three troughs and two peaks. The second peak being higher than the first peak. And the third trough being lower than both the first and second troughs, while the second trough is higher than the first.
• Bearish Cassiopeia C patterns are fundamentally composed of three peaks and two troughs. The second trough being lower than the first trough. And the third peak being higher than both the first and second peaks, while the second peak is lower than the first.
The ratio measurements I use to detect the patterns are as follows:
• Wave 1 of the pattern, generally referred to as XA, has no specific ratio requirements.
• Wave 2 of the pattern, generally referred to as AB, should retrace by at least 11.34%, but no further than 22.31% of the range set by wave 1.
• Wave 3 of the pattern, generally referred to as BC, should extend by at least 225.7%, but no further than 341% of the range set by wave 2.
• Wave 4 of the pattern, generally referred to as CD, should retrace by at least 77.69%, but no further than 88.66% of the range set by wave 3.
Measurement Tolerances
In general, tolerance in measurements refers to the allowable variation or deviation from a specific value or dimension. It is the range within which a particular measurement is considered to be acceptable or accurate. In this script I have applied this concept to the measurement of harmonic pattern ratios to increase to the frequency of pattern occurrences.
For example, the AB measurement of Gartley patterns is generally set at around 61.8%, but with such specificity in the measuring requirements the patterns are very rare. We can increase the frequency of pattern occurrences by setting a tolerance. A tolerance of 10% to both downside and upside, which is the default setting for all tolerances, means we would have a tolerable measurement range between 51.8-71.8%, thus increasing the frequency of occurrence.
█ FEATURES
Inputs
• AB Lower Tolerance
• AB Upper Tolerance
• BC Lower Tolerance
• BC Upper Tolerance
• CD Lower Tolerance
• CD Upper Tolerance
• Pattern Color
• Label Color
• Show Projections
• Extend Current Projection Lines
Alerts
Users can set alerts for when the patterns occur.
█ LIMITATIONS
All green and red candle calculations are based on differences between open and close prices, as such I have made no attempt to account for green candles that gap lower and close below the close price of the preceding candle, or red candles that gap higher and close above the close price of the preceding candle. This may cause some unexpected behaviour on some markets and timeframes. I can only recommend using 24-hour markets, if and where possible, as there are far fewer gaps and, generally, more data to work with.
█ NOTES
I know a few people have been requesting a single indicator that contains all my patterns and I definitely hear you on that one. However, I have been very busy working on other projects while trying to trade and be a human at the same time. For now I am going to maintain my original approach of releasing each pattern individually so as to maintain consistency. But I am now also working on getting my some of my libraries ready for public release and in doing so I will finally be able to fit all patterns into one script. I will also be giving my scripts some TLC by making them cleaner once I have the libraries up and running. Please bear with me in the meantime, this may take a while. Cheers!

Bearish Cassiopeia B Harmonic Patterns [theEccentricTrader]█ OVERVIEW
This indicator automatically detects and draws bearish Cassiopeia B harmonic patterns and price projections derived from the ranges that constitute the patterns.
Cassiopeia A, B and C harmonic patterns are patterns that I created/discovered myself. They are all inspired by the Cassiopeia constellation and each one is based on different rotations of the constellation as it moves through the sky. The range ratios are also based on the constellation's right ascension and declination listed on Wikipedia:
Right ascension 22h 57m 04.5897s–03h 41m 14.0997s
Declination 77.6923447°–48.6632690°
en.wikipedia.org
I actually developed this idea quite a while ago now but have not felt audacious enough to introduce a new harmonic pattern, let alone 3 at the same time! But I have since been able to run backtests on tick data going back to 2002 across a variety of market and timeframe combinations and have learned that the Cassiopeia patterns can certainly hold their own against the currently known harmonic patterns.
I would also point out that the Cassiopeia constellation does actually look like a harmonic pattern and the Cassiopeia A star is literally the 'strongest source of radio emission in the sky beyond the solar system', so its arguably more of a real harmonic phenomenon than the current patterns.
www.britannica.com
chandra.si.edu
█ CONCEPTS
Green and Red Candles
• A green candle is one that closes with a close price equal to or above the price it opened.
• A red candle is one that closes with a close price that is lower than the price it opened.
Swing Highs and Swing Lows
• A swing high is a green candle or series of consecutive green candles followed by a single red candle to complete the swing and form the peak.
• A swing low is a red candle or series of consecutive red candles followed by a single green candle to complete the swing and form the trough.
Peak and Trough Prices (Basic)
• The peak price of a complete swing high is the high price of either the red candle that completes the swing high or the high price of the preceding green candle, depending on which is higher.
• The trough price of a complete swing low is the low price of either the green candle that completes the swing low or the low price of the preceding red candle, depending on which is lower.
Historic Peaks and Troughs
The current, or most recent, peak and trough occurrences are referred to as occurrence zero. Previous peak and trough occurrences are referred to as historic and ordered numerically from right to left, with the most recent historic peak and trough occurrences being occurrence one.
Range
The range is simply the difference between the current peak and current trough prices, generally expressed in terms of points or pips.
Upper Trends
• A return line uptrend is formed when the current peak price is higher than the preceding peak price.
• A downtrend is formed when the current peak price is lower than the preceding peak price.
• A double-top is formed when the current peak price is equal to the preceding peak price.
Lower Trends
• An uptrend is formed when the current trough price is higher than the preceding trough price.
• A return line downtrend is formed when the current trough price is lower than the preceding trough price.
• A double-bottom is formed when the current trough price is equal to the preceding trough price.
Muti-Part Upper and Lower Trends
• A multi-part return line uptrend begins with the formation of a new return line uptrend and continues until a new downtrend ends the trend.
• A multi-part downtrend begins with the formation of a new downtrend and continues until a new return line uptrend ends the trend.
• A multi-part uptrend begins with the formation of a new uptrend and continues until a new return line downtrend ends the trend.
• A multi-part return line downtrend begins with the formation of a new return line downtrend and continues until a new uptrend ends the trend.
Double Trends
• A double uptrend is formed when the current trough price is higher than the preceding trough price and the current peak price is higher than the preceding peak price.
• A double downtrend is formed when the current peak price is lower than the preceding peak price and the current trough price is lower than the preceding trough price.
Muti-Part Double Trends
• A multi-part double uptrend begins with the formation of a new uptrend that proceeds a new return line uptrend, and continues until a new downtrend or return line downtrend ends the trend.
• A multi-part double downtrend begins with the formation of a new downtrend that proceeds a new return line downtrend, and continues until a new uptrend or return line uptrend ends the trend.
Wave Cycles
A wave cycle is here defined as a complete two-part move between a swing high and a swing low, or a swing low and a swing high. The first swing high or swing low will set the course for the sequence of wave cycles that follow; for example a chart that begins with a swing low will form its first complete wave cycle upon the formation of the first complete swing high and vice versa.
Figure 1.
Retracement and Extension Ratios
Retracement and extension ratios are calculated by dividing the current range by the preceding range and multiplying the answer by 100. Retracement ratios are those that are equal to or below 100% of the preceding range and extension ratios are those that are above 100% of the preceding range.
Fibonacci Retracement and Extension Ratios
The Fibonacci sequence is a series of numbers in which each number is the sum of the two preceding numbers, starting with 0 and 1. For example 0 + 1 = 1, 1 + 1 = 2, 1 + 2 = 3, and so on. Ultimately, we could go on forever but the first few numbers in the sequence are as follows: 0 , 1, 1, 2, 3, 5, 8, 13, 21, 34, 55, 89, 144.
The extension ratios are calculated by dividing each number in the sequence by the number preceding it. For example 0/1 = 0, 1/1 = 1, 2/1 = 2, 3/2 = 1.5, 5/3 = 1.6666..., 8/5 = 1.6, 13/8 = 1.625, 21/13 = 1.6153..., 34/21 = 1.6190..., 55/34 = 1.6176..., 89/55 = 1.6181..., 144/89 = 1.6179..., and so on. The retracement ratios are calculated by inverting this process and dividing each number in the sequence by the number proceeding it. For example 0/1 = 0, 1/1 = 1, 1/2 = 0.5, 2/3 = 0.666..., 3/5 = 0.6, 5/8 = 0.625, 8/13 = 0.6153..., 13/21 = 0.6190..., 21/34 = 0.6176..., 34/55 = 0.6181..., 55/89 = 0.6179..., 89/144 = 0.6180..., and so on.
1.618 is considered to be the 'golden ratio', found in many natural phenomena such as the growth of seashells and the branching of trees. Some now speculate the universe oscillates at a frequency of 0,618 Hz, which could help to explain such phenomena, but this theory has yet to be proven.
Traders and analysts use Fibonacci retracement and extension indicators, consisting of horizontal lines representing different Fibonacci ratios, for identifying potential levels of support and resistance. Fibonacci ranges are typically drawn from left to right, with retracement levels representing ratios inside of the current range and extension levels representing ratios extended outside of the current range. If the current wave cycle ends on a swing low, the Fibonacci range is drawn from peak to trough. If the current wave cycle ends on a swing high the Fibonacci range is drawn from trough to peak.
Harmonic Patterns
The concept of harmonic patterns in trading was first introduced by H.M. Gartley in his book "Profits in the Stock Market", published in 1935. Gartley observed that markets have a tendency to move in repetitive patterns, and he identified several specific patterns that he believed could be used to predict future price movements.
Since then, many other traders and analysts have built upon Gartley's work and developed their own variations of harmonic patterns. One such contributor is Larry Pesavento, who developed his own methods for measuring harmonic patterns using Fibonacci ratios. Pesavento has written several books on the subject of harmonic patterns and Fibonacci ratios in trading. Another notable contributor to harmonic patterns is Scott Carney, who developed his own approach to harmonic trading in the late 1990s and also popularised the use of Fibonacci ratios to measure harmonic patterns. Carney expanded on Gartley's work and also introduced several new harmonic patterns, such as the Shark pattern and the 5-0 pattern.
The bullish and bearish Gartley patterns are the oldest recognized harmonic patterns in trading and all the other harmonic patterns are ultimately modifications of the original Gartley patterns. Gartley patterns are fundamentally composed of 5 points, or 4 waves.
Bullish and Bearish Cassiopeia B Harmonic Patterns
• Bullish Cassiopeia B patterns are fundamentally composed of three troughs and two peaks. The second peak being lower than the first peak. And the third trough being lower than both the first and second troughs, while the second trough is also lower than the first.
• Bearish Cassiopeia B patterns are fundamentally composed of three peaks and two troughs. The second trough being higher than the first trough. And the third peak being higher than both the first and second peaks, while the second peak is also higher than the first.
The ratio measurements I use to detect the patterns are as follows:
• Wave 1 of the pattern, generally referred to as XA, has no specific ratio requirements.
• Wave 2 of the pattern, generally referred to as AB, should retrace by at least 11.34%, but no further than 22.31% of the range set by wave 1.
• Wave 3 of the pattern, generally referred to as BC, should extend by at least 225.7%, but no further than 341% of the range set by wave 2.
• Wave 4 of the pattern, generally referred to as CD, should retrace by at least 77.69%, but no further than 88.66% of the range set by wave 3.
Measurement Tolerances
In general, tolerance in measurements refers to the allowable variation or deviation from a specific value or dimension. It is the range within which a particular measurement is considered to be acceptable or accurate. In this script I have applied this concept to the measurement of harmonic pattern ratios to increase to the frequency of pattern occurrences.
For example, the AB measurement of Gartley patterns is generally set at around 61.8%, but with such specificity in the measuring requirements the patterns are very rare. We can increase the frequency of pattern occurrences by setting a tolerance. A tolerance of 10% to both downside and upside, which is the default setting for all tolerances, means we would have a tolerable measurement range between 51.8-71.8%, thus increasing the frequency of occurrence.
█ FEATURES
Inputs
• AB Lower Tolerance
• AB Upper Tolerance
• BC Lower Tolerance
• BC Upper Tolerance
• CD Lower Tolerance
• CD Upper Tolerance
• Pattern Color
• Label Color
• Show Projections
• Extend Current Projection Lines
Alerts
Users can set alerts for when the patterns occur.
█ LIMITATIONS
All green and red candle calculations are based on differences between open and close prices, as such I have made no attempt to account for green candles that gap lower and close below the close price of the preceding candle, or red candles that gap higher and close above the close price of the preceding candle. This may cause some unexpected behaviour on some markets and timeframes. I can only recommend using 24-hour markets, if and where possible, as there are far fewer gaps and, generally, more data to work with.
█ NOTES
I know a few people have been requesting a single indicator that contains all my patterns and I definitely hear you on that one. However, I have been very busy working on other projects while trying to trade and be a human at the same time. For now I am going to maintain my original approach of releasing each pattern individually so as to maintain consistency. But I am now also working on getting my some of my libraries ready for public release and in doing so I will finally be able to fit all patterns into one script. I will also be giving my scripts some TLC by making them cleaner once I have the libraries up and running. Please bear with me in the meantime, this may take a while. Cheers!
