ATR CHANNEL .2Channel based on 100MA & daily ATR / volatility - whole point is to warn and show you where not to participate. Signals can be considered as higher probability trades, short term reversal type scalps - especially effective at FX and stock trading
Scalping

[astropark] Renko OBV divergencesDear Followers,
today a new great Scalper Tool , based on Ob Balance Volume (OBV) oscillator, which works from 1 minute timeframe Renko chart , which is the best and more secure timeframe to use on a Renko chart. But of course it works great on all timeframes (included the 1D timeframe), both on FOREX and on Cryptocurrencies!
This tool has some cool features:
it works on all timeframes , starting from 1 minute: so you can enjoy high-frequency trading by using a 24/7 running bot and a proper money and risk management strategy
it shows you both bullish and bearish divergences with a triangle up or down respectively
when it finds a strong bullish/bearish divergence , a flag will be displayed instead of a triangle
This script will let you set all notifications you may need in order to be alerted on each triggered divergence.
You may like to use it together with my Renko Scalper V2
and my Renko RSI Divergences indicator
On Bitmex/ByBit/Binance Bitcoin/USD chart best settings is Traditional Renko chart with 10$ box size, while 0.5$ box size is suggested on Ethereum/USD pair.
This is a premium indicator , so send me a private message in order to get access to this script.

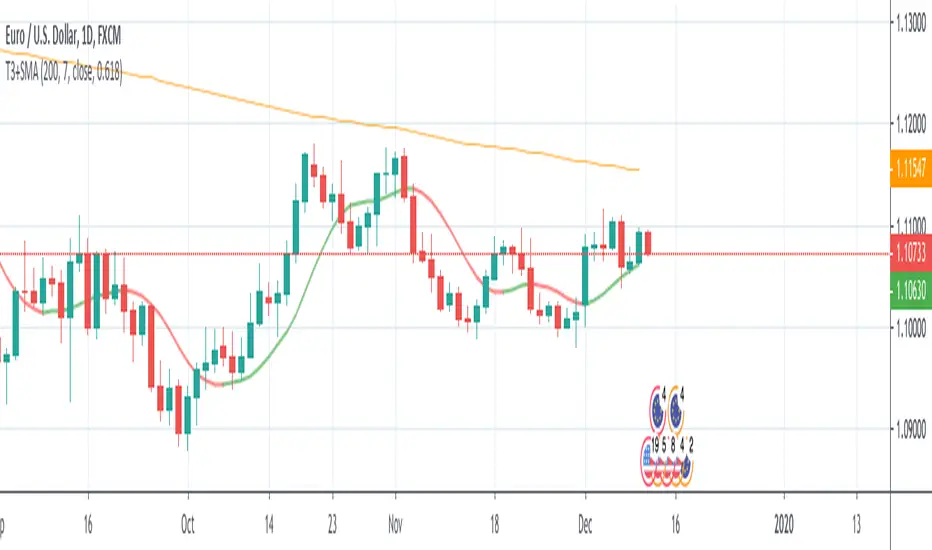
T3+SMA This source code is subject to the terms of the Mozilla Public License 2.0 at mozilla.org
© 03.freeman
This strategy is based only on T3 moving average, but uses sma 200 as filter for enter long or short.
The default settings considers a daily timeframe.
The strategy is very simple: long if T3 increase, short if T3 decrease.
Note that if you set volume factor to 0 you will have an exponential moving average, while if you set to 1 you'll get a DEMA.
Expert studio strategy 1 - GBPUSDThis is part of a series of strategies developed automatically by a online software.
I cannot share the site url, which is not related to me in any way, because it is against the TV reules.
This strategy was optimized for GBPUSD, timeframe 1D, fixed lots 0.1, initial balance 1000€.
LOGIC:
- LONG ENTRY when previous candle is bear
- LONG EXIT: RVI > signal line
- SHORT ENTRY when previous candle is bull
- SHORT EXIT: RVI < signal line
NOTE: I considered the open of actual candle instead of close otherwise there will be a back shift of 1 candle in pine script
Take profit = no
Stop loss = no
I have also a study with alarms.
Please use comment section for any feedback.

Urban TowersI translated a scalping system by Navin Prithyani into pine and want to share it with you.
Navin has a lot of resources for the system online including an extensive +60m video explaining the ins and outs.
Including links is against the house rules, so you'll have to DYOR.
Quick Criteria Overview:
---
- Can see through EMAs
- Entry above the signal candle
- Stop below the signal candle
- Targets include 1:1, trailing stop, and psychological levels
Why not give it a whirl? Back test it and share your results.
This is a fairly mechanical scalping system to be used on lower time frames.
I have programmed alerts into the system so you don't have to stare at your screen all day.
Happy profits y'all, enjoy the scalper.
Peace.

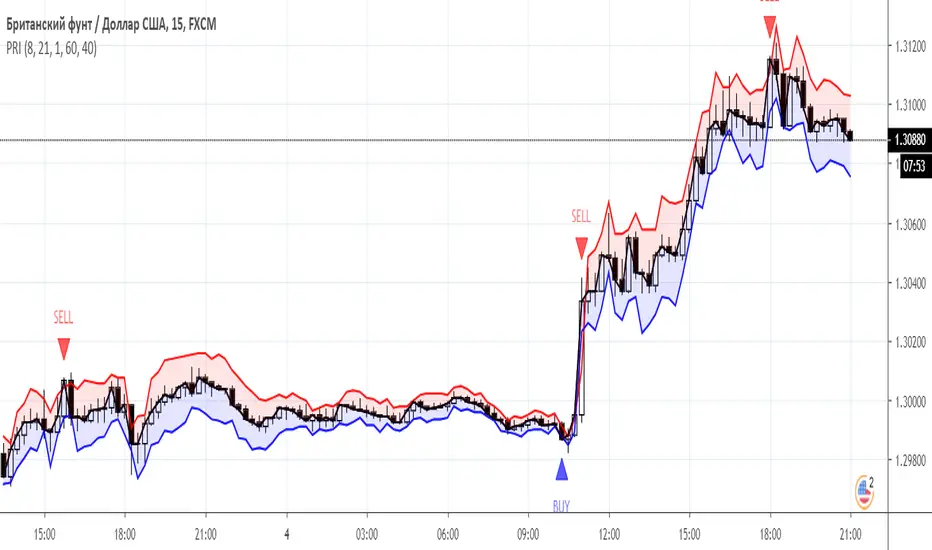
Price reversal intraday IndicatorIndicator “Price reversal intraday”
Class : oscillator
Trading type : scalping+intraday trading
Time frame : 15-30 min
Purpose : trading on rebounds and reversals
Level of aggressiveness : aggressive
“Price reversal intraday (PRI)” indicator is designed for aggressive intraday trading on rebounds and reversals. It belongs to oscillators. The idea that formed the basis for the creation of “Price reversal intraday (PRI)” is to obtain a synergistic effect from the use of the best oscillatory techniques: modified Bollinger bands and the classic RSI oscillator.
The indicator, using advanced Bollinger technique, monitors the deviation of the current price from the equilibrium value, and then with the help of the RSI oscillator it determines the moment when this deviation reaches a critical point. As a result, a buy or sell signal is generated, which is displayed on the chart in order to facilitate the trading process as much as possible.
Structure of the indicator
Indicator consists of the following elements:
- red zone – indication of a sell zone. Entry into this zone is a signal to close long positions and search for entry points to sell asset;
- red line – extremely high positive deviation of current price from its equilibrium value;
- blue zone - indication of a buy zone. Entry into this zone is a signal to close short positions and search for entry points to buy asset;
- blue line – extremely high negative deviation of current price from its equilibrium value.
Parameters of the indicator
To configure the indicator, the following parameters are provided:
- RSI_period (default value is 8) - period for calculating the RSI oscillator.
- Ranger_period (default value - 21) - period for calculating the modified Bollinger bands.
- Ranger_width (default value - 1) - the parameter used to control the level of aggressiveness of the indicator and frequency of signals. The lower it is, the more signals the indicator will generate. Possible values from 0 to 3.
- ob (the default value is 60) - this parameter defines the overbought zone for the RSI indicator.
- os (the default value is 40) - this parameter defines the oversold zone for the RSI indicator.
Rules of trading
The main task of the trader using indicator is to monitor the location of the current market price relative to the extreme zones (blue/red). Entering the red zone is a signal for closing long positions and searching for sell entry points. Entering the blue zone is a signal for closing short positions and searching for buy entry points.
The appearance of a blue triangle with the inscription “BUY” on the chart is a signal to open buy positions, and a red triangle with the inscription “SELL” is a signal for sale.
[astropark] Crypto Swing Trading [strategy]Dear Followers,
today a Swing Trading Strategy , runnable on a bot , which works great from 30m timeframe and above. Best suggested timeframes are 1h and 4h.
If you are a scalper, you will love suggested entries for fast profit. You can run it from 1 minute timeframe if you are used to scalp trading and close each trade whenever you fell happy (a proper trailing stop strategy is suggested anyway).
This strategy can trigger till 5 or 20 buy or sell signals in a row before reverting (it changes greatly depending on timeframe you use), so use a proper money management .
Strategy results are calculated on the timeframe from January 2018 to now, so on about 2 years, using 10000$ as initial capital and working at 3x leverage (very safe leverage!).
This is not the "Holy Grail", so use a proper risk management strategy.
This script will let you backtest this script.
The alarms version of this indicator, which will let you set all notifications you may need in order to be alerted on each triggered signals, can be found by searching for "Crypto Swing Trading" and then choosing the "alarms" version.
This is a premium indicator , so send me a private message in order to get access to this script.

Scalp Master V1.1This version has added support and resistance to help traders identify the best entry and exit points.
Also, we included a linear regression band to identify the last period's trend, the prices would normally swing between the upper and lower dotted white line and it gives a good starting point for traders to identify possible bounces or rejection moments of the price.

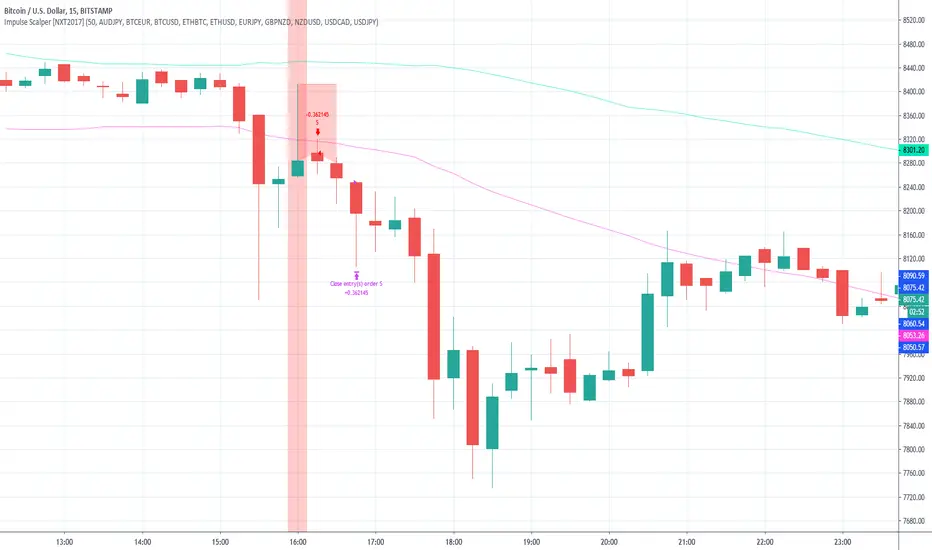
Impulse Scalper [NXT2017] - with included market scannerPrivate Indicator.
HI BIG PLAYERS,
with this indicator it is possible to analyze small rebound effects in the trading market and to scalp the movement into the trend again.
HOW IT WORKS
Hereby the indicator use a candleformation with a huge wick inside of a band, based on a Simple Moving Average on the 50 highs and 50 lows.
A signal is shown with vertical red/green background around the bar for selling/buying. Furthermore, the high/low of the signal serves as StopLoss line and makes a horizontal red line inside the active trading time. The trade is to closing if the second candle after the signal is finished.
For example:
1. candle => signal
2. candle => entry on open price with the SL
3. candle => nothing to do
4. candle => close your trade after candle 3 is finished
For the analysis I have set the following settings:
Initial Capital: 100 000 (the default setting)
Base Currency: USD
OrderSize: 3% of equity
Pyramiding: 1 orders
Commission 0%
Verify Price For Limit Orders: 0 ticks
Slippage 0 ticks
Recalculate:
After Order is Filled (deactived)
On Every Tick (deactived)
A market scanner is also integrated in this indicator. Since good signals rarely occur in a market, the market scanner allows up to 10 markets to browse for the signals simultaneously. My favorite markets are currently selected as default.
The 10 default markets are:
AUDJPY
BTCEUR
BTCUSD
ETHBTC
ETHUSD
EURJPY
GBPNZD
NZDUSD
USDCAD
USDJPY
Market Scanner in action (in the settings you can also hide the labels):
Of course, alerts are also possible with the TradingView Alerts system. For example it's possible to get a message per signal to your e-mail, that you use on TradingView.
Access to the indicator: use the link below, thanks for your attention!
Kind regards
NXT2017
Scalp Master V 1.0The Scalp Master is designed for new and experienced trainers to get a better understanding of sudden direction changes in the cryptocurrencies markets, by displaying just 2 basic signals: "Up" or "Down".
It combines the T.A of a group of indicators to give you the most sensitive tool to catch a Pump or Dump before it happens. It also includes one of the most basic and powerful tools to understand how the market is going to behave: Bollinger Bands, if we get an "Up" signal near the lower Bollinger band, we might be close to a good pump and if we get a "Down" signal near the top Bollinger band a dump in the price will most likely happen.
Enjoy!!!

Chidams Indicator Beta 1Normal mode is good for trend reversals
While scalp mode is oriented for intraday traders
Please note that it is safer to wait for candle closure

TraderTroys 5MMSRTraderTroys 5 Minute Major Support / Resistance Indicator
This is to only be used on the 5 minute time frame. It's sole purpose is to reveal up coming major support and resistance.
Green = Less reliable
Yellow = More reliable
Red = Very reliable
However, I would recommend back testing this *by applying it to your chart and watching how price action plays with the lines.*
I would not recommend only trading based off this indicator, but use it as a form of confluence with others.
It's built around multiplications of the average price.
Here is a great example of it working:

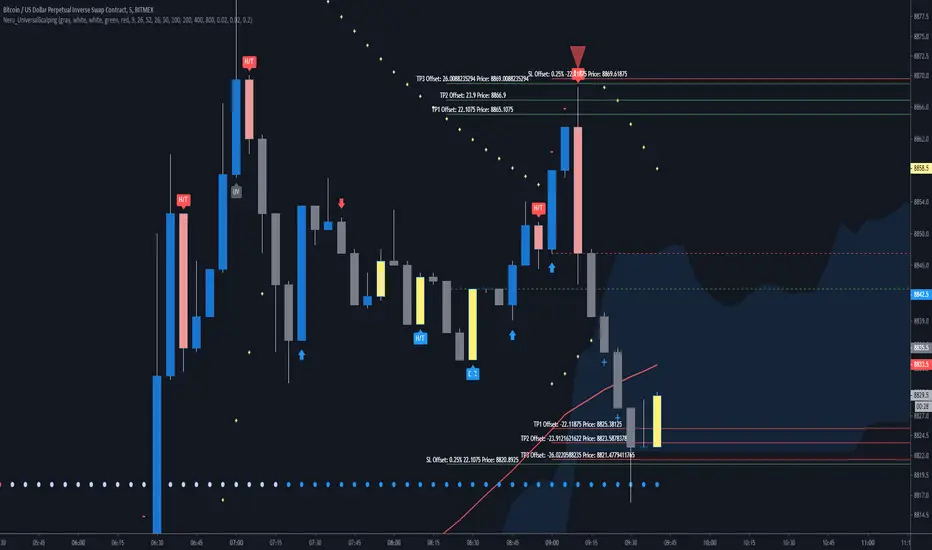
Neru_UniversalScalpingNeru_UniversalScalping - Tool
Markets: All markets, this is a universal tool which is using 100% standard settings for all built-in indicators.
Interval: 3 minutes to maximum 2 hours.
Built-In indicators:
- Basic Candlesticks (E/R as stronger one and H/T as weaker one)
- Stochastic breakups and breakdowns shown in different candle colors (close, 20 and 80)
- Extreme overbought and oversold conditions marked with a + an - (Stochastic >95 and <5)
- Daily and 4H Pivot Points
- Ichimoku Cloud (including Senkou´s, Tenkan + Kijun)
- 5 SMA´s (50,100,200,400 and 800)
- TrendEvaluator at the bottom, showing a basic trend (calculated from the cloud and 3 Moving Averages, 50, 100 and 200)
- Temporary buying + selling pressure labelled as arrows above and below candles
- Standard Parabolic Sar built-in
Risk Management:
You have the option to plot a basic risk calculation into the charts, based on the assumption, you don´t use a leverage and 100% equity.
Shown is a stop loss offset, the % and the price. Same goes for 3 take profits. Fees and spread are NOT included in this calculations.
You can choose between 0.25%, 0.5%, 1% and 1.5%, obviously the smaller the timeframe, the smaller risk you need to consider.
General Information:
All settings are adjustable, also in color and position.
This is not an automated system, that is generating entries and exits. With help of the built-in alarms you will have always to consider
the environment such as the trend, the relative position to the Pivot Points, the relative position to the Moving Averages and for example
conditions such as oversold / overbought and key-levels. It´s not replacing a human.
Please always be aware that counter trades on pullbacks are always more risky than trend-follow trades and a beginner should stick to less risk.
Warm regards, Neru
M waves Mk3 'Magical M's v1
V2
V3
So I forgot this existed so here is the Opened sourced code (pm me for older sorce code there are 600+ Saves)(pm me for other scrips course code too lazy to republish everything)
Changes: Simplified and annotated code/upgraded to v4 format
as always adjust before using
i use this indicator combined with the other frequency one to help me identify time and direction of next move.
Pair with rsi
Pair with detrended tsi (have unpublished script might share later)
‘Redraw’ safe
Slightly detrented(adjustable) to avoid traps
quick how to use:
Meant as and adjustable indicator to “tune" to personal risk/reward preference
Green means buy red means sell
arrow indicators for long term sell and buy
Highly customizable (candles too)
Check out my profile for previous versions they are less customizable but also easier to get started with
similar to rsi you want to buy/sell when the indicator turns green/red and lines are as pinched as posible (the lines that are being filled).
keep an eye on the other line that moves around ;) if its not matching the other 2 moving averages and the main color indicator chances are its a trap(works both ways)
use the candles to help you keep your eye on the indicator when scalping (look at the original post for some color ideas)

L&S PROFIT SCALP Indicator for scalp trades for TF 1-15 minutes. 1-4 signals per day depending on the currency pair. Suitable for all crypto exchanges, Forex, binary options. Signals+ take profit Levels.

ScalpSnakeA simple Scalping tool, based off of ATR multiples. Long above the line...Short below it. Adjust the length of signal calculation, and the Multiple of the Asset's ATR to loosen/tighten signals as desired...
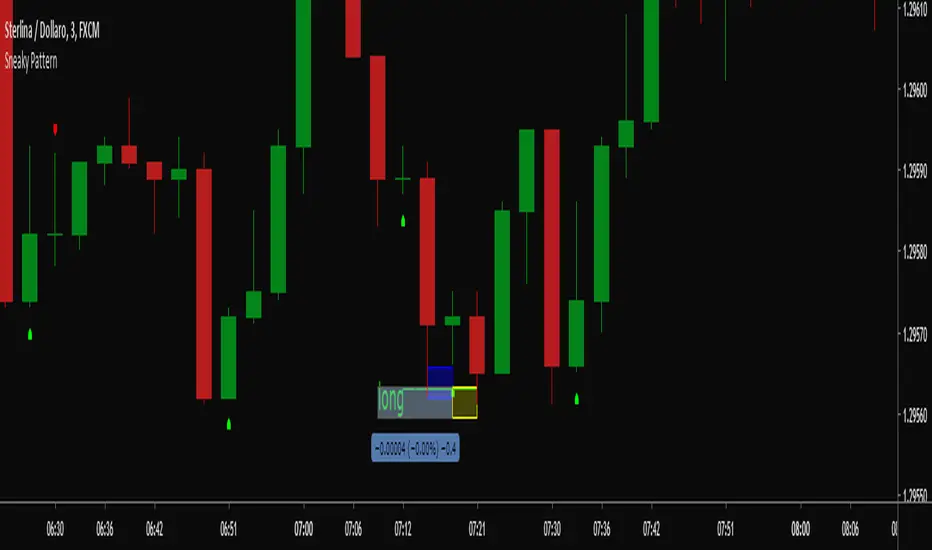
Sneaky PatternSneaky pattern to grab some point on low TF with minimum risk
USE ON LOW TF: 1M TO 10M
the way to use is described on picture below.
The blue are is the order area
Once you order is hit (in this case long position) you can locate you stop-loss sticky (in this case I used the blue area = yellow area price spread to set stop-loss)
Bollinger Bands JuanSeNL Strategy Bitmex 15min
It is a conservative strategy that works in bitmex in a 15-minute time frame, identifies an oversold market and sells on the rebound
It has a modifiable takeprofit and stoploss but works fine as it is set by default
Only Longs

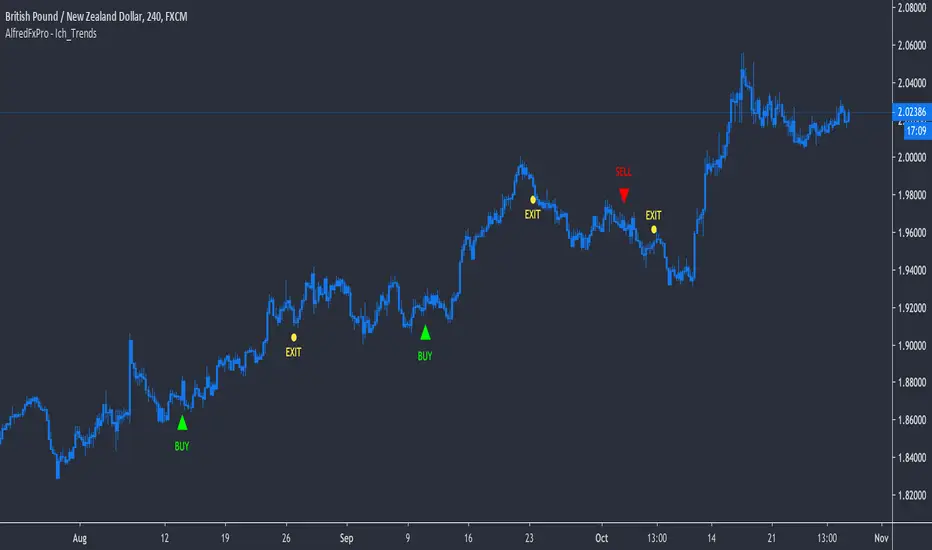
AlfredFxPro - Ichimoku_Trends_AlertsOur powerful Ichimoku Trend Following Scalping Indicator now with LIVE Alerts ( Buy, Sell, Exit Buy, Exit Sell) straight to your PC + Mobile.
*** NO REPAINT *** What you see is what you get. It will fire a signal as soon as the bar close
The (AlfredFxPro - Ich_Trends) uses one element of the famous Ichimoku and combine the signal with two custom volatility indicators to predict potential trends and determine the strength of the trend to keep you in as long as the trend is running or get you out as soon as possible with min loss.
Combine the signal with price action breakout patterns and you have a solid indicator.
It's a very powerful tool to add to your analysis, and make it your own.
**Try on Demo First**
Works best on high volatility instruments
Works on All Assets ( Forex, Crypto, Commodities , Gold , Stocks)
Suggested Timeframes (15min, 30min, 1Hr, 4Hr, D)
*************************
Send us a message for Access!
THIS INDICATOR IS PRIVATE & AVAILABLE FOR MEMBERS ONLY!
**************************
How to Set Alerts :
**Example Buy Signal Alert
-> Go to GBP/NZD 4Hr Timeframe
-> Click Add new Alert
-> Condition -> Select : AlfredFxPro - Ich_Trends
-> Select : Buy Alert
-> Option : Once Per Bar Close
-> Notify on App + POP Up
-> Message: Write: ""Buy 4Hr""
-------------------------------------------
**Example Exit Buy Signal Alert
-> Go to GBP/NZD 4Hr Timeframe
-> Click Add new Alert
-> Condition -> Select : AlfredFxPro - Ich_Trends
-> Select : Long Exit Alert
-> Option : Once Per Bar Close
-> Notify on App + POP Up
-> Message: Write : ""Exit Buy 4Hr""
-------------------------------------------
You repeat the same process for "Sell, and Exit Sell" for any pair on any timeframe you want.
-------------------------------------------
**********Important***********
1) Enter on a Buy and Exit from the same time frame don't mix signals from time frames ( Treat each time frame as an individual trade).
2) Important to set the Alert option: ""Once Per Bar Close"", otherwise you'll get wrong signals.
*************************
Send us a message for Access!
THIS INDICATOR IS PRIVATE & AVAILABLE FOR MEMBERS ONLY!
**************************
[Aill3urs V.1.1.P] Study RogerThis INVIT-ONLY study is based on Noise / Fixe TP & SL / EMA and you can optimize it with trends and work on low timeframe < 5min
Please use comment section for any feedback.
For any question DM me for any request.
## DISCLAIMER
1. I am not licensed financial advisors or broker dealers. I do not tell you when or what to buy or sell. I developed this software which enables you execute manual or automated trades multiple trades using TradingView. The software allows you to set the criteria you want for entering and exiting trades.
2. Do not trade with money you cannot afford to lose.
3. I do not guarantee consistent profits or that anyone can make money with no effort. And I am not selling the holy grail.
4. Every system can have winning and losing streaks.
5. Money management plays a large role in the results of your trading. For example: lot size, account size, broker leverage, and broker margin call rules all have an effect on results. Also, your Take Profit and Stop Loss settings for individual pair trades and for overall account equity have a major impact on results. If you are new to trading and do not understand these items, then I recommend you seek education materials to further your knowledge.
**YOU NEED TO FIND AND USE THE TRADING SYSTEM THAT WORKS BEST FOR YOU AND YOUR TRADING TOLERANCE.**
**I HAVE PROVIDED NOTHING MORE THAN A TOOL WITH OPTIONS FOR YOU TO TRADE WITH THIS PROGRAM ON TRADINGVIEW.**

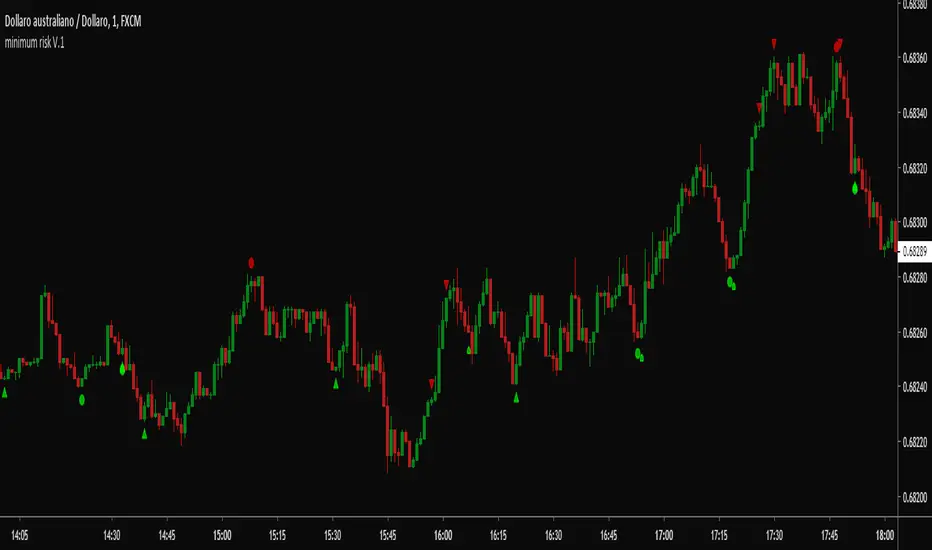
minimum risk V.1Was playing around and I've had this idea: most of day traders looking for catching price swings and sometimes they forgot about risk, so I was keeping focus not on price swings but on risk-momentum: the idea was to catch daily moments when the risk was minimum and this is the result.
There are some rules to use it correctly
1. Use it on lower timeframe (1M to 30M) best --> 1M to 5M
2. Do not open position on every signal !! keep focusing on the price
3. works better on Forex
upin and doin input: you can change it and you will see more signals but keep this inputs low as it is a filter I'm using for signals
I will update the indicator if I found new ideas
Enjoy!!