Volume Anomaly Reversal DetectionVolume Anomaly Reversal Detection (VARD System)
🎯 What This Indicator Does
This indicator identifies potential trend reversals by detecting abnormal volume activity that often precedes significant price movements. It combines volume anomaly detection with dynamic trend analysis to generate actionable BUY/SELL signals.
📊 Core Concept & Methodology
Volume Anomaly Detection
The indicator analyzes directional volume (buying vs selling pressure) from a lower timeframe and calculates Z-scores to identify statistically significant volume spikes.
Z-Score Formula:
Z = (Current Volume - Average Volume) / Standard Deviation
When volume exceeds the threshold (default: 3 standard deviations above mean), it signals unusual market activity - often caused by forced liquidations or capitulation.
Dynamic Trend Filter
A custom trend-following algorithm based on ATR (Average True Range) bands determines the current market direction:
Price above lower band = Uptrend
Price below upper band = Downtrend
Signal Logic
Volume anomaly detected during an existing trend
Trend reversal confirmed within the confirmation window
Signal generated = BUY or SELL label appears
⚙️ Settings Explained
SettingDefaultDescriptionAnalysis Timeframe15minLower timeframe for volume samplingStatistical Lookback200Bars used for Z-score calculationAnomaly Sensitivity3.0Z-score threshold (lower = more signals)Confirmation Window50Max bars between anomaly and trend flipATR Multiplier2.0Trend band widthTrend Period10ATR calculation length
📖 How To Use
Entry Signals
BUY: Green label appears below bar - consider long positions
SELL: Red label appears above bar - consider short positions
Volume Anomaly Markers (⬥)
Small diamonds indicate detected volume spikes
These are early warnings before confirmed signals
Useful for anticipating potential reversals
Trend Bands
Colored zones show active signal direction
Stay with the trend until opposite signal appears
Best Practices
Confirm with price action - Look for support/resistance levels
Use appropriate timeframes - Works on all timeframes, but 1H-4H recommended
Manage risk - Always use stop losses
Avoid ranging markets - Best in trending/volatile conditions
⚠️ Important Notes
No indicator is perfect - Use as part of a complete trading strategy
Volume data required - Will show warning if volume unavailable
Not financial advice - Always do your own research
🔔 Alerts Available
BUY Signal Confirmed
SELL Signal Confirmed
Volume Anomaly (Buy Setup)
Volume Anomaly (Sell Setup)
Scalping

Golden Vector Trend Orchestrator (GVTO)Golden Vector Trend Orchestrator (GVTO) is a composite trend-following strategy specifically engineered for XAUUSD (Gold) and volatile assets on H4 (4-Hour) and Daily timeframes.
This script aims to solve a common problem in trend trading: "Whipsaws in Sideways Markets." Instead of relying on a single indicator, GVTO employs a Multi-Factor Confluence System that filters out low-probability trades by requiring alignment across Trend Structure, Momentum, and Volatility.
🛠 Methodology & Logic
The strategy executes trades only when four distinct technical conditions overlap (Confluence). If any single condition is not met, the trade is filtered out to preserve capital.
1. Market Structure Filter (200 EMA)
Indicator: Exponential Moving Average (Length 200).
Logic: The 200 EMA acts as the baseline for the long-term trend regime.
Bullish Regime: Price must close above the 200 EMA.
Bearish Regime: Price must close below the 200 EMA.
Purpose: Prevents counter-trend trading against the macro direction.
2. Signal Trigger & Trailing Stop (Supertrend)
Indicator: Supertrend (ATR Length 14, Factor 3.5).
Logic: Uses Average True Range (ATR) to detect trend reversals while accounting for volatility.
Purpose: Provides the specific entry signal and acts as a dynamic trailing stop-loss to let profits run while cutting losses when the trend invalidates.
3. Volatility Gatekeeper (ADX Filter)
Indicator: Average Directional Index (Length 14).
Threshold: > 25.
Logic: A high ADX value indicates a strong trend presence, regardless of direction.
Purpose: This is the most critical filter. It prevents the strategy from entering trades during "choppy" or ranging markets (consolidation zones) where trend-following systems typically fail.
4. Momentum Confirmation (DMI)
Indicator: Directional Movement Index (DI+ and DI-).
Logic: Checks if the buying pressure (DI+) is physically stronger than selling pressure (DI-), or vice versa.
Purpose: Ensures that the price movement is backed by genuine momentum, not just a momentary price spike.
📋 How to Use This Strategy
🟢 LONG (BUY) Setup
A Buy signal is generated only when ALL of the following occur simultaneously:
Price Action: Price closes ABOVE the 200 EMA (Orange Line).
Trigger: Supertrend flips to GREEN (Bullish).
Strength: ADX is greater than 25 (Strong Trend).
Momentum: DI+ (Plus Directional Indicator) is greater than DI- (Minus).
🔴 SHORT (SELL) Setup
A Sell signal is generated only when ALL of the following occur simultaneously:
Price Action: Price closes BELOW the 200 EMA (Orange Line).
Trigger: Supertrend flips to RED (Bearish).
Strength: ADX is greater than 25 (Strong Trend).
Momentum: DI- (Minus Directional Indicator) is greater than DI+ (Plus).
🛡 Exit Strategy
Stop Loss / Take Profit: The strategy utilizes the Supertrend Line as a dynamic Trailing Stop.
Exit Long: When Supertrend turns Red.
Exit Short: When Supertrend turns Green.
Note: Traders can also use the real-time P/L Dashboard included in the script to manually secure profits based on their personal Risk:Reward ratio.
📊 Included Features
Real-Time P/L Dashboard: A table in the top-right corner displays the current trend status, ADX strength, and the Unrealized Profit/Loss % of the current active position.
Smart Labeling: Buy/Sell labels are coded to appear only on the initial entry trigger. They do not repaint and do not spam the chart if the trend continues (no pyramiding visualization).
Visual Aids: Background color changes (Green/Red) to visually represent the active trend based on the Supertrend status.
⚠️ Risk Warning & Best Practices
Asset Class: Optimized for XAUUSD (Gold) due to its high volatility nature. It also works well on Crypto (BTC, ETH) and Major Forex Pairs.
Timeframe: Highly recommended for H4 (4 Hours) or D1 (Daily). Using this on lower timeframes (M5, M15) may result in false signals due to market noise.
News Events: Automated strategies cannot predict economic news (CPI, NFP). Exercise caution or pause trading during high-impact economic releases.

Pulse Wave Matrix [SCALPER]════════════════════════════════════════════════════════════════════════════════
PULSE WAVE MATRIX - SCALPER EDITION | QUICK GUIDE
════════════════════════════════════════════════════════════════════════════════
█ WHAT IS PWM?
PWM detects when price is "coiling" (compression) and about to explode.
• ORANGE DOTS = Spring compressing (GET READY)
• GREEN DOT = Spring released (TAKE ACTION)
════════════════════════════════════════════════════════════════════════════════
█ READING THE INDICATOR
════════════════════════════════════════════════════════════════════════════════
HISTOGRAM BARS:
• BRIGHT CYAN = Strong bullish (best for longs)
• DARK CYAN = Bullish weakening (consider exit)
• BRIGHT RED = Strong bearish (best for shorts)
• DARK RED = Bearish weakening (consider exit)
CENTER DOTS:
• ORANGE = Compression active → WAIT
• GREEN = Compression released → LOOK FOR ENTRY
• GRAY = Normal market → SCAN
SIGNALS:
• ▲ Green Triangle = HIGH-PROBABILITY LONG
• ▼ Red Triangle = HIGH-PROBABILITY SHORT
• ● Small Circle = Quick scalp (lower probability)
════════════════════════════════════════════════════════════════════════════════
█ HOW TO TRADE (3 Simple Steps)
════════════════════════════════════════════════════════════════════════════════
STEP 1: WAIT FOR SETUP
→ Orange dots appear (compression)
→ Panel shows "Pulse: READY"
STEP 2: WAIT FOR TRIGGER
→ Green dot appears (released)
→ Triangle signal appears
→ Check histogram: CYAN = Long, RED = Short
STEP 3: EXECUTE
→ Enter on triangle signal
→ Set SL: 1.5x ATR below/above entry
→ Set TP: 2x SL distance
════════════════════════════════════════════════════════════════════════════════
█ ENTRY CHECKLIST
════════════════════════════════════════════════════════════════════════════════
BEFORE ENTERING, CONFIRM:
☑ Green dot visible (pulse released)
☑ Triangle or circle signal present
☑ Histogram color matches direction
☑ Panel "Trend" aligns with trade
☑ RSI not showing OB! or OS!
DO NOT ENTER IF:
✗ Still orange dots (not released)
✗ Trend opposite to signal
✗ RSI at extreme
✗ Major news coming
════════════════════════════════════════════════════════════════════════════════
█ EXIT RULES
════════════════════════════════════════════════════════════════════════════════
EXIT IMMEDIATELY:
• Stop loss hit
• Take profit hit
• Opposite triangle appears
EXIT SOON:
• Histogram color fading (bright → dark)
• New orange dots appear
════════════════════════════════════════════════════════════════════════════════
█ RISK MANAGEMENT
════════════════════════════════════════════════════════════════════════════════
• Risk 1-2% per trade MAX
• Stop after 3 losses in a row
• Maximum 5-7 trades per day
• Primary signals (▲▼) = Full size
• Quick signals (●) = Half size
════════════════════════════════════════════════════════════════════════════════
█ RECOMMENDED SETTINGS
════════════════════════════════════════════════════════════════════════════════
FOR 5-MINUTE CHARTS:
Pulse Length: 8 | Wave Length: 5
ATR Length: 7 | Signal Smooth: 2
SL Multiplier: 1.2 | TP Ratio: 1.5
FOR 15-MINUTE CHARTS:
Pulse Length: 10 | Wave Length: 6
ATR Length: 8 | Signal Smooth: 3
SL Multiplier: 1.5 | TP Ratio: 2.0
════════════════════════════════════════════════════════════════════════════════
█ BEST TRADING TIMES
════════════════════════════════════════════════════════════════════════════════
FOREX: 8:00 - 11:00 AM EST (London-NY overlap)
CRYPTO: 9:00 - 11:00 AM EST (US morning)
STOCKS: 10:30 - 11:30 AM EST (post-open)
AVOID: Major news events, low volume periods
════════════════════════════════════════════════════════════════════════════════
█ COMMON MISTAKES
════════════════════════════════════════════════════════════════════════════════
✗ Entering during orange dots (too early)
✗ Trading against trend filter
✗ Moving stop loss further away
✗ Taking every signal without filtering
✗ Overtrading (20+ trades/day)
════════════════════════════════════════════════════════════════════════════════
█ QUICK REFERENCE
════════════════════════════════════════════════════════════════════════════════
LONG TRADE:
Orange dots → Green dot → Cyan bars rising → ▲ Triangle → BUY
SHORT TRADE:
Orange dots → Green dot → Red bars falling → ▼ Triangle → SELL
HOLD UNTIL:
Histogram fades OR TP hit OR opposite signal
════════════════════════════════════════════════════════════════════════════════
█ REMEMBER
════════════════════════════════════════════════════════════════════════════════
• Wait for GREEN DOT before looking for entries
• Only trade when TREND aligns with signal
• Always use STOP LOSS - no exceptions
• Quality over quantity - skip weak setups
60% win rate + 1:2 RR = PROFITABLE
════════════════════════════════════════════════════════════════════════════════
GOOD LUCK & HAPPY SCALPING!
════════════════════════════════════════════════════════════════════════════════

MTF MACD Dynamic█ MACD PULSE MTF
Multi-timeframe MACD with 4-color dynamic histogram.
█ FEATURES
- Multi-timeframe support
- 4-color histogram (trend strength + direction)
- Dynamic MACD/Signal line colors
- Cross markers for entry signals
█ HOW TO USE
HISTOGRAM COLORS:
🟢 Bright Green = Bullish momentum increasing
🟢 Teal = Bullish momentum decreasing
🔴 Bright Red = Bearish momentum increasing
🟠 Orange = Bearish momentum decreasing
SIGNALS:
- Buy: Histogram turns green + MACD crosses above signal
- Sell: Histogram turns red + MACD crosses below signal
- Circle markers show exact cross points
█ SETTINGS
- Fast EMA: 12 (default)
- Slow EMA: 26 (default)
- Signal SMA: 9 (default)
- Custom timeframe: Select any TF while on current chart
█ TIPS
- Use higher timeframe for trend direction
- Combine with support/resistance levels
- Fading colors = potential reversal warning

Enhanced Divergence Scanner═══════════════════════════════════════════════════════════════════
TRADINGVIEW COMPLIANT POST - FOLLOWS ALL HOUSE RULES
═══════════════════════════════════════════════════════════════════
📌 TITLE:
Multi-Oscillator Divergence Detector with Pivot Validation
───────────────────────────────────────────────────────────────────
📝 COMPLIANT DESCRIPTION (addresses all moderator requirements):
───────────────────────────────────────────────────────────────────
**Multi-Oscillator Divergence Detector with Pivot Validation**
This indicator identifies regular divergences by comparing price pivot points against oscillator pivot points across three momentum indicators simultaneously.
━━━━━━━━━━━━━━━━━━━━━━━━━━━━━━━━━━━━━━━━━━━━━
**HOW THE SCRIPT WORKS (Technical Methodology):**
The script uses a multi-step validation process:
1. **Pivot Detection**: The script identifies swing highs and lows on both price and oscillators using the `ta.pivothigh()` and `ta.pivotlow()` functions with configurable left/right lookback periods.
2. **Divergence Validation**: When a new pivot is detected, the script scans historical pivots to find potential divergence pairs where:
- For Bullish: Price makes a lower low while the oscillator makes a higher low
- For Bearish: Price makes a higher high while the oscillator makes a lower high
3. **Line Integrity Check**: Before confirming a divergence, the script draws a temporary test line between the two pivot points and checks if any intermediate price/oscillator values pierce through this line. Only non-pierced divergences are displayed.
4. **Multi-Oscillator Confirmation**: The divergence is checked against RSI, CCI, and MFI independently. The label shows how many oscillators confirmed the same divergence (1, 2, or 3).
━━━━━━━━━━━━━━━━━━━━━━━━━━━━━━━━━━━━━━━━━━━━━
**WHY COMBINE THESE THREE OSCILLATORS:**
Each oscillator measures momentum differently, providing complementary confirmation:
- **RSI (Relative Strength Index)**: Measures the speed and magnitude of recent price changes. Calculated as: RSI = 100 - (100 / (1 + RS)), where RS = Average Gain / Average Loss over the period.
- **CCI (Commodity Channel Index)**: Measures price deviation from the statistical mean. Calculated as: CCI = (Typical Price - SMA) / (0.015 × Mean Deviation). Effective for identifying cyclical turning points.
- **MFI (Money Flow Index)**: A volume-weighted RSI that incorporates buying/selling pressure. Calculated using typical price × volume to create money flow, then applying RSI formula. Adds volume confirmation to momentum analysis.
When multiple oscillators show divergence simultaneously, it suggests stronger conviction in the potential reversal signal.
━━━━━━━━━━━━━━━━━━━━━━━━━━━━━━━━━━━━━━━━━━━━━
**WHAT MAKES THIS SCRIPT UNIQUE:**
1. **Pivot-Based Validation**: Unlike simple divergence indicators that compare consecutive values, this script validates divergences between actual swing points, reducing false signals.
2. **Line Piercing Filter**: The script ensures no intermediate price action invalidates the divergence by checking if prices cross the divergence line.
3. **Triple Confirmation System**: Shows signal strength (1-3) based on how many oscillators agree on the divergence.
4. **Visual Confirmation Status**: Dotted lines indicate unconfirmed (recent) divergences; solid lines indicate confirmed divergences after the lookback period passes.
━━━━━━━━━━━━━━━━━━━━━━━━━━━━━━━━━━━━━━━━━━━━━
**HOW TO USE THIS INDICATOR:**
1. **Signal Identification**:
- Green lines with up arrow (▲) = Bullish divergence (potential buy zone)
- Red lines with down arrow (▼) = Bearish divergence (potential sell zone)
2. **Signal Strength**: The number next to the arrow (1, 2, or 3) indicates how many oscillators confirmed the divergence. Higher numbers suggest stronger signals.
3. **Confirmation Status**:
- Dotted line = Divergence is still forming (may be invalidated)
- Solid line = Divergence is confirmed
4. **Best Practices**:
- Use on higher timeframes (4H, Daily) for more reliable signals
- Combine with support/resistance levels for entry timing
- Wait for price action confirmation before entering trades
- Signals with 2-3 oscillator confirmations are generally more reliable
━━━━━━━━━━━━━━━━━━━━━━━━━━━━━━━━━━━━━━━━━━━━━
**SETTINGS EXPLAINED:**
| Setting | Default | Purpose |
|---------|---------|---------|
| Pivot Lookback Left | 3 | Bars to the left required to confirm a pivot |
| Pivot Lookback Right | 1 | Bars to the right required to confirm a pivot |
| Max Historical Bars | 750 | How far back to search for divergence pairs |
| RSI/CCI/MFI Length | 14 | Period for each oscillator calculation |
| Line Width | 2 | Visual thickness of divergence lines |
| Show Labels | On | Toggle signal labels on/off |
**Adjusting for Trading Style:**
- Shorter pivot lookback = More signals, faster detection, more noise
- Longer pivot lookback = Fewer signals, slower detection, higher quality
━━━━━━━━━━━━━━━━━━━━━━━━━━━━━━━━━━━━━━━━━━━━━
**LIMITATIONS AND RISK DISCLAIMER:**
- Divergences are NOT direct buy/sell signals - they indicate potential reversals
- In strong trends, divergences may fail multiple times before working
- Past divergence patterns do not guarantee future price movement
- Always use proper position sizing and stop-loss orders
- This indicator should be used as part of a complete trading strategy
━━━━━━━━━━━━━━━━━━━━━━━━━━━━━━━━━━━━━━━━━━━━━
**OPEN SOURCE:**
This script is published open-source. You can view the complete code logic and modify it for your own use according to TradingView's guidelines.
───────────────────────────────────────────────────────────────────
🏷️ TAGS (safe tags without trademark issues):
divergence, oscillator, pivot, momentum, reversal, swing-trading, technical-analysis, multi-timeframe, price-action, trend-reversal
───────────────────────────────────────────────────────────────────
✅ COMPLIANCE CHECKLIST (based on moderator feedback):
Originality & Usefulness:
- Explained WHY these oscillators work together
- Described the unique pivot validation method
- Not just a simple mashup
Description Quality:
- Detailed explanation of underlying logic
- Step-by-step methodology explained
- How to use the indicator
- Settings explained with purpose
Vendor Requirements:
- Publishing as OPEN SOURCE (not invite-only)
- No trademark symbols (™, ®) used
- Clear value proposition explained
No House Rule Violations:
- Original description text
- Educational content included
- Proper risk disclaimer
- No misleading claims
═══════════════════════════════════════════════════════════════════

LTF Distribution Analyzer█ OVERVIEW
LTF Distribution Analyzer reveals the hidden price distribution and order flow within each candle by sampling lower timeframe data. It visualizes where prices concentrated, how volume was distributed between buyers and sellers, and identifies divergences between price action and actual market participation.
Unlike traditional candlesticks showing only OHLC, this indicator exposes the statistical structure of price movement using quartile-based visualization combined with delta analysis.
█ CONCEPTS
The indicator is built on two core concepts:
1 — Statistical Price Distribution
Each candle contains many lower timeframe bars. By analyzing these bars, we calculate:
• Q1 (25th percentile) - 25% of prices traded below this level
• Q3 (75th percentile) - 75% of prices traded below this level
• Median - The middle price value
• IQR (Interquartile Range) - The Q3-Q1 spread containing 50% of all prices
2 — Volume Delta Analysis
Delta measures buying vs selling pressure:
• Delta = Buy Volume − Sell Volume
• Positive delta = More aggressive buying
• Negative delta = More aggressive selling
• Delta Ratio normalizes this as a percentage
█ HOW IT WORKS
The indicator fetches lower timeframe data using request.security_lower_tf() and processes it to create a statistical summary:
Step 1: Timeframe Calculation
• Auto mode: Chart timeframe ÷ Auto Divisor = LTF
• Example: 1H chart ÷ 1000 = ~3.6 second sampling
• Manual mode: User-specified timeframe
Step 2: Data Collection
• Collects all close prices from LTF bars within current candle
• Aggregates volume by candle direction (bullish/bearish)
Step 3: Statistical Analysis
• Calculates quartiles (Q1, Q3), median, and boundaries
• Identifies outliers using 1.5× and 3× IQR fences
• Finds Volume POC (price with highest volume)
Step 4: Delta Calculation
• Sums buy volume (from bullish LTF bars)
• Sums sell volume (from bearish LTF bars)
• Computes delta ratio for color determination
█ VISUAL ELEMENTS
┌─────────────────────────────────────────┐
│ ▲ Extreme outlier (3× IQR) │
│ △ Mild outlier (1.5× IQR) │
│ ─ Upper whisker cap │
│ ┊ Whisker line (dashed) │
│ ▄ IQR Box (Q1 to Q3 range) │
│ ━ Volume POC (highest volume) │
│ ● Median (green=bull, red=bear) │
│ ┊ Whisker line (dashed) │
│ ─ Lower whisker cap │
│ ▽ Mild outlier │
│ ▼ Extreme outlier │
└─────────────────────────────────────────┘
█ COLOR SYSTEM
Colors indicate the relationship between candle direction and order flow:
🟢 TEAL (Positive Flow)
Bullish candle + Positive delta
→ Strong buying confirmation
→ Trend continuation signal
🔴 RED (Negative Flow)
Bearish candle + Negative delta
→ Strong selling confirmation
→ Trend continuation signal
🟠 ORANGE (Mixed Signal A)
Bullish candle + Negative delta
→ Price up but sellers dominated
→ Potential weakness/reversal warning
🔵 BLUE (Mixed Signal B)
Bearish candle + Positive delta
→ Price down but buyers dominated
→ Potential accumulation/reversal signal
█ SETTINGS
Timeframe Settings
• LTF Mode — Auto or Manual selection
• Manual Timeframe — Specific LTF when in Manual mode
• Auto Divisor — Higher = finer granularity (default: 1000)
• Allow Sub-Minute — Requires Premium subscription
Visual Style
• Positive/Negative Flow colors — Customize the 4 flow colors
• Box Transparency — Opacity of the quartile box (0-100%)
Statistics Display
• Show Statistics Panel — Toggle on-chart stats table
• Show Timeframe Badge — Toggle LTF indicator badge
• Panel Position — Choose corner placement
• Panel Size — Text size selection
█ HOW TO USE
1. Divergence Detection
Look for color mismatches:
• Orange bars in uptrend = weakness, potential reversal
• Blue bars in downtrend = strength, potential reversal
• Multiple consecutive divergent bars strengthen signal
• Wait for confirmation before entry
2. Volume POC Trading
• POC marks where most volume traded
• POC clusters at similar levels = strong S/R zone
• Price often returns to POC before continuing
• Use POC for entry/exit targeting
3. Trend Confirmation
• Consecutive teal = strong uptrend
• Consecutive red = strong downtrend
• Median position shows intrabar momentum
• Wide boxes indicate high volatility
4. Outlier Analysis
• Extreme markers (▲▼) often mark stop hunts
• Consider fading extremes at key levels
• Mild markers (△▽) = areas to watch
█ RECOMMENDED SETTINGS
For different chart timeframes:
│ Chart TF │ Auto Divisor │ Resulting LTF │
├──────────┼──────────────┼───────────────┤
│ 15M │ 1500 │ ~1M │
│ 1H │ 1000 │ ~3-4s │
│ 4H │ 600 │ ~24s │
│ Daily │ 500 │ ~2-3M │
Tip: Check the TF badge to confirm active sampling timeframe.
█ BEST PRACTICES
Do:
✓ Use "Bars" chart style for cleanest display
✓ Combine with support/resistance analysis
✓ Wait for confirmation bars
✓ Note POC clusters across multiple bars
✓ Adjust divisor based on your timeframe
Avoid:
✗ Trading single bar signals alone
✗ Using during low volume periods
✗ Trading immediately after news releases
✗ Ignoring overall market context
█ LIMITATIONS
• Requires adequate market liquidity for reliable signals
• Sub-minute timeframes need Premium subscription
• Historical data depth depends on TradingView's data availability
• Delta calculation assumes volume direction matches candle direction
█ NOTES
This indicator works best on liquid markets (forex majors, major indices, popular stocks/crypto) where volume data is meaningful.
The gray dotted vertical line marks where LTF data becomes available - bars before this line won't display the indicator.
For questions or suggestions, leave a comment below.

Momentum Edge Pro█ MOMENTUM EDGE PRO
A multi-timeframe momentum oscillator designed for scalping on lower timeframes (1m, 5m, 15m).
█ HOW IT WORKS
This indicator combines several momentum analysis techniques:
1. Dual EMA Difference - Calculates the difference between fast (8) and slow (21) exponential moving averages to measure momentum direction and strength.
2. Signal Line Smoothing - Applies a 5-period SMA to the momentum line to identify crossover opportunities.
3. Dynamic Histogram - Visualizes momentum strength with 4 distinct colors based on whether momentum is increasing or decreasing above/below zero.
4. Multi-Timeframe Confirmation - Uses a higher timeframe filter to align trades with the larger trend direction.
5. Volume Confirmation - Filters signals to only appear when volume exceeds the 20-period average by a customizable multiplier.
6. RSI Filter - Prevents long entries in overbought conditions (>70) and short entries in oversold conditions (<30).
█ SIGNAL LOGIC
CALL Signal (Green Triangle Up):
- Momentum line crosses above signal line
- Higher timeframe momentum is bullish
- Volume confirms with above-average activity
- RSI is not in overbought zone
- Histogram shows increasing bullish momentum for 2+ bars
PUT Signal (Red Triangle Down):
- Momentum line crosses below signal line
- Higher timeframe momentum is bearish
- Volume confirms with above-average activity
- RSI is not in oversold zone
- Histogram shows increasing bearish momentum for 2+ bars
Weak crosses appear as faded circles - these are filtered out and should be avoided.
█ HISTOGRAM COLORS
Bright Green: Bullish momentum increasing
Dark Green: Bullish momentum decreasing (potential reversal)
Bright Red: Bearish momentum increasing
Dark Red: Bearish momentum decreasing (potential reversal)
█ RECOMMENDED SETTINGS
For 1-minute charts: HTF = 5m
For 5-minute charts: HTF = 15m
For 15-minute charts: HTF = 1H
█ SETTINGS EXPLAINED
Core Settings:
- Fast Period: Controls sensitivity (lower = more reactive)
- Slow Period: Controls trend smoothing (higher = smoother)
- Signal Period: Controls signal line smoothing
Signal Filters:
- Min Histogram Size: Filters weak momentum (increase to reduce signals)
- Volume Multiplier: Required volume above average (1.2 = 20% above average)
- RSI Overbought/Oversold: Levels for RSI filter
█ BEST PRACTICES
1. Always confirm signals with price action
2. Use higher timeframe for trend direction
3. Avoid trading during news events
4. Fading histogram colors warn of potential reversals
5. Combine with support/resistance levels
█ ALERTS
Three alert conditions available:
- CALL Signal: Triggers on green triangle
- PUT Signal: Triggers on red triangle
- Any Signal: Triggers on either signal
To set alerts: Right-click chart → Add Alert → Select condition

Volatility Squeeze + EMA Trend Filter [Day Trading]Identify explosive breakouts before they happen. This indicator detects low-volatility consolidations (squeezes) that precede powerful price moves, filtered by trend direction for higher-probability signals.
█ FEATURES
- Squeeze detection using Bollinger Bands inside Keltner Channels
- Momentum histogram visualization in dashboard
- 200 EMA trend filter (toggleable) - longs above, shorts below
- Trading hours filter with timezone support
- Buy/sell signals on chart with customizable size
- 5 visual themes (Nebula Core, Aurora Borealis, Ice Giant, Solar Flare, Supernova)
- Real-time dashboard with squeeze state, momentum, and signal bias
█ HOW IT WORKS
1. Bollinger Bands compress inside Keltner Channels = "Squeeze" (consolidation)
2. Squeeze releases = imminent breakout
3. Momentum direction determines trade direction
4. 200 EMA filter ensures you trade with the trend
5. Session filter keeps you in optimal trading hours
█ SIGNAL LOGIC
BUY: Momentum crosses above zero OR squeeze releases with rising positive momentum + price above 200 EMA
SELL: Momentum crosses below zero OR squeeze releases with falling negative momentum + price below 200 EMA
█ RECOMMENDED USE
- Best timeframes: 5-minute, 15-minute for day trading
- Best instruments: NQ, MNQ, ES, MES, SPY, QQQ
- Best session: 9:30 AM - 11:00 AM ET (morning momentum)
- Works on any market with sufficient volatility
█ INPUTS
- BB/KC Length and Multipliers (default: 20/2.0 and 20/1.5)
- 200 EMA trend filter toggle
- Trading session hours and timezone
- Signal size and visual theme selection
Based on John Carter's TTM Squeeze concept.
DM for access.

Adaptive MTF Momentum█ WHAT MAKES THIS INDICATOR DIFFERENT
This indicator solves a common problem: lower timeframe noise causing false signals. Instead of using fixed settings, it dynamically selects which higher timeframes to monitor based on your current chart.
The core methodology combines three analysis layers that must ALL agree before generating a signal:
1. Multi-timeframe trend alignment (direction filter)
2. Momentum exhaustion detection (timing filter)
3. Volume and structure confirmation (validation filter)
This triple-confirmation approach significantly reduces false signals compared to single-indicator strategies.
█ METHODOLOGY EXPLAINED
Layer 1: Adaptive Timeframe Selection
The indicator automatically builds a timeframe chain based on your chart:
| Your Chart | Monitors |
|------------|----------|
| 5 minute | 30m + 1H + 4H |
| 15 minute | 1H + 4H + Daily |
| 30 minute | 2H + 8H + Daily |
For each higher timeframe, it calculates EMA crossovers (8/21/50) to determine trend direction. The "alignment score" (0-3) shows how many timeframes agree.
Why this matters: A 5m buy signal is more reliable when 30m, 1H, AND 4H all show bullish structure.
Layer 2: Momentum Timing
Once trend direction is confirmed, the indicator waits for optimal entry timing using:
- RSI (14): Identifies oversold (<30) and overbought (>70) conditions
- Stochastic (14,3,3): Confirms momentum shift via K/D crossovers
- MACD (12,26,9): Validates momentum direction change
A "momentum score" combines these readings. Signals only fire when momentum aligns with the higher timeframe trend.
The logic: In an uptrend, we want to buy when momentum is oversold and turning up. In a downtrend, we want to sell when momentum is overbought and turning down.
Layer 3: Validation Filters
Before any signal appears, these conditions must pass:
- Volume Filter: Current volume must exceed 1.2x the 20-period average. This confirms institutional participation.
- VWAP Filter: For longs, price should be above VWAP. For shorts, below VWAP. This ensures we trade with intraday flow.
- Structure Filter: Requires a recent break of swing high (for longs) or swing low (for shorts). This confirms price is actually moving in our direction.
- ATR Filter: Volatility must be above 50% of its 50-period average. This avoids low-volatility chop.
█ SIGNAL CLASSIFICATION
The indicator categorizes signals by entry type:
REV (Reversal): Momentum reaches extreme (RSI oversold/overbought) while higher timeframes maintain trend. Best for catching pullbacks in trends.
CONT (Continuation): Price pulls back to the 21 EMA in a strong trend, then momentum turns. Best for adding to existing positions.
BRK (Breakout): Price breaks structure level with volume spike. Best for catching new moves early.
█ QUALITY SCORE CALCULATION
Each signal receives a Q1-Q5 rating based on:
- HTF alignment score (0-3 points)
- Momentum score (0-3 points)
- Volume spike present (+1 point)
Higher scores indicate more filters aligned. Q4-Q5 signals have the highest probability.
█ RISK MANAGEMENT
TP/SL levels are calculated using ATR(14):
- Stop Loss: 1.2 x ATR from entry
- TP1: 1.8 x ATR (partial exit)
- TP2: 3.0 x ATR (full exit)
This provides approximately 1.5:1 to 2.5:1 reward-to-risk ratio.
█ HOW TO USE
1. Apply to 5m, 15m, or 30m chart
2. Enable "Auto-Adapt" mode (recommended)
3. Wait for signals with Q3 or higher rating
4. Check dashboard confirms trend alignment
5. Enter with suggested TP/SL levels
Settings Guide:
- Sensitivity: "Conservative" = fewer but higher quality signals
- Sensitivity: "Aggressive" = more signals, lower threshold
- Cooldown: Increase to 10-15 if signals appear too frequently
█ DASHBOARD READINGS
- HTF: Shows active timeframe chain
- Trend: Bull/Bear + alignment score (aim for +2 or +3)
- RSI/Stoch: Current value or OS/OB status
- Vol: "SPIKE" when above threshold
- VWAP: Arrow shows price position relative to VWAP
█ LIMITATIONS
- Works best in trending markets; avoid during ranging/choppy conditions
- Designed for intraday timeframes (5m-30m); not optimized for higher timeframes
- Signals are not guarantees; always use proper risk management
- Past performance does not indicate future results
█ ALERTS AVAILABLE
- Long / Short: Any signal
- HQ Long / HQ Short: Q4+ signals only (recommended)
- Any: All signals combined

Scalping MTF F-Bands Signals (L/S) + RSI Filter [RCOHelpline] v4Overview of Scalping MTF F-Bands Signals (L/S) + RSI Filter v4:
This indicator is a scalping / intraday signal system built on Multi-Timeframe (MTF) Fibonacci-style bands, combined with an RSI midline filter and an optional direction-lock mechanism designed to reduce repeated entries during unfavorable conditions.
The script focuses on identifying statistically stretched price areas rather than chasing momentum.
Core Concept
The indicator plots two independent Fibo Band layers (A & B).
Each layer is calculated using:
SMA (baseline)
ATR (volatility expansion)
Fibonacci-style multipliers
Both layers are calculated on user-selected higher timeframes and projected onto the current chart.
Signal Sources (A / B / BOTH)
You can choose how signals are generated:
A → Signals based only on Fibo Bands A
B → Signals based only on Fibo Bands B
BOTH → Signals require confluence between A and B
When BOTH is selected, a signal is triggered only if price simultaneously reaches valid zones on both band layers, helping filter noise.
Entry Logic
LONG
Price closes inside the Lower Zone (between Fib Band 2 and Band 3)
RSI is above the midline (default 50)
SHORT
Price closes inside the Upper Zone (between Fib Band 2 and Band 3)
RSI is below the midline (default 50)
All signals are designed to trigger on confirmed candle closes to reduce MTF instability.
Direction Lock System (Optional)
If enabled, the script locks the trade direction when a Stop Loss occurs before TP1 is reached.
This helps prevent repeated entries in the same direction during unfavorable or choppy conditions.
Unlock Logic
A locked direction can be unlocked when:
RSI crosses back over the midline
AND price closes again inside the valid Band 2–3 zone
With the optional setting enabled, a new entry may occur on the same candle as the unlock condition.
TP & Stop Logic (Price-Action Based)
This indicator uses structure-based exits, not fixed pip targets.
Before TP1
LONG → Two consecutive closes below Lower Band 3
SHORT → Two consecutive closes above Upper Band 3
After TP1
Stop automatically shifts to Break-Even
Any return to entry price closes the position
MTF & Usage Notes
The indicator relies on higher timeframe data
Signals are gated until band data is fully formed
Designed for structured price action environments
⚠️ Not recommended for:
High-impact news
Sudden volatility spikes
Extremely fast impulsive moves

SAR Volume ScalperSAR Volume Scalper is a minimalist intraday scalping indicator designed for 1–2 minute charts, optimized for high-liquidity markets such as NASDAQ (NQ) and Gold (GC).
The indicator combines Parabolic SAR price crossings with a neutral volume participation filter (Volume ≥ EMA(Volume)), ensuring that signals appear only when the market is active, without relying on rare or aggressive volume spikes.
🔑 Core Logic
Parabolic SAR identifies precise micro-trend shifts
Trend EMA filters directional bias and reduces counter-trend trades
Neutral volume filter confirms market participation while preserving signal frequency
ATR-based targets adapt automatically to current volatility
🎯 Designed For
High-frequency scalping on 1–2 minute timeframes
Manual trade execution during active market sessions
Traders who prefer price and flow confirmation over heavy indicator stacking
⚠️ Disclaimer
This indicator is a decision-support tool and should not be used as standalone trading advice.
It is not intended for fully automated trading.

Scalp Signal Pro══════════════════════════════════════════════════════════════
SCALP SIGNAL PRO
Multi-Confluence Day Trading System
══════════════════════════════════════════════════════════════
🎯 OVERVIEW
━━━━━━━━━━━━━━━━━━━━━━━━━━━━━━━━━━━━━━━━━━━━━━━━━━━━━━━━━━━━━
Scalp Signal Pro is a professional day trading indicator that combines 12+ technical factors into a weighted confluence scoring system (0-20 points). Signals only fire when the score exceeds your threshold AND all trend filters align.
Designed for: Scalping stocks, options (CALL/PUT), futures
Best timeframes: 1-5 minute charts
Markets: Stocks, ETFs, Futures, Crypto
⚙️ HOW IT WORKS
━━━━━━━━━━━━━━━━━━━━━━━━━━━━━━━━━━━━━━━━━━━━━━━━━━━━━━━━━━━━━
CONFLUENCE SCORING ENGINE
Each candle is scored by evaluating 12 technical factors:
┌─────────────────────────────────────────────────────────────┐
│ INDICATOR │ PARAMETERS │ MAX POINTS │
├─────────────────────────────────────────────────────────────┤
│ RSI │ Length: 14 │ +2 (extreme OS/OB) │
│ │ OB: 80, OS: 20 │ +1 (bullish/bearish) │
├─────────────────────────────────────────────────────────────┤
│ MACD │ Fast: 8 │ +2 (crossover) │
│ │ Slow: 21 │ +1.5 (strong trend) │
│ │ Signal: 5 │ +1 (aligned) │
├─────────────────────────────────────────────────────────────┤
│ EMA Stack │ Fast: 13 │ +2 (perfect stack) │
│ │ Mid: 48 │ +1 (partial stack) │
│ │ Slow: 200 │ +0.5-1 (price pos) │
├─────────────────────────────────────────────────────────────┤
│ VWAP │ Source: HLC3 │ +1.5 (bounce/reject) │
│ │ Reset: Daily │ +0.5 (above/below) │
├─────────────────────────────────────────────────────────────┤
│ ADX │ Length: 14 │ +1.5 (very strong) │
│ │ Threshold: 30 │ +1 (strong trend) │
├─────────────────────────────────────────────────────────────┤
│ Volume │ SMA: 20 │ +1.5 (spike >2x) │
│ │ Spike: 2.0x │ +1 (high >1.5x) │
├─────────────────────────────────────────────────────────────┤
│ Stochastic RSI │ Length: 14 │ +1.5 (cross at ext) │
│ │ K Smooth: 3 │ +0.5 (aligned) │
├─────────────────────────────────────────────────────────────┤
│ Bollinger Bands │ Length: 20 │ +1.5 (BB bounce) │
│ │ StdDev: 2.0 │ +0.5 (position) │
├─────────────────────────────────────────────────────────────┤
│ Candlestick │ ATR-based │ +1.5 (engulfing) │
│ Patterns │ │ +1 (strong candle) │
├─────────────────────────────────────────────────────────────┤
│ Momentum │ Length: 10 │ +1 (MOM + ROC bull) │
│ Rate of Change │ Length: 10 │ +0.5 (MOM only) │
├─────────────────────────────────────────────────────────────┤
│ Trend Context │ EMA alignment │ +1 (strong trend) │
│ │ Price structure │ │
└─────────────────────────────────────────────────────────────┘
SIGNAL FREQUENCY OPTIONS:
• High (6+ points): More signals, lower selectivity
• Moderate (8+ points): Balanced - RECOMMENDED
• Selective (10+ points): Fewer, higher quality signals
• Very Selective (12+ points): Rare, high conviction
• Ultra Selective (14+ points): Very rare, highest quality
⭐ VCRE SIGNAL SYSTEM
━━━━━━━━━━━━━━━━━━━━━━━━━━━━━━━━━━━━━━━━━━━━━━━━━━━━━━━━━━━━━
Volume-Confirmed Reversal Engine - A separate signal system for high-probability reversals.
HOW IT WORKS:
1. ANCHOR: Price breaks below ALL of last 20 lows (bullish) or above ALL of last 20 highs (bearish) with 2x average volume
2. CONFIRMATION: Within 3 bars, price crosses back above anchor high (bullish) or below anchor low (bearish)
3. SIGNAL: B (bullish) or S (bearish) label appears with star rating
PARAMETERS:
• Candle Lookback: 20
• Confirm Within: 3 bars
• Anchor Volume Multiplier: 2.0x
• Confirm Volume Multiplier: 1.2x
• Macro Trend EMA: 200
STAR RATING (3-5 Stars):
★★★ Base rating
★★★★ +1 for anchor volume OR confirm volume
★★★★★ +1 for macro trend alignment (price vs 200 EMA)
📊 MTF ANALYSIS PANEL
━━━━━━━━━━━━━━━━━━━━━━━━━━━━━━━━━━━━━━━━━━━━━━━━━━━━━━━━━━━━━
Real-time market structure analysis across 5 customizable timeframes.
DEFAULT TIMEFRAMES: 4m | 15m | 1H | 4H | Daily
METRICS:
┌─────────────────────────────────────────────────────────────┐
│ MOMENTUM (0-200) │
│ • Combines: RSI (35%), ROC (25%), MOM (20%), MACD (20%) │
│ • 100 = neutral | >110 = bullish | <90 = bearish │
├─────────────────────────────────────────────────────────────┤
│ SENTIMENT (0-100) │
│ • Price vs EMAs, stack alignment, volume sentiment │
│ • 50 = neutral | >55 = bullish | <45 = bearish │
├─────────────────────────────────────────────────────────────┤
│ VOLATILITY (0-100) │
│ • ATR ratio, BB width, TR ratio, Std Dev │
│ • Lower = calm | Higher = volatile │
└─────────────────────────────────────────────────────────────┘
OVERALL BIAS:
▲ BULLISH: Avg Momentum > 110 AND Avg Sentiment > 55
▼ BEARISH: Avg Momentum < 90 AND Avg Sentiment < 45
◆ NEUTRAL: All other conditions
📈 HOW TO USE
━━━━━━━━━━━━━━━━━━━━━━━━━━━━━━━━━━━━━━━━━━━━━━━━━━━━━━━━━━━━━
1. Add indicator to chart (1-5 min timeframe recommended)
2. Configure Signal Frequency (start with "Moderate")
3. Enable Session Filter for optimal trading hours
4. Wait for signal: Green ▲ CALL or Red ▼ PUT
5. Confirm MTF Panel shows aligned bias
6. Check signal score and R:R ratio displayed
7. Execute trade with ATR-based SL/TP levels
🕐 SESSION FILTER
━━━━━━━━━━━━━━━━━━━━━━━━━━━━━━━━━━━━━━━━━━━━━━━━━━━━━━━━━━━━━
When enabled, signals only fire during high-volume periods (EST):
• Morning Session: 9:30 AM - 11:00 AM (market open momentum)
• Afternoon Session: 2:00 PM - 3:30 PM (power hour setup)
📏 KEY LEVELS DISPLAYED
━━━━━━━━━━━━━━━━━━━━━━━━━━━━━━━━━━━━━━━━━━━━━━━━━━━━━━━━━━━━━
• PDH / PDL - Previous Day High/Low (Cyan, Solid)
• 2DH / 2DL - 2 Days Ago High/Low (Orange, Dashed)
• PWH / PWL - Previous Week High/Low (Pink, Dotted)
⚙️ RECOMMENDED SETTINGS
━━━━━━━━━━━━━━━━━━━━━━━━━━━━━━━━━━━━━━━━━━━━━━━━━━━━━━━━━━━━━
┌────────────────────┬────────────────────────────────────────┐
│ Setting │ Recommended Value │
├────────────────────┼────────────────────────────────────────┤
│ Signal Frequency │ Moderate (beginners) / Selective (exp) │
│ Strict Mode │ ON (all filters must align) │
│ Session Filter │ ON (avoid choppy periods) │
│ Cooldown Bars │ 8 (prevents overtrading) │
│ Stop Loss (xATR) │ 1.0 │
│ Take Profit (xATR) │ 1.5 (1.5:1 R:R ratio) │
└────────────────────┴────────────────────────────────────────┘
🔔 AVAILABLE ALERTS
━━━━━━━━━━━━━━━━━━━━━━━━━━━━━━━━━━━━━━━━━━━━━━━━━━━━━━━━━━━━━
• LONG (Call) Signal
• SHORT (Put) Signal
• Any Scalp Signal
• VCRE Bullish Signal
• VCRE Bearish Signal
• Any VCRE Signal
• VCRE High-Quality Buy/Sell (4+ Stars)
• VCRE BEST Buy/Sell (5 Stars)
✨ WHAT MAKES IT UNIQUE
━━━━━━━━━━━━━━━━━━━━━━━━━━━━━━━━━━━━━━━━━━━━━━━━━━━━━━━━━━━━━
1. WEIGHTED CONFLUENCE ALGORITHM
Not a simple indicator mashup - each factor is weighted by importance and market context. The scoring system evaluates momentum, trend, volume, and volatility together to generate high-conviction signals.
2. ORIGINAL VCRE METHODOLOGY
The Volume-Confirmed Reversal Engine uses an original anchor-confirmation pattern that identifies potential reversal zones validated by volume analysis. This two-step confirmation process helps filter out false signals.
3. COMPREHENSIVE MTF PANEL
Professional market structure analysis displaying momentum, sentiment, and volatility calculations across multiple timeframes in a single, easy-to-read dashboard.
4. SMART FILTERS
Session filter limits signals to high-volume trading hours. Cooldown system prevents overtrading. Volatility requirements and strict mode ensure signals only fire in optimal market conditions.
5. BUILT-IN RISK MANAGEMENT
ATR-based dynamic stop loss and take profit levels with customizable risk:reward ratios displayed on every signal, helping traders maintain consistent position sizing.
⚠️ DISCLAIMER
━━━━━━━━━━━━━━━━━━━━━━━━━━━━━━━━━━━━━━━━━━━━━━━━━━━━━━━━━━━━━
This indicator is for educational purposes only. Trading involves substantial risk of loss. Past performance does not guarantee future results. Always use proper risk management and never trade with money you cannot afford to lose. This is not financial advice.
══════════════════════════════════════════════════════════════

Volume-Confirmed Reversal Engine [Scalping-Algo]█ VOLUME-CONFIRMED REVERSAL ENGINE
A reversal detection system combining price action exhaustion with volume confirmation to identify high-probability turning points.
█ WHAT MAKES THIS ORIGINAL?
Unlike oscillators (RSI, Stochastic) that signal at arbitrary levels, VCRE uses a TWO-STEP CONFIRMATION process:
1. ANCHOR CANDLE: Detects when price closes beyond ALL recent candles (not just one), indicating true exhaustion
2. VOLUME VALIDATION: Requires 2x average volume to confirm institutional participation
3. BREAKOUT CONFIRMATION: Waits for price to break back through anchor range before signaling
4. QUALITY SCORING: Rates each signal 1-4 stars based on multiple confluence factors
█ HOW IT WORKS
STEP 1 - ANCHOR DETECTION
• Bullish: Close drops below the LOW of ALL previous N candles + high volume
• Bearish: Close rises above the HIGH of ALL previous N candles + high volume
• This identifies potential exhaustion points with institutional participation
STEP 2 - CONFIRMATION
• Bullish signal: Price must close ABOVE anchor candle's high
• Bearish signal: Price must close BELOW anchor candle's low
• Must occur within specified bars or setup is cancelled
STEP 3 - SCORING (1-4 Stars)
★ Confirmation occurred
★ Anchor had exceptional volume (>2x avg)
★ Confirmation candle has strong volume (>1.2x avg)
★ Aligned with macro trend (200 EMA)
█ HOW TO USE
SIGNALS
• Green "B" = BUY signal | Red "S" = SELL signal
• More stars (★) = Higher probability setup
SETUP BOXES
• Green box = Bullish setup forming, waiting for confirmation
• Red box = Bearish setup forming, waiting for confirmation
DASHBOARD
• Shows status, confirmation countdown, and volume condition
█ RECOMMENDED SETTINGS
| Style | Lookback | Confirm | Volume Multi |
|--------------|----------|---------|--------------|
| Scalping | 10-15 | 2-3 | 1.5x |
| Day Trading | 15-25 | 3-4 | 2.0x |
| Swing | 20-30 | 3-5 | 2.0-2.5x |
█ KEY PARAMETERS
• Candle Lookback: Candles to check for breakout (higher = stronger signals)
• Confirm Within: Max bars for confirmation (lower = faster signals)
• Anchor Volume Multiplier: Volume threshold for anchor candle
• Macro Trend EMA: Trend filter for scoring (default 200)
█ ALERTS
• Buy/Sell Signal - Any confirmation
• High-Quality Buy/Sell - 3+ star signals only
• Setup Detected - When anchor forms (before confirmation)
█ TIPS
• Focus on 3-4 star signals for best results
• Signals near support/resistance add confluence
• Use stop-loss beyond anchor candle extreme
• Test on demo before live trading
Works on all markets: Stocks, Forex, Crypto, Futures

Triple EMA + Key Levels [Scalping-Algo]TITLE: Triple EMA Day Trading System with Multi-Timeframe Support/Resistance Levels
DESCRIPTION:
📊 Overview
This indicator combines trend-following EMAs with key historical price levels to create a complete day trading toolkit. It helps traders identify trend direction while highlighting important support and resistance zones from multiple timeframes.
🎯 Purpose & Trading Application
Day traders often need to quickly assess:
1. Current trend direction (using EMAs)
2. Key price levels where reversals or breakouts may occur
This indicator solves both needs in one tool, reducing chart clutter from multiple indicators.
📈 How It Works
TREND IDENTIFICATION (EMAs):
- EMA 13 (Yellow): Fast EMA for short-term momentum and entry timing
- EMA 48 (Purple): Medium EMA for intraday trend direction
- EMA 200 (Red): Slow EMA for overall trend bias
Trading Logic:
- When price is above all 3 EMAs = Strong bullish bias
- When price is below all 3 EMAs = Strong bearish bias
- EMA crossovers signal potential trend changes
- The 13/48 crossover is particularly useful for intraday entries
SUPPORT & RESISTANCE LEVELS:
- Previous Day High/Low (Green, Solid): Most recent daily range - high probability reaction zones
- 2-Day High/Low (Blue, Dashed): Extended lookback for stronger levels
- Previous Week High/Low (Orange, Dotted): Major institutional levels
Why These Levels Matter:
Previous day and weekly highs/lows are watched by many traders and algorithms. Price often:
- Reverses at these levels (support/resistance)
- Accelerates through them (breakout trades)
🔧 How To Use
FOR TREND TRADING:
1. Identify bias using EMA stack (all 3 aligned = strong trend)
2. Look for pullbacks to EMA 13 or 48 for entries
3. Use key levels as profit targets
FOR REVERSAL TRADING:
1. Watch for price approaching previous day/week levels
2. Look for rejection candles at these levels
3. Use EMA 13 break as confirmation
FOR BREAKOUT TRADING:
1. Identify consolidation near key levels
2. Enter on break of level with volume
3. Use opposite level as target
⚙️ Settings
All parameters are fixed for simplicity:
- EMAs: 13, 48, 200 periods
- Levels: Previous Day, 2-Day, Previous Week
- All lines thickness: 2
📝 Notes
- Best used on intraday timeframes (1min to 1hour)
- Levels update automatically each day/week
- Labels on right side identify each level (PDH, PDL, 2DH, 2DL, PWH, PWL)
---
TAGS: ema, daytrading, support, resistance, levels, intraday, trend, scalping, swingtrading

The Anh - Scalping 1M Pro V1 LOCKEDScalping 1M - Đánh nhanh, rút lẹ . Cần liên hệ chủ sở hữu để lấy Key kích hoạt .

ThaiRiches Predictor [AI Premium]ThaiRiches Predictor is a comprehensive trend-following system designed to help traders identify high-probability entries while managing risk effectively. This script combines Zero-Lag technology (ZLEMA) with volatility filters and an intelligent AI Dashboard to analyze market conditions in real-time.
Key Features:
Zero-Lag Trend Engine: Uses a custom Zero-Lag EMA (ZLEMA) logic combined with volatility bands to detect trend changes earlier than traditional Moving Averages.
AI Analysis Dashboard: A real-time monitor panel that evaluates Trend, Momentum (RSI), and Volatility to provide actionable advice (e.g., "Strong Uptrend", "Overbought - Wait for Pullback", or "Low Volatility - Caution").
Auto TP & SL System: Automatically calculates and displays Stop Loss (SL), Take Profit 1 (TP1), and Take Profit 2 (TP2) based on ATR, adapting to the current market volatility.
Improved Safety: SL is calculated from the High/Low of the signal candle to prevent premature stop-outs.
Visual Alerts: Clear BUY/SELL labels with price targets and color-coded candlesticks for easy visual confirmation.
How to Use:
BUY Signal: Look for the Green Label and Green Trend Line. Confirm with the Dashboard (Status: BULLISH).
S ELL Signal: Look for the Red Label and Red Trend Line. Confirm with the Dashboard (Status: BEARISH).
Risk Management: Use the provided SL levels. It is recommended to take partial profit at TP1 and trail your stop to entry.
Caution: Avoid trading when the Dashboard shows "Low Volatility" or "Choppy" warnings.
Settings:
You can adjust the Trend Sensitivity and RSI Period.
TP/SL Multipliers are fully customizable to fit different assets (Gold, Forex, Crypto).

ADVANCED NIFTY OPTION BUY SELLADVANCED NIFTY OPTION BUY SELL – V1 is a non-repainting, trend-following TradingView indicator specially designed for NIFTY Index Options (CE / PE) traders.
This indicator focuses on:
Eliminating over-trading
Providing high-quality, low-frequency signals
Avoiding trades during sideways markets
It combines EMA crossover, RSI momentum, and ADX trend strength to deliver clean and reliable buy/sell signals.

RSI Forecast [QuantAlgo]🟢 Overview
While standard RSI excels at measuring current momentum and identifying overbought or oversold conditions, it only reflects what has already happened in the market. The RSI Forecast indicator builds upon this foundation by projecting potential RSI trajectories into future bars, giving traders a framework to consider where momentum might head next. Three analytical models power these projections: a market structure approach that reads swing highs and lows, a volume analysis method that weighs accumulation and distribution patterns, and a linear regression model that extrapolates recent trend behavior. Each model processes market data differently, allowing traders to choose the approach that best fits their analytical style and the asset they're trading.
🟢 How It Works
At its foundation, the indicator calculates RSI using the standard methodology: comparing average upward price movements against average downward movements over a specified period, producing an oscillator that ranges from 0 to 100. Traders can apply an optional signal line using various moving average types (e.g., SMA, EMA, SMMA/RMA, WMA, or VWMA), and when SMA smoothing is selected, Bollinger Bands can be added to visualize RSI volatility ranges.
The forecasting mechanism operates by first estimating future price levels using the chosen projection method. These estimated prices then pass through a simulated RSI engine that mirrors the actual indicator's mathematics. The simulation updates the internal gain and loss averages bar by bar, applying the same RMA smoothing that powers real RSI calculations, to produce authentic projected values.
Since RSI characteristically moves in waves rather than straight lines, the projection system incorporates dynamic oscillation. This draws from stored patterns of recent RSI movements, factors in the tendency for RSI to pull back from extreme readings, and applies mathematical wave functions tied to current momentum conditions. The Oscillation Intensity control lets traders adjust how much waviness appears in projections. Signal line (RSI-based MA) projections follow the same logic, advancing the chosen moving average type forward using its proper mathematical formula. The complete system generates 15 bars of projected RSI and signal line values, displayed as dashed lines extending beyond current price action.
🟢 Key Features
1. Market Structure Model
This projection method reads price action through swing point analysis. It scans for pivot highs and pivot lows within a defined lookback range, then evaluates whether the market is building bullish patterns (successive higher highs and higher lows) or bearish patterns (successive lower highs and lower lows). The algorithm recognizes structural shifts when price violates previous swing levels in either direction.
Price projections under this model factor in proximity to key swing levels and overall trend strength, measured by tallying trend-confirming swings over recent history. When bullish structure prevails and price hovers near support, upward price bias enters the projection, pushing forecasted RSI higher. Bearish structure near resistance creates the opposite effect. The model scales its projections using ATR to keep them proportional to current volatility conditions.
▶ Practical Implications for Traders:
Aligns well with traders who focus on support, resistance, and swing-based entries
Provides context for where RSI might travel as price interacts with structural levels
Tends to perform better when markets display clear directional swings
May produce less useful output during consolidation phases with overlapping swings
Offers early visualization of potential divergence setups
Swing traders can use structure-based projections to time entries around key pivot zones
Position traders could benefit from the trend strength component when holding through larger moves
On lower timeframes, it helps scalpers identify micro-structure shifts for quick momentum plays
Useful for mapping out potential RSI behavior around breakout and breakdown levels
Day traders can combine structural projections with session highs and lows for intraday context
2. Volume-Weighted Model
This method blends multiple volume indicators to inform its price projections. It tracks On-Balance Volume to gauge cumulative buying and selling pressure, monitors the Accumulation/Distribution Line to assess where price closes relative to its range on each bar, and calculates volume-weighted returns to give heavier influence to high-volume price movements. The model examines the directional slope of these metrics to assess whether volume confirms or contradicts price direction.
Unusually high volume bars receive special attention, with their directional bias factored into projections. When all volume metrics point the same direction, the model produces more aggressive price forecasts and consequently stronger RSI movements. Conflicting volume signals lead to more muted projections, suggesting RSI may move sideways rather than trending.
▶ Practical Implications for Traders:
Suited for traders who incorporate volume confirmation into their analysis
Works best with instruments that report accurate, meaningful volume data
Useful for identifying situations where momentum lacks volume support
Less applicable to instruments with sparse or unreliable volume information
Scalpers on liquid markets can spot volume-backed momentum for quick entries and exits
Helps intraday traders distinguish between genuine moves and low-volume fakeouts
Position traders can assess whether institutional participation supports longer-term trends
Effective during news events or market opens when volume spikes often drive directional moves
Swing traders can use volume divergence in projections to anticipate potential reversals
3. Linear Regression Model
The simplest of the three methods, linear regression fits a straight line through recent price data using least-squares mathematics and extends that line forward. These projected prices then generate corresponding RSI forecasts. This creates a clean momentum projection without conditional logic or interpretation of market characteristics. The forecast simply asks: if the recent price trend continues at its current rate of change, where would RSI be in the coming bars?
▶ Practical Implications for Traders:
Delivers a clean, mathematically neutral projection baseline
Functions well during sustained, orderly trends
Involves fewer parameters and produces consistent, reproducible output
Responds more slowly when trend direction shifts
Works best in trending environments rather than ranging markets
Ideal for position traders who want to ride established trends
Useful for swing traders to gauge trend exhaustion when actual RSI deviates from linear projections
Scalpers can use the smooth output as a reference point to measure short-term momentum deviations
Effective baseline for comparing against structure or volume models to measure market complexity
Works particularly well on higher timeframes where trends develop more gradually
🟢 Universal Applications Across All Models
Regardless of which forecasting method you select, the indicator projects future RSI positions that may help with:
▶ Overbought/Oversold Planning: See whether RSI trajectories point toward extreme zones, giving you time to prepare responses before conditions develop
▶ Entry and Exit Timing: Factor projected RSI levels into your timing decisions for opening or closing positions
▶ Crossover Anticipation: Watch for projected crossings between RSI and its signal line (RSI-based MA) that might indicate upcoming momentum shifts
▶ Mean Reversion Context: When RSI sits at extremes, projections can illustrate potential paths back toward the midline
▶ Momentum Evaluation: Assess whether current directional strength appears likely to continue or fade based on projection direction
▶ Divergence Awareness: Use forecast trajectories alongside price action to spot potential divergence formations earlier
▶ Comparative Analysis: Run different projection methods and note where they agree or disagree, using alignment as an additional filter, for instance
▶ Multi-Timeframe Context: Compare RSI projections across different timeframes to identify alignment or conflict in momentum outlook
▶ Trade Management: Reference projected RSI levels when adjusting stops, scaling positions, or setting profit targets
▶ Rule-Based Systems: Incorporate projected RSI conditions into systematic trading approaches for more forward-looking signal generation
Note: It is essential to recognize that these forecasts derive from mathematical analysis of recent price behavior. Markets are dynamic environments shaped by innumerable factors that no technical tool can fully capture or foresee. The projected RSI values represent potential scenarios for how momentum might develop, and actual readings can take different paths than those visualized. Historical tendencies and past patterns offer no guarantee of future behavior. Consider these projections as one element within a comprehensive trading approach that encompasses disciplined risk management, appropriate position sizing, and diverse analytical methods. The true benefit lies not in expecting precise forecasts but in developing a forward-thinking perspective on possible market conditions and planning your responses accordingly.

ORACLE v13: The Gamified Market HUDORACLE v13 is not just an indicator; it is a complete Trading HUD (Heads-Up Display) that translates complex market data into an intuitive, video-game-style interface. It turns abstract concepts like "volatility" and "support/resistance" into actionable game mechanics, allowing you to react faster and trade smarter.
⚔️ Key Features:
🛡️ Boss & Shield Mechanics (Support/Resistance):
Automatic detection of key levels visualized as "Bosses" (Resistance) and "Shields" (Support).
HP System: Watch price "damage" these levels in real-time. When "Boss HP" hits zero, a breakout is imminent.
🔮 The Bestiary (Market Conditions):
Instantly identifies the "Enemy Type" you are fighting:
🟢 SLIME: Squeeze zone (low volatility, prepare for a move).
👺 GOBLIN: Chop/Noise (high risk, avoid trading).
🐉 DRAGON: Strong Trend (ride the momentum).
👹 BERSERKER: Extreme Volatility (proceed with caution).
📈 Live Structure Mapping:
Real-time ZigZag overlays with automatic HH/LL/LH/HL labels.
Breakout Flash: Candles flash WHITE instantly when major structure or Boss levels are broken.
🎮 Combat Stats:
Combo Counter: Tracks consecutive directional candles.
Aggro Meter: Visualizes volume intensity.
Loot Drop Rate: innovative metric calculating the probability of a profitable move based on current ATR.
Momentum Bar: RPG-style health bar for trend strength.
Why use ORACLE? Most indicators just draw lines. ORACLE gives you Context. It tells you exactly what kind of market environment you are in so you never bring a knife to a Dragon fight. Perfect for scalpers and day traders who need instant situational awareness.
Settings: Fully customizable Lookback periods, ZigZag sensitivity, and Visual Themes.

Hybrid CCI Scalper ProHybrid CCI Scalper Pro is a sophisticated trading system designed to solve the biggest problem in scalping: False Signals in Choppy Markets.
Unlike standard CCI indicators that fire on every crossover, the HCS Pro uses a Hybrid Logic Engine that distinguishes between high-probability Trend Continuations and powerful Reversal Setups. It processes every potential entry through a 6-factor "Quality Filter" before generating a signal.
Core Features:
1. The Hybrid Signal Engine The script identifies two distinct market conditions:
TREND Mode: Triggers when price is aligned with the Daily/Local trend AND the CCI angle is steep.
REVERSAL Mode (REV): Triggers only on Extreme Momentum (steep angle) combined with a Zero-Line cross, allowing you to catch tops and bottoms without waiting for lagging trend indicators.
2. The Quality Scoring System (Q-Score) Every signal is rated from 0 to 6 stars based on confluence. The signal label shows Q: 4/6, Q: 5/6, etc.
Score 4+: High probability (Recommended).
Score 6: "The Perfect Storm" – All filters (Trend, Volume, RSI, ADX) align.
3. The "Ironclad" Filters To eliminate fake-outs, the script enforces strict rules:
Candle Color Guard: Never Buys on a Red candle or Sells on a Green one.
Angle validation: Flat CCI movement is ignored.
MTF Trend: Checks the Daily timeframe (D1 EMA) to ensure you aren't scalping against the major flow.
Noise Filter: Uses ATR and Volume to ignore low-volatility "dead" markets.
4. The Information Panel A clean dashboard on the top-right displays real-time metrics:
Current Daily Trend (Bull/Bear)
Momentum Strength (Weak/Strong/Extreme)
ADX Power (Trending vs Ranging)
Live Signal Score
How to Trade:
BUY Signal: Look for a Green Triangle. Ideally, the Label should say TREND or REV with a Quality Score of 4/6 or higher.
SELL Signal: Look for a Red Triangle with a high Quality Score.
No Signal? If the panel says "WAIT" or the score is low, the market is likely choppy. Stay out.
Recommended Settings:
Gold (XAUUSD): Works best on 15m.
Forex (EURUSD): Works well on 5m - 15m.
Default settings are optimized for a balance between frequency and accuracy.

Liquidity Sweep Sniper AP StyleAP Capital – Liquidity Sweep Sniper (Fab-Style)
📌 Overview
This indicator is a precision scalping tool inspired by professional liquidity-based trading concepts often demonstrated by elite intraday scalpers.
The script focuses on liquidity sweeps followed by strong displacement, aiming to capture short, high-probability momentum moves — particularly effective on lower timeframes (1–5 min) during active market sessions.
It is not a signal spam tool. Signals appear only when multiple objective conditions align.
🧠 Core Concept
Markets do not move randomly — they seek liquidity before expanding.
This indicator identifies:
Buy-side / Sell-side liquidity
Liquidity sweeps (stop-hunts)
Strong displacement candles reclaiming price
Optional higher-timeframe trend alignment
Only when all conditions are met does a signal print.
🔍 What the Indicator Detects
1️⃣ Liquidity Pools
Equal highs or equal lows detected within a configurable lookback
Minimum number of touches required
ATR-based tolerance to adapt to volatility
These levels represent areas where stop orders are likely resting.
2️⃣ Liquidity Sweep
A valid sweep requires:
Price to wick beyond the liquidity level
Candle to close back inside the range
This indicates failed breakout / stop-hunt behaviour.
3️⃣ Displacement Confirmation
After the sweep, the candle must show:
Strong body (default >60% of candle range)
Candle range large relative to ATR
Clear directional intent (momentum)
This filters out weak reactions and chop.
4️⃣ Optional Trend Filter
EMA-based higher-timeframe bias
Helps align scalps with dominant direction
Can be enabled or disabled
📈 Signals
BUY: Sell-side liquidity sweep → bullish displacement
SELL: Buy-side liquidity sweep → bearish displacement
Signals are plotted directly on the chart and can be used with alerts.
⚙️ Recommended Usage
Markets: XAUUSD, indices, liquid FX pairs
Timeframes: 1m–5m
Sessions: London & New York (best performance)
Risk Management: Always required — this tool does not place trades
Best used as a confirmation tool, not standalone.
⚠️ Important Notes
This indicator is inspired by liquidity-based scalping concepts, not an exact replication of any individual trader’s private strategy.
No indicator predicts the future — this tool highlights high-probability scenarios, not guarantees.
Past performance is not indicative of future results.

[ARTIO] TTG Levels Pro: The Grail (S.C.T.) TTG Levels Pro Professional Multi-Timeframe & Intraday Analysis Tool
This indicator is a comprehensive solution for analyzing Key Levels across multiple timeframes and tracking intraday structure. It automates the calculation of significant Support/Resistance zones and provides real-time Volume Weighted data.
How it works (Technical Methodology):
Multi-Timeframe Levels (HTF): The script uses request.security() to fetch High and Low pivot data from higher timeframes (1M, 1W, 1D, 4H, 1H). It identifies the most relevant "unbroken" range levels and projects them onto the current chart.
Intraday Structure (VWAP & Bisector):
VWAP (Volume Weighted Average Price): Calculated cumulatively from the start of the trading day. This represents the fair value based on volume distribution.
Daily Bisector (Midpoint): Calculates the 50% retracement level of the current daily range (High + Low) / 2. This updates dynamically with every tick as the daily range expands.
Visualization Engine:
History Mode: Users can toggle "Path" mode to see how the VWAP and Bisector levels evolved throughout the session (stepline visualization).
Clean Mode: Users can switch to a straight-line projection to keep the chart clean, focusing only on current values.
Features:
Monitor 6 Timeframes simultaneously.
Dynamic Alert System (Price Proximity & Trend Direction).
Synergy Detection: Alerts when multiple timeframe levels cluster together within a defined % range.
Customizable Dashboard Table.
Settings are fully customizable via the inputs menu.

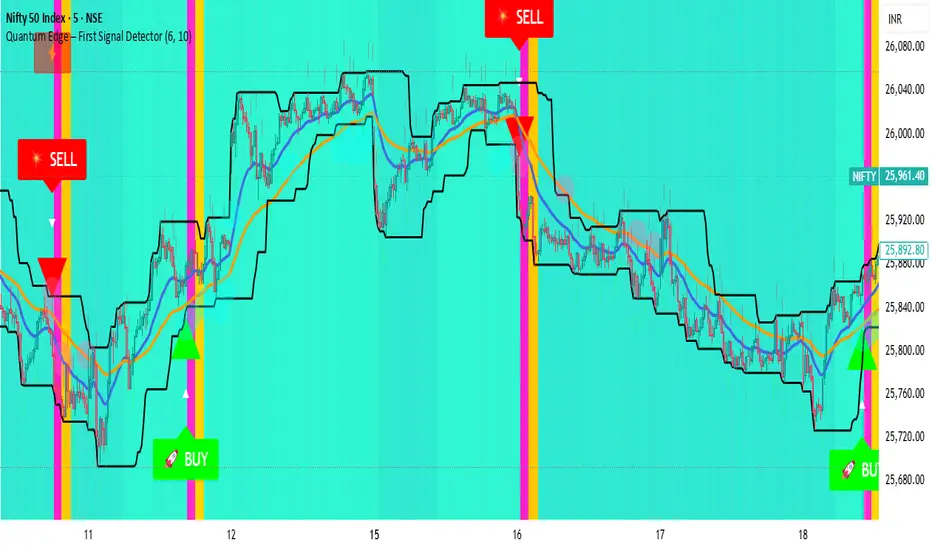
Quantum Edge First Signal DetectorQuantum Edge is a non-repainting, multi-confirmation indicator that detects the first high-probability BUY & SELL signals using momentum, trend, volume, volatility, and price-action voting logic.
🧠 About This Indicator
Quantum Edge – First Signal Detector is designed to solve one common trader problem:
too many late or repeated signals.
Instead of firing continuous entries, this indicator focuses only on the FIRST valid signal after a market shift — helping traders enter early, reduce noise, and avoid over-trading.
It uses a quantum-style voting engine where multiple independent market factors must align before a signal is confirmed.
⚙️ Core Logic (How It Works)
Each candle is evaluated using 6 independent factors:
RSI Momentum
Bullish when RSI > 50
Bearish when RSI < 40
Price Location
Price near recent highs or lows
Volume Expansion
Current volume above moving average
EMA Trend Direction
EMA 20 vs EMA 50
Candle Strength
Strong bullish or bearish candle bodies
Volatility Filter
ATR-based low volatility confirmation
Each factor gives 1 vote.
When minimum confirmations are met, a FIRST BUY or FIRST SELL signal is generated.
🚀 Key Features
✅ First-Signal-Only Logic
Only the first BUY or SELL after trend change
No repeated signals in the same direction
Built-in signal cooldown (user-controlled)
✅ Non-Repainting
Signals are confirmed on candle close
No future data, no repainting
✅ Smart Trend Filtering
EMA-based directional bias
Avoids weak counter-trend entries
✅ Advanced Visual System
Clear BUY / SELL triangles
Trend, volume & momentum backgrounds
Support & resistance zones
Market sentiment bar coloring
✅ Alert Support
Buy alert
Sell alert
📊 Best Timeframes
Scalping: 1m – 5m
Intraday: 5m – 15m
Swing Confirmation: 30m – 1H
Works on:
Forex
Crypto
Indices
Stocks
🎯 How to Trade (Simple Guide)
BUY Setup
✔ First BUY signal appears
✔ Trend is bullish
✔ Use nearby support as reference
SELL Setup
✔ First SELL signal appears
✔ Trend is bearish
✔ Use nearby resistance as reference
Always combine with risk management.
Disclaimer: This indicator is for educational purposes only and does not constitute financial advice. Trading involves risk. Use proper risk management.