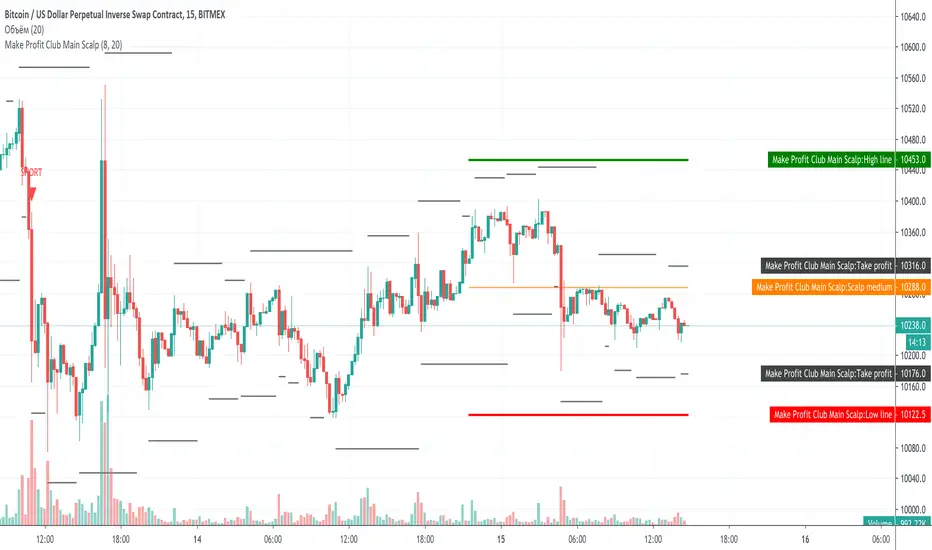
Make Profit Club Main ScalpThe main scalping indicator.
We use this indicator to trade for a short time in a TF of 5-15 minutes.
We have created takeprofit zones for you so that you can understand where we can get to and take your profit. these points are mostly very helpful.
There are basic settings that allow you to adjust the indicator individually for each situation; because of this, this indicator can be used for any exchange and any currency pair.
For Scalp trading, we use 3 different strategies available to our clients. If you enter them correctly, you can never see the minus sign.
Use the link below to obtain access to this indicator.
Scalp
Trend Scalper (Expo)Trend Scalper (Expo)
DESCRIPTION
Trend Scalper (Expo) is a Scalping strategy based on RSI, Stochastic and moving averages techniques. The idea is to visualize scalping opportunities in trends.
The trend is determined by the color of the moving average called ‘TrendHolder’ The ‘Trendholer’ consists of 3 colors, green, red and orange. Green is a positive trend, red is a negative trend and orange is a neutral or no trend.
Scalping opportunities are visualized by the circles and the triangles. The circles are based on RSI calculation. The triangles are based on Stochastic calculation.
- If there is a green circle and a green triangle and ‘Trendholder’ is orange or green, Enter Long!
- If there is a red circle and a red triangle and ‘Trendholder’ is orange or red, Enter Short!
Combine the indicator with HEIKIN ASHI candlesticks.
HOW TO USE
1. Use the indicator to find scalping opportunities in trends.
I NDICATOR IN ACTION
BTCUSD
EURUSD
GOLD
The indicator works with RENKO, HEIKIN ASHI and with KAGI charts as well.
I hope you find this indicator useful, and please comment or contact me if you like the script or have any questions/suggestions for future improvements. Thanks!
I will continue to work on this indicator, so please share your experience and feedback with me so that I can continuously improve it. Thanks to everyone that have contacted me regarding my scripts. Y our feedback is valuable for future developments!
ACCESS THE INDICATOR
• Contact me on TradingView or use the links below
-----------------
Disclaimer
Copyright by Zeiierman.
The information contained in my scripts/indicators/ideas does not constitute financial advice or a solicitation to buy or sell any securities of any type. I will not accept liability for any loss or damage, including without limitation any loss of profit, which may arise directly or indirectly from use of or reliance on such information.
All investments involve risk, and the past performance of a security, industry, sector, market, financial product, trading strategy, or individual’s trading does not guarantee future results or returns. Investors are fully responsible for any investment decisions they make. Such decisions should be based solely on an evaluation of their financial circumstances, investment objectives, risk tolerance, and liquidity needs.
My scripts/indicators/ideas are only for educational purposes!

Master ScalpA unique scalpel indicator with high accuracy analyzes the market and determines the points for entering a position. Allows you to trade inside the channel. The algorithm underlying it is protected by copyright.

[astropark] Crypto Swing Trading [strategy]Dear Followers,
today a Swing Trading Strategy , runnable on a bot , which works great from 30m timeframe and above. Best suggested timeframes are 1h and 4h.
If you are a scalper, you will love suggested entries for fast profit. You can run it from 1 minute timeframe if you are used to scalp trading and close each trade whenever you fell happy (a proper trailing stop strategy is suggested anyway).
This strategy can trigger till 5 or 20 buy or sell signals in a row before reverting (it changes greatly depending on timeframe you use), so use a proper money management .
Strategy results are calculated on the timeframe from January 2018 to now, so on about 2 years, using 10000$ as initial capital and working at 3x leverage (very safe leverage!).
This is not the "Holy Grail", so use a proper risk management strategy.
This script will let you backtest this script.
The alarms version of this indicator, which will let you set all notifications you may need in order to be alerted on each triggered signals, can be found by searching for "Crypto Swing Trading" and then choosing the "alarms" version.
This is a premium indicator , so send me a private message in order to get access to this script.

Scalp Master V1.1This version has added support and resistance to help traders identify the best entry and exit points.
Also, we included a linear regression band to identify the last period's trend, the prices would normally swing between the upper and lower dotted white line and it gives a good starting point for traders to identify possible bounces or rejection moments of the price.

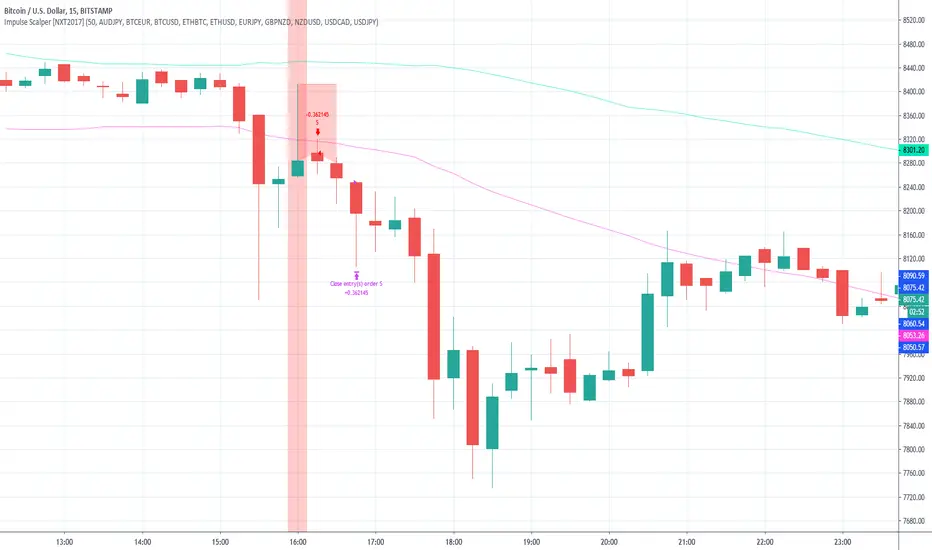
Impulse Scalper [NXT2017] - with included market scannerPrivate Indicator.
HI BIG PLAYERS,
with this indicator it is possible to analyze small rebound effects in the trading market and to scalp the movement into the trend again.
HOW IT WORKS
Hereby the indicator use a candleformation with a huge wick inside of a band, based on a Simple Moving Average on the 50 highs and 50 lows.
A signal is shown with vertical red/green background around the bar for selling/buying. Furthermore, the high/low of the signal serves as StopLoss line and makes a horizontal red line inside the active trading time. The trade is to closing if the second candle after the signal is finished.
For example:
1. candle => signal
2. candle => entry on open price with the SL
3. candle => nothing to do
4. candle => close your trade after candle 3 is finished
For the analysis I have set the following settings:
Initial Capital: 100 000 (the default setting)
Base Currency: USD
OrderSize: 3% of equity
Pyramiding: 1 orders
Commission 0%
Verify Price For Limit Orders: 0 ticks
Slippage 0 ticks
Recalculate:
After Order is Filled (deactived)
On Every Tick (deactived)
A market scanner is also integrated in this indicator. Since good signals rarely occur in a market, the market scanner allows up to 10 markets to browse for the signals simultaneously. My favorite markets are currently selected as default.
The 10 default markets are:
AUDJPY
BTCEUR
BTCUSD
ETHBTC
ETHUSD
EURJPY
GBPNZD
NZDUSD
USDCAD
USDJPY
Market Scanner in action (in the settings you can also hide the labels):
Of course, alerts are also possible with the TradingView Alerts system. For example it's possible to get a message per signal to your e-mail, that you use on TradingView.
Access to the indicator: use the link below, thanks for your attention!
Kind regards
NXT2017
Scalp Master V 1.0The Scalp Master is designed for new and experienced trainers to get a better understanding of sudden direction changes in the cryptocurrencies markets, by displaying just 2 basic signals: "Up" or "Down".
It combines the T.A of a group of indicators to give you the most sensitive tool to catch a Pump or Dump before it happens. It also includes one of the most basic and powerful tools to understand how the market is going to behave: Bollinger Bands, if we get an "Up" signal near the lower Bollinger band, we might be close to a good pump and if we get a "Down" signal near the top Bollinger band a dump in the price will most likely happen.
Enjoy!!!

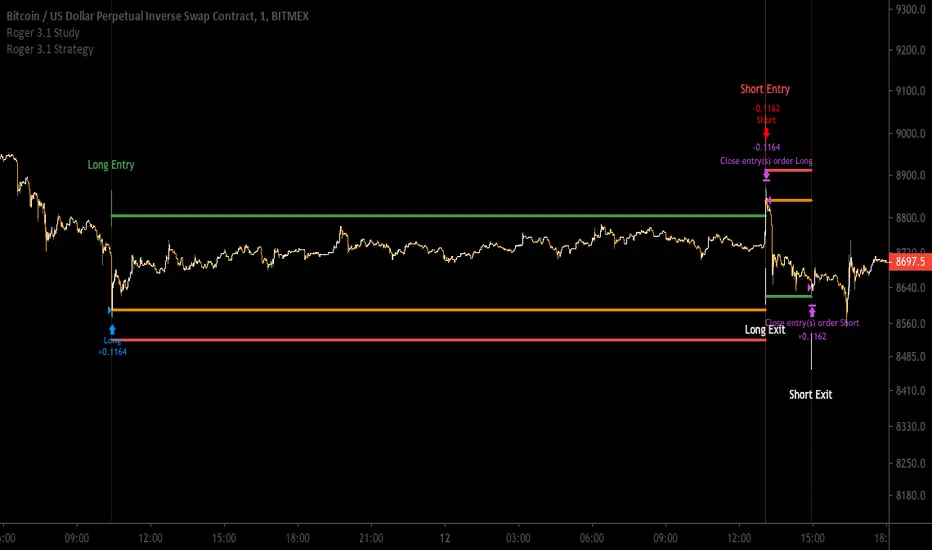
[Aill3urs V.1.1.P] Study RogerThis INVIT-ONLY study is based on Noise / Fixe TP & SL / EMA and you can optimize it with trends and work on low timeframe < 5min
Please use comment section for any feedback.
For any question DM me for any request.
## DISCLAIMER
1. I am not licensed financial advisors or broker dealers. I do not tell you when or what to buy or sell. I developed this software which enables you execute manual or automated trades multiple trades using TradingView. The software allows you to set the criteria you want for entering and exiting trades.
2. Do not trade with money you cannot afford to lose.
3. I do not guarantee consistent profits or that anyone can make money with no effort. And I am not selling the holy grail.
4. Every system can have winning and losing streaks.
5. Money management plays a large role in the results of your trading. For example: lot size, account size, broker leverage, and broker margin call rules all have an effect on results. Also, your Take Profit and Stop Loss settings for individual pair trades and for overall account equity have a major impact on results. If you are new to trading and do not understand these items, then I recommend you seek education materials to further your knowledge.
**YOU NEED TO FIND AND USE THE TRADING SYSTEM THAT WORKS BEST FOR YOU AND YOUR TRADING TOLERANCE.**
**I HAVE PROVIDED NOTHING MORE THAN A TOOL WITH OPTIONS FOR YOU TO TRADE WITH THIS PROGRAM ON TRADINGVIEW.**

[Aill3urs V.0.5] Study AlbertIt's the Study of the this Aill3urs-V-0-4-Strategy-Albert-EMA-Level-S-R-William you can find below.
For any info DM me.
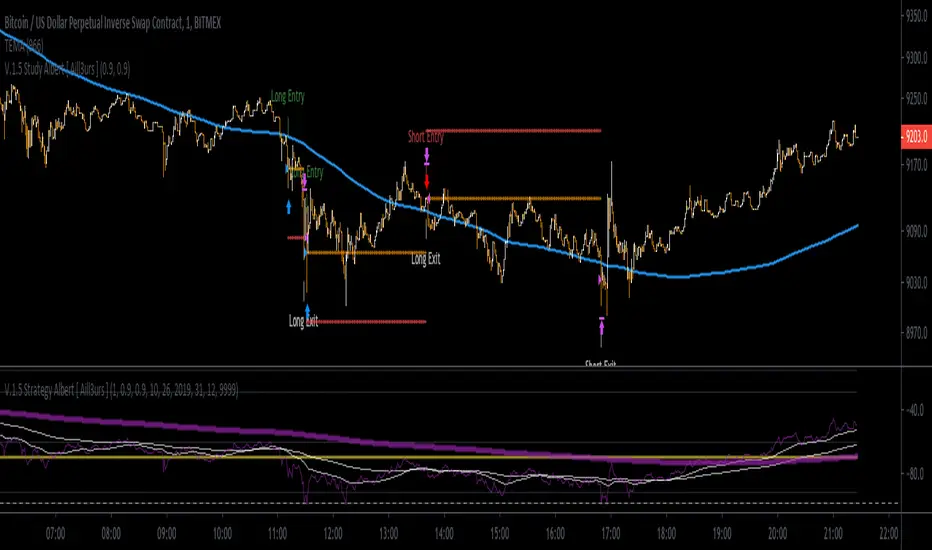
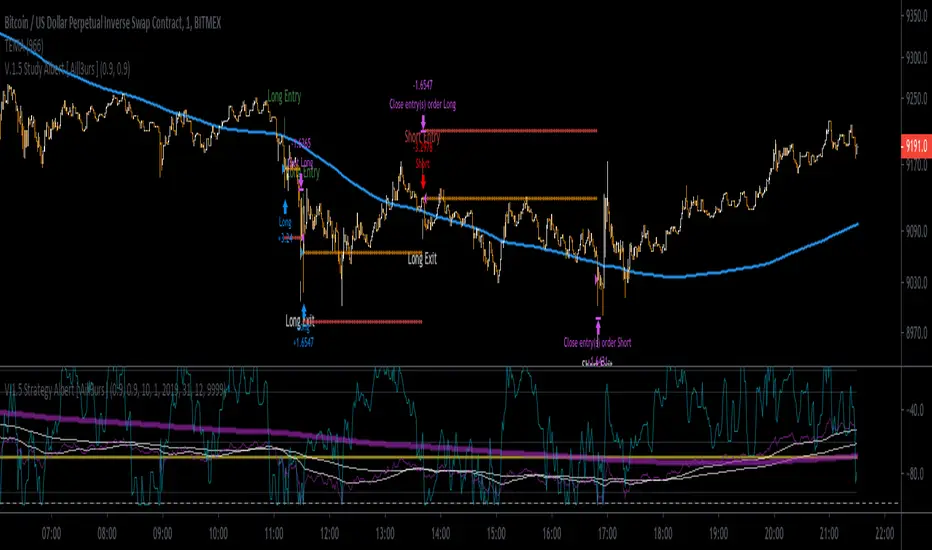
[Aill3urs V.0.4] Strategy Albert - EMA / Level / S&R/ WilliamThis INVIT-ONLY strategy is based on EMA / William / Level / Support & Resistance / Trends and work on low timeframe < 5min
NOTE: you can add this strategy to your chart and you should test different timeframe
Please use comment section for any feedback.
I have also a study with alarms Long Entry / Long Exit / Short Entry / Short Exit
For any question DM me for any request.
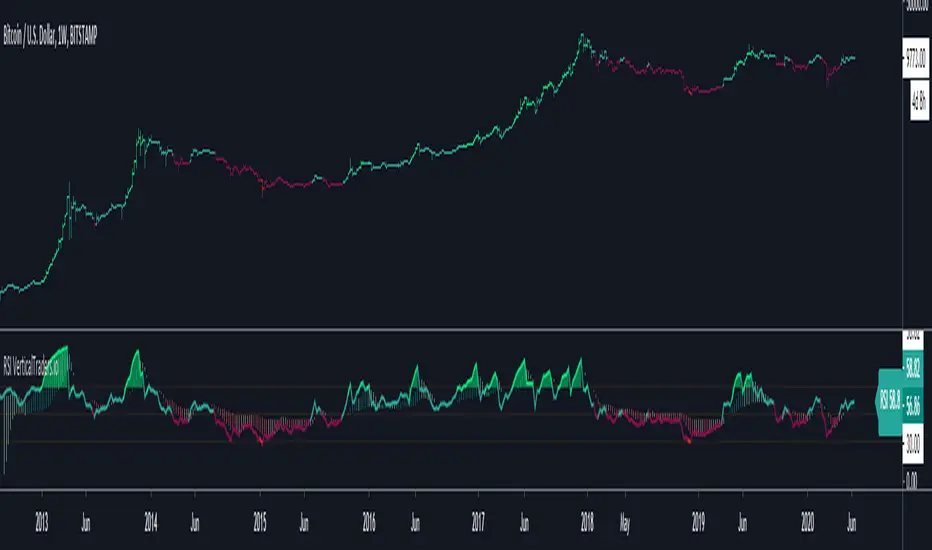
Stochastic RSIStochastic RSI
It is generally used to generate signals when crossings are made in overbought or oversold areas,
but it is important to take advantage of these signals according to the general trend, in this way we avoid false signals.
Overbought doesn't necessarily mean the price will reverse lower, just like oversold doesn't mean the price will reverse higher.
Rather the overbought and oversold conditions simply alert traders that the RSI is near the extremes of its recent readings.
So the main idea will be to use the signals as long as we are trending in the same direction,
the other crosses will be used as signals to take profits or as warning signs to check our trades.
Extra functions in this indicator:
- Trend background.
- Long and Short Labels base on trend and take profit warnings.
- Alerts for long and short entries and take profit warnings.
Take Profit / Warning Labels enable (Orange)

Heiken AshiHeikin Ashi charts are similar to candle charts, but the main difference is that a Heikin Ashi chart uses daily price averages to show the movement of the average price of an asset.
The idea is to use the heikin Ashi technique as an indicator and not as the main chart, to avoid enter or exist the market too late.
Key concepts:
- The averaged open and close help filter some of the market noise, creating a chart that tends to highlight the trend direction better than typical candlestick charts.
- The downside is that some price data is lost with averaging. The most recent price (close) may not reflect the actual price of the asset, which could affect risk.
- Long down candles with little upper shadow represent strong selling pressure. Long up candles with small or no lower shadows signal strong buying pressure.
Extra functions in this indicator:
- Trend Bar indicator, uptrend(green), downtred(red), warning or indecision (yellow).
- Long and Short Labels base on trend and Heikin Ashi entries.
- Change the color of the main chart Candlesticks as the Heikin Ashi indicators.
- Alerts for long and short entries.
- Size of Labels.
Bollinger BandsBollinger bands are calculated from a moving average, creating two curves that involve the price chart, these bands are defined by a standard deviation generally of value 2 with respect to the moving average.
Applications:
- They show the volatility of the market, when the bands are compressed, the volatility decreases, when the bands extend, the volatility increases.
- Trend, with respect to the moving average according to the location of the price corresponding to the positive or negative standard deviation.
Extra functions in this indicator:
- You can use several types of moving averages for the calculation: SMA, EMA, DEMA, TEMA, WMA, VWMA, HullMA, TMA, SMMA, SSMA, etc.
- Background: Shows the zone equivalent to a standard deviation of 1 and 2 with different color.
- Log chart: It can be used on logarithmic price scales, to avoid distortions in those charts.
- Multimeframe: so you can visualize the behavior in different timeframes without changing timeframe.
- Interpolation: Round the curves when viewing larger timeframes.
Multitimeframe example: 1D, select timeframe to Bollinger bands 1W and log chart
Same chart with interpolation

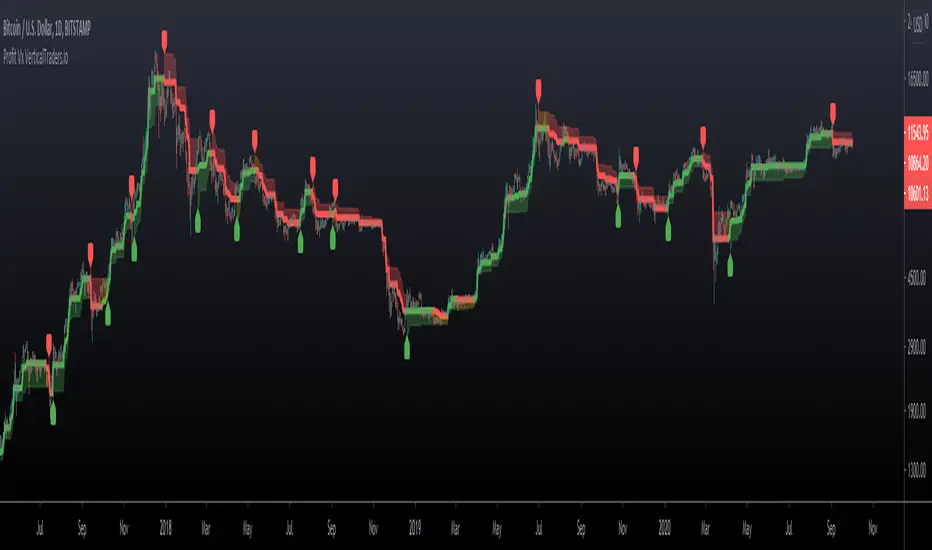
Profit VxProfit Vx
- Labels for Long and Short entries
- Take Profit point base on %
- Candlestick color, orange is warning or not trending zone
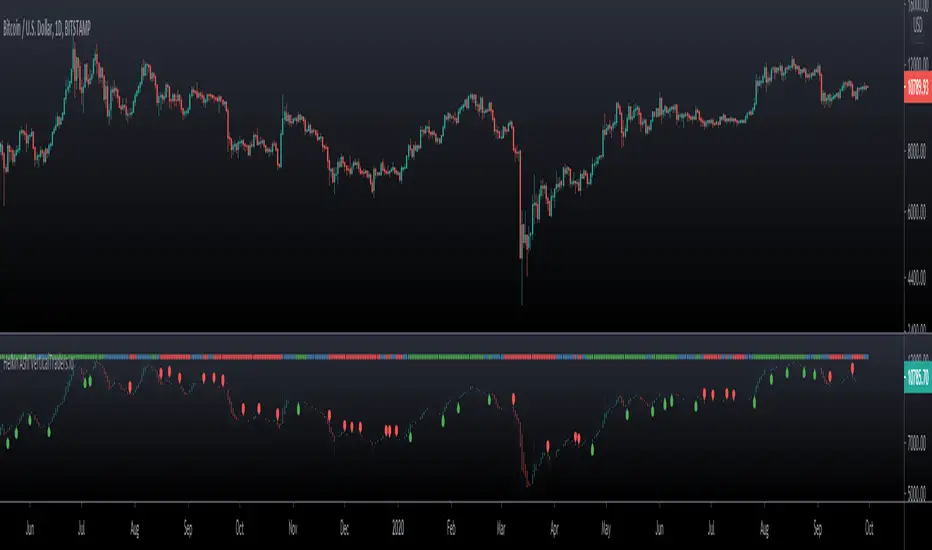
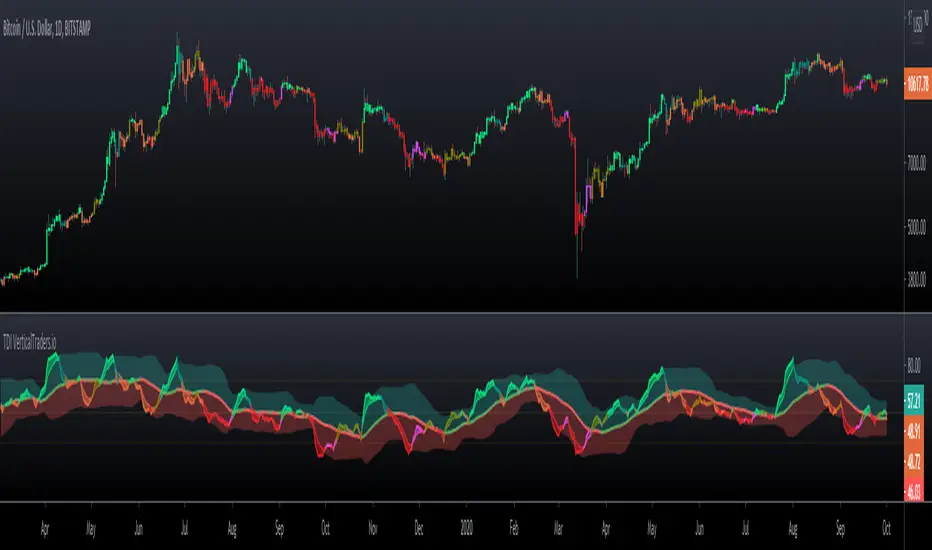
TDITDI
- Calculate strength and market direction by analyzing relative strength
- Ribbon mode, according to the TDI conditions
- Candlestick same as TDI Ribbon colors
- 6 colors to define market strength
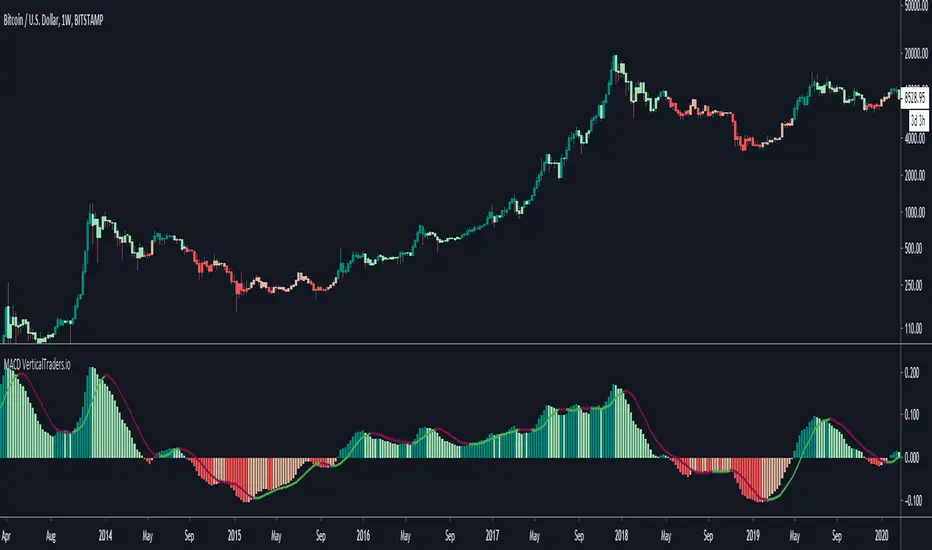
MACDMACD
- Enhanced MACD
- Shows the MACD in a simple way, to facilitate its analysis
- Histogram mode and Normal mode
- MACD color depends on its values
- Candlestick same as MACD colors
- Calculate the MACD with EMA or SMA
- Allow to use the RSI Source for calculations
- Log chart option
Scalping BerkinAlex 1
--------Inglés---------
Updated to Pine Script v4. 👌
Added labels (indicators) of Purchase and Sale according to moving averages for scalping and intraday. 🤑
Fusion of the "Scalping BerkinAlex 3" indicator with the "Scalping BerkinAlex 1", so as not to occupy a slot of indicators unnecessarily if you have a free account. 😜
Alert system designed, now you can create an alert in free mode according to the possibility of buying or selling an asset.🔔
Errors found fixed.💪
---------Español---------
Actualizado a Pine Script v4. 👌
Añadidas etiquetas (indicadores) de Compra y Venta según medias móviles para scalping e intradía. 🤑
Fusión del indicador "Scalping BerkinAlex 3" con el "Scalping BerkinAlex 1", para así no ocupar un slot de indicadores innecesariamente en caso de disponer cuenta gratuita. 😜
Sistema de alertas diseñado, ahora podrás crear una alerta en modo gratuito según exista la posibilidad de comprar o vender un activo.🔔
Errores encontrados solucionados.💪

Extreme ScalpingThis is a test of an easy scalping method: buy if actual close is below forecast close and sell if actual close is above forecast close. Take profit and stop loss shall be very small (few pips) as in most of scalping strategies.
No filter is used for only long or only short positions, but you can select buy only or sell only based on other indicators or whatever you feel is the direction of trading.
NOTE: you can add this strategy to your chart but you should modify the backtest day otherwise you will get an error due to calculation limits of pine script. For example, on one minute chart, you should set the backtest day from today only. For past days, set both start day and and day.
I have also a study with alarms.
Please use comment section for any feedback.

ZomyzoX Scalp 1 MinuteEnglish
XBTBTC, BTCUSD , BTCUSDT is a strategy made to parity for 1 minute. Scalp is a very successful strategy for trading. It is free to use. Optionally, other strategies can be written.
Contact
Twitter: @zomyzox
Mail: oguzhan.yilmaz@hotmail.com.tr
Türkçe
XBTBTC, BTCUSD , BTCUSDT paritesi için 1 DK'da scalp trade için yazılmıştır. Scalp trade için başarılı buluyorum. Kullanımı ücretsizdir. İsteğe göre başka stratejilerde yazabilirim.
İletişim
Twitter: @zomyzox
Mail: oguzhan.yilmaz@hotmail.com.tr

CCI Stochastic and a quick lesson on Scalping & Trading SystemsHello traders
Still on holidays but I don't and will never forget you <3
I realize more and more that you guys don't only want some indicators and learn about pinescript. You also want some guidance and get some mentors providing you with comprehensive and simple trading methods and tricks.
I'm against those posting many scripts a day that in the end will make you lose your money because they don't give you the methodology to use them
It might look nice on the charts but we're not here to do some painting.... but to improve our lifestyle right :)
The today indicator is based on an indicator that I used for scalping : Fxcodebase CCI Stochastic
A CCI stochastic is very reactive and allows us to take many scalps trades per day with a few pips/USD gain for each trade. I don't recommend novice traders to use it and I strongly recommend everyone reading my disclaimer below basically saying "I'm not a financial advisor, don't be dumb, stay safe"
(I also recommend the few scripts copy-pasters to read my disclaimer as well)
What's a novice trader, sir? Well... thanks for asking. A novice trader is any trader with less than 5 years of live trading experience
From a pinescript perspective, this script will be however interesting for everyone :)
How to use it?
The indicator gives 3 possible entries for Longs and Shorts:
- Arrows at Enter - Will give signals whenever the Stoch CCI will enter in the BUY/SELL zone
- Arrows at Exit - Will give signals whenever the Stoch CCI will exit the BUY/SELL zone
- Arrows at Center - Signals whenever the Stoch CCI will cross the mid-line (50)
All arrows have different colors because ... painting is cool and nice.... kidding.... it gives clearer and more readable signals on the chart (but painting sir...)
A possible trading method could be to use the 3 modes at the same time to get the maximum of opportunities.
The safer bet is to use the "Arrows at Exit" only mode but for those who want to accumulate more scalping positions, adding the "Arrows at Enter" mode is an option as well. In other words, you accumulate a few scalping positions whenever the Stoch CCI get in the BUY/SELL zone and will stop accumulating whenever it will exit the BUY/SELL zone
You can add a few extra positions whenever the Stoch CCI will cross the mid-line as it often translates in a trend continuation
Life hack
Very important note : (probably the most important gem I shared until now) The inputs set by default will have to be changed for your asset/timeframe and can't be generic for everything. You have to play with the inputs until the signals will make sense to you
The indicator/strategy with a unique configuration that you'll never check or update according to the market condition DOES NOT exit.
If you find such a tool and prove me that you're making constant gains with it over a year, please patent it and then show it to me as I'd like to study it to replicate :) But most likely this is a myth/unicorn
Who I am to say this? Well, I worked in a Bank with real traders and I have a good sense of what works and what will certainly not work
My guru said scalping crypto in 1 second timeframe was the way to get rich quick. Do you agree sir?
But in trading, this is not because you take the maximum of trades possible that your gains will increase. This is the contrary.
There is a strong and proven inverse correlation between the number of trades taken and how fast you'll burn your capital. A swing trader taking 2/3 trades a month is more likely to beat 99% of the scalpers out there trying to predict all market movements. (and I'm not even talking about how dangerous it is to scalp with leverage)
You're starting to know me a bit more right now. I prefer to tell you what you need to hear vs what you want to hear because the second option doesn't allow to stay in the game very long.
I might lose some futures clients along the way by saying that but for my own conscience and ethics, I prefer to warn about the true risks of trading and to select who you listen very carefully (the advice also works for me, if you feel what I said doesn't make sense, this is totally your right but I hope this is because I'm french and not because of the content ^^).
See you tomorrow for another indicator or idea
Love you all
Dave
____________________________________________________________
Be sure to hit the thumbs up. Building those indicators take a lot of time and likes are always rewarding for me :) (tips are accepted too)
- If you want to suggest some indicators that I can develop and share with the community, please use my personal TRELLO board
- I'm an officially approved PineEditor/LUA/MT4 approved mentor on codementor. You can request a coaching with me if you want and I'll teach you how to build kick-ass indicators and strategies
Jump on a 1 to 1 coaching with me
- You can also hire for a custom dev of your indicator/strategy/bot/chrome extension/python
Disclaimer:
Trading involves a high level of financial risk, and may not be appropriate because you may experience losses greater than your deposit. Leverage can be against you.
Do not trade with capital that you can not afford to lose. You must be aware and have a complete understanding of all the risks associated with the market and trading. We can not be held responsible for any loss you incur.
Trading also involves risks of gambling addiction.
Please notice I do not provide financial advice - my indicators, strategies, educational ideas are intended to provide only some source code for anyone interested in improving their trading
The proprietary indicators and strategies developed by Best Trading Indicator, the object of intellectual property rights are and remain the exclusive property of Best Trading Indicator, at the exclusion of images and videos and texts free of rights or provided by the Company or external legal or physical person.
No assignment of intellectual property rights is carried out through these Terms and Conditions.
Any total or partial reproduction, modification or use of these properties for any reason whatsoever is strictly prohibited without the express written authorization of the Company.
